
-
Global warming is expected to reach the Paris Agreement’s 1.5 °C warming target decades ahead of schedule, imposing irreversible impacts on human health and well-being[1,2]. In recent years, extreme heatwaves have occurred worldwide with increasing intensity and frequency, repeatedly breaking temperature records and displaying unpredictable behaviors[3]. In 2023, global heatwave-related deaths reached approximately 178,486, accounting for 0.73% of global mortality[4]. However, this estimate accounts only for heatwave exposure. Elevated ozone (O3) frequently co-occurs with heatwaves[5–7] and exacerbates the associated health hazards[8–11]. However, this interactive effect has been widely overlooked in previous studies, with limited systematic evaluation, contributing to an underestimation of the associated health burden[12]. Under the dual pressures of accelerating global warming and worsening O3 pollution, there is an urgent need to recognize that concurrent exposure to heatwaves and O3 demands global attention.
Previous studies have reported that high O3 concentrations (≥ 160 μg/m3) interactively increase heatwave-related mortality, with relative risks ranging from 1.16 to 1.45 compared to non-heatwave, low O3 conditions[13,14]. A few studies have suggested possible risk amplification at concentrations near 100 μg/m3, although the evidence remains inconclusive.[14,15] However, a knowledge gap persists within the 100–160 μg/m3 range, as the threshold for O3-induced amplification of heatwave effects and the corresponding form of this relationship remain undefined. Furthermore, although heatwaves and O3 independently affect a broad range of physiological systems[16–18], evidence remains insufficient to determine which systems incur additional mortality risks under concurrent exposure. Existing burden-of-disease assessments assume homogeneous population susceptibility to concurrent exposures, overlooking potential heterogeneity in vulnerability across population subgroups[19]. Therefore, identifying sensitive disease systems and vulnerable populations, and quantifying their associated health burdens, is essential. This would enable policymakers to set appropriate safety margins and assist clinicians in identifying at-risk patients and prioritizing protection during future warning periods.
China is a highly climate-sensitive region, where ambient temperature and O3 levels generally exceed global averages[20,21]. This study selected the Beijing-Tianjin-Hebei and surrounding areas (BTH) as the study site. Situated in northern China, the region has a historically cooler climate, resulting in limited adaptation to extreme heat. This lack of adaptation, when compounded by frequent heatwaves, rising O3 concentrations, and high population density, renders BTH one of the regions most severely threatened by concurrent exposures[22]. Hence, using a regional time-series design, this study evaluated the effects of concurrent exposure on mortality across multiple disease systems and identified the most sensitive systems. Furthermore, it identified the O3 concentration at which amplification of heatwave effects begins and characterized the interaction pattern during concurrent exposure, including whether the dominant driver was O3 or heatwaves. The study quantified the mortality burden attributable to concurrent exposure and its temporal trends.
-
A time-series study was conducted using daily data on O3, temperature, and mortality from 2013 to 2018 in the BTH. This study evaluated the effects of short-term co-exposure to O3 pollution and heatwaves on multi-system mortality. It identified the O3 concentration threshold at which interactive effects emerged and estimated the attributable fractions during 2013–2018. The study area encompassed 20 cities comprising 59 counties. Counties were included based on data completeness (missing rate < 5%) and the availability of independent outdoor environmental monitoring stations to ensure accurate representation of local population exposure.
-
The study obtained daily mortality records of local residents in the study area from the Disease Surveillance Point System of the Chinese Center for Disease Control and Prevention for the warm season (May 1 to October 31) during 2013–2018. Twenty-eight cause-specific deaths of interest were coded according to the International Statistical Classification of Diseases, 10th Revision (ICD-10), involving non-accidental diseases, diseases of the circulatory system (and its 14 subcategories), the respiratory system (and its 6 subcategories), the urinary system, the nervous system, the digestive system, external causes, and type 2 diabetes mellitus (Supplementary Table S1). Mortality data were stratified by sex (male and female) and age group (0–64 years and ≥ 65 years).
-
Daily concentrations of O3 and fine particulate matter (PM2.5) were obtained from the National Urban Air Quality Real-Time Release Platform of the China National Environmental Monitoring Centre. The daily maximum 8-hour average (MDA8) was calculated as the exposure metric for O3, and the 24-hour average concentration was used for PM2.5[16]. Daily 24-hour average temperature and relative humidity data were obtained from the China Meteorological Data Service Center.
-
Population data and cause-specific mortality rates were collected to estimate the attributable fraction (AF). Considering the relative demographic stability in the BTH, baseline population data were estimated by averaging the results from the Sixth (2010) and Seventh (2020) National Population Censuses conducted by the National Bureau of Statistics of China. Cause-specific mortality rates were obtained from the annual China Health Statistics Yearbooks issued by the National Health Commission of the People’s Republic of China.
-
This study defined concurrent events as compound occurrences in which extreme heat and O3 pollution appeared simultaneously for at least two consecutive days. Extreme heat was defined as a daily mean temperature greater than or equal to the 95th percentile of the temperature distribution for each county from 2013–2018 for at least two consecutive days[23]. To account for variations in heat intensity, additional cutoff values corresponding to the 97.5th and 99th percentiles were examined (Table S2). O3 pollution was defined by the MDA8 concentration using the 2021 World Health Organization air quality guideline (100 μg/m3) and China’s air quality standard (160 μg/m3). To examine the locations of potential interactions, candidate cutoff points were placed at 10 μg/m3 intervals (Table S2). In total, 21 types of concurrent events were defined by combining different extreme heat and O3 cutoff values.
Based on these criteria, all study days were classified into four scenarios: heatwave-only events (Sce_H), referring to days with heatwaves but no O3 pollution; O3 pollution-only events (Sce_O), which recorded O3 pollution in the absence of heatwaves; concurrent events (Sce_HO), when both heatwaves and O3 pollution occurred; and reference days (Sce_ref), referring to days with neither heatwaves nor O3 pollution and representing non-event days.
-
The study assessed the associations between extreme events (Sce_H, Sce_O, and Sce_HO) and mortality using a two-stage time-series approach. In the first stage, county-specific mortality risks associated with the three exposure scenarios were estimated using generalized linear models (GLMs). The models assumed a quasi-Poisson distribution, adjusting for PM2.5, relative humidity, long-term trends and seasonality, and day of the week. The mortality risk estimates were extracted at lag01, where the effects of heatwave or O3 exposure were strongest (Supplementary Figure S1). The covariates and parameter settings of the main model are described in the Supplementary Materials.
In the second stage, a random-effects meta-analysis was performed to estimate the overall mortality risks by pooling county-specific estimates obtained in the first stage. The percentage increase (PI) and corresponding 95% confidence intervals (CIs) were calculated. Stratified analyses were conducted for subpopulations by sex (male and female) and age group (0–64 years and ≥ 65 years). Based on the estimated effect values, the study calculated the relative excess risk due to interaction (RERI), the attributable proportion (AP), and the synergy index (S) to assess additive interactions[24,25], as detailed in the Supplementary Materials.
-
Using the estimated associations, the study calculated the attributable number (AN) and the AF for cause-specific mortality associated with extreme events across the BTH. The equation was as follows[26]:
$$ {\boldsymbol{A}\boldsymbol{N}}_{\boldsymbol{d}\boldsymbol{i}\boldsymbol{c}}=\frac{{\boldsymbol{R}\boldsymbol{R}}_{\boldsymbol{d}}-\mathbf{1}}{{\boldsymbol{R}\boldsymbol{R}}_{\boldsymbol{d}}}\times {\boldsymbol{P}}_{\boldsymbol{i}\boldsymbol{c}}\times {\boldsymbol{I}}_{\boldsymbol{d}\boldsymbol{i}\boldsymbol{c}}\times \boldsymbol{P}{\boldsymbol{E}}_{\boldsymbol{i}\boldsymbol{c}} $$ $$ {\boldsymbol{A}\boldsymbol{F}}_{\boldsymbol{d}\boldsymbol{i}\boldsymbol{c}\boldsymbol{\% }}=\frac{\sum\limits_{\boldsymbol{c}=\left[\mathbf{1}\right]}^{\boldsymbol{m}}{\boldsymbol{A}\boldsymbol{N}}_{\boldsymbol{d}\boldsymbol{i}\boldsymbol{c}}}{{\boldsymbol{F}}_{\boldsymbol{t}\boldsymbol{o}\boldsymbol{t}\boldsymbol{a}\boldsymbol{l}\_ \boldsymbol{d}\boldsymbol{i}}}\times \mathbf{100}\boldsymbol{\% } $$ where $ {\boldsymbol{A}\boldsymbol{N}}_{\boldsymbol{d}\boldsymbol{i}\boldsymbol{c}} $ denoted the number of deaths from disease d attributable to extreme events in year i in city c, and $ {\boldsymbol{R}\boldsymbol{R}}_{\boldsymbol{d}} $ indicated the relative risk (RR) of mortality for disease d associated with exposure to extreme events. $ {\boldsymbol{P}}_{\boldsymbol{i}\boldsymbol{c}} $ represented the population of city c in year i, estimated using the average population size from the Sixth (2010) and Seventh (2020) National Population Censuses. $ {\boldsymbol{I}}_{\boldsymbol{d}\boldsymbol{i}\boldsymbol{c}} $ denoted the expected daily mortality count on referent days, estimated using the annual daily mortality counts for city c, year i, and disease d. $ \boldsymbol{P}{\boldsymbol{E}}_{\boldsymbol{i}\boldsymbol{c}} $ represented the number of extreme event days for city c in year i. $ {\boldsymbol{A}\boldsymbol{F}}_{\boldsymbol{d}\boldsymbol{i}\boldsymbol{c}\boldsymbol{\% }} $ denoted the AF of mortality for disease d in year i. $ \boldsymbol{m} $ represented the total number of cities included in the BTH, and $ {\boldsymbol{F}}_{\boldsymbol{t}\boldsymbol{o}\boldsymbol{t}\boldsymbol{a}\boldsymbol{l}\_ \boldsymbol{d}\boldsymbol{i}} $ was the total number of deaths from disease d in year i across all included cities in the BTH.
The upper and lower 95% CI values of the pooled RR were used to calculate the 95% CIs of the AN and AF using the equations described above. The absolute increase in AF from 2013 to 2018 was calculated as the difference between the AF in 2013 and that in 2018. The relative increase was calculated as the ratio of the absolute increase to the AF in 2013. The annual absolute increasing rates of AF were estimated and tested using the Theil-Sen median slope estimator, a non-parametric statistical method that identifies monotonic trends in time-series data by calculating the median slope among all pairwise combinations of points, together with the Mann-Kendall test[27].
Sensitivity Analyses Five sensitivity analyses were conducted: (1) varying the degrees of freedom for the long-term time trend and seasonality (4 and 5) and for relative humidity (4 and 5) in the natural cubic splines; (2) using the 24-hour average O3 concentration as the exposure metric; (3) applying a single-pollutant model not adjusted for PM2.5; (4) incorporating “year” as a categorical variable to control for interannual variations; and (5) applying the False Discovery Rate (FDR) correction to additive interaction P-values to account for multiple testing. All analyses were performed using R statistical software (version 4.5.1) with the dlnm, splines, and lme4 packages to model the association between mortality and Sce_HO. Statistical significance was defined as P < 0.05.
-
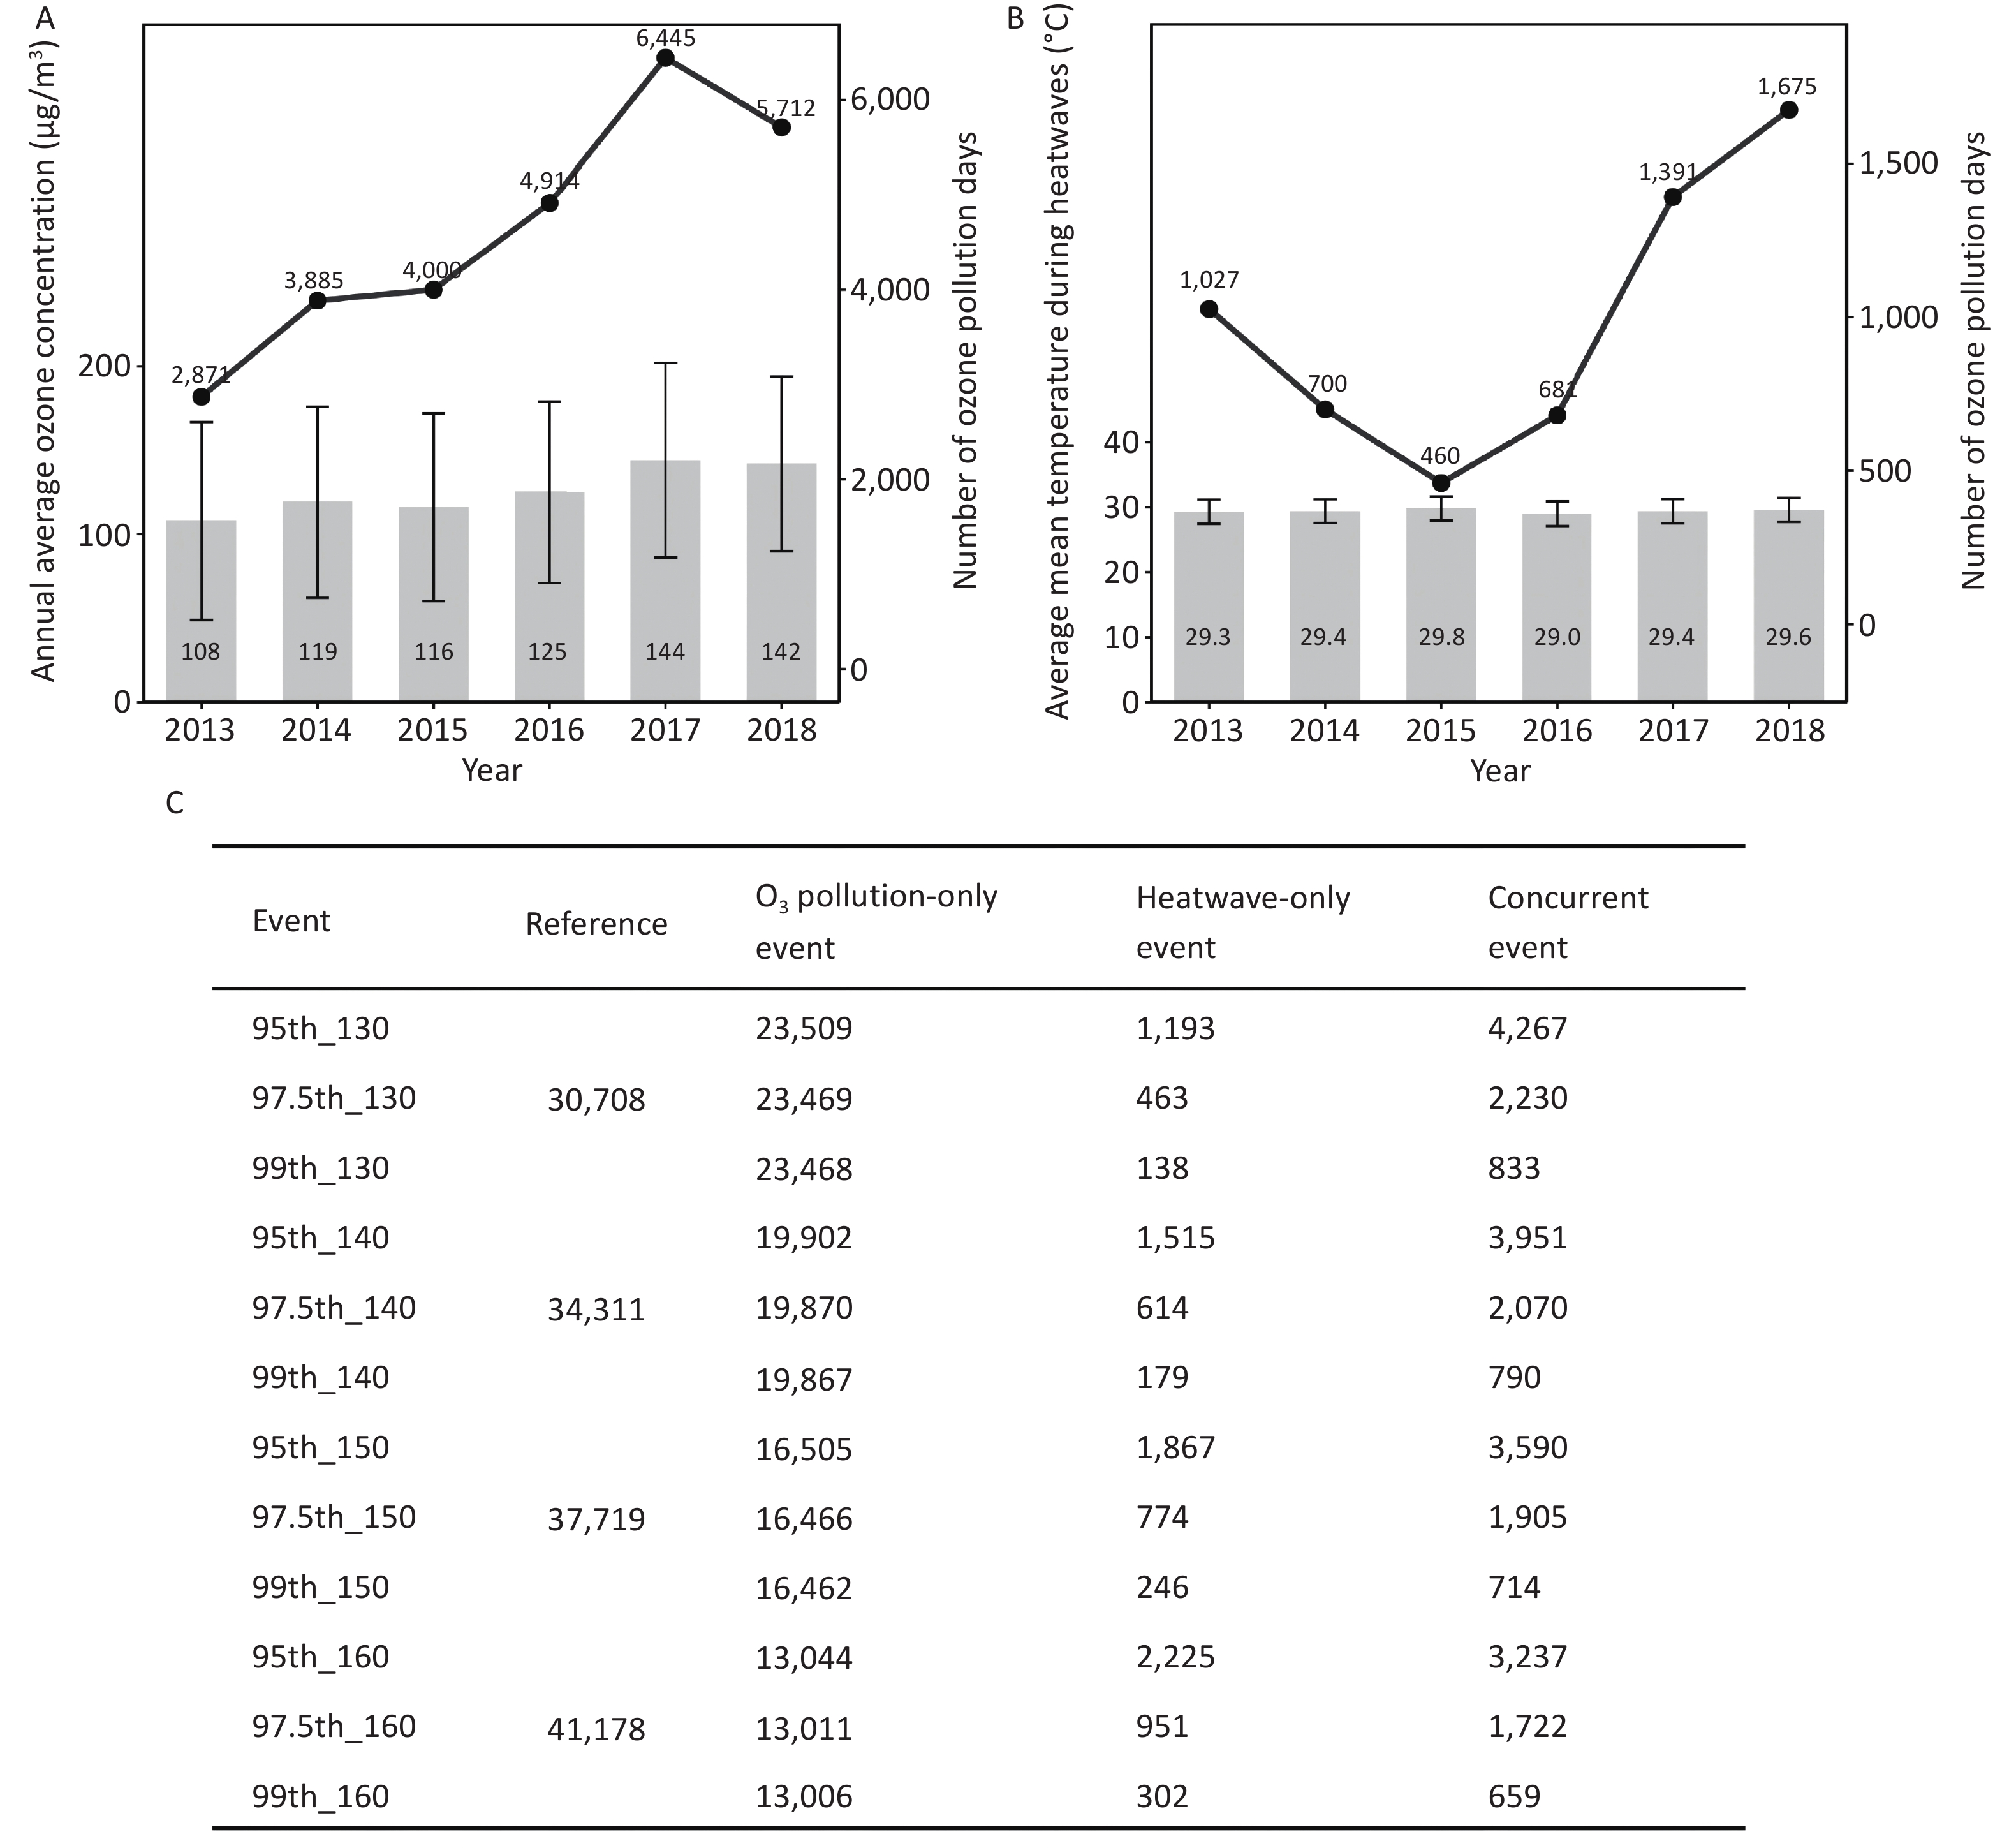
During the warm seasons from 2013 to 2018, the number of O3 pollution county-days (calculated by summing the event days across all 59 counties) increased from 2,871 in 2013 to 5,712 in 2018, accompanied by an increase in the mean O3 concentration from 108 μg/m3 to 142 μg/m3 (Figure 1A). The mean temperature during heatwave days remained between 29.0 °C and 29.8 °C, whereas the frequency of heatwave county-days increased from 1,027 to 1,675 over the same period (Figure 1B). The proportion of Sce_HO increased substantially, from 9.3% in 2013 to 20.5% in 2018. Even under the strictest definition, as many as 659 concurrent county-days were observed (Figure 1C). In total, 615,991 deaths were recorded, of which 47.7% were attributed to circulatory diseases, while females and older adults accounted for 42.6% and 73.4% of all deaths, respectively.
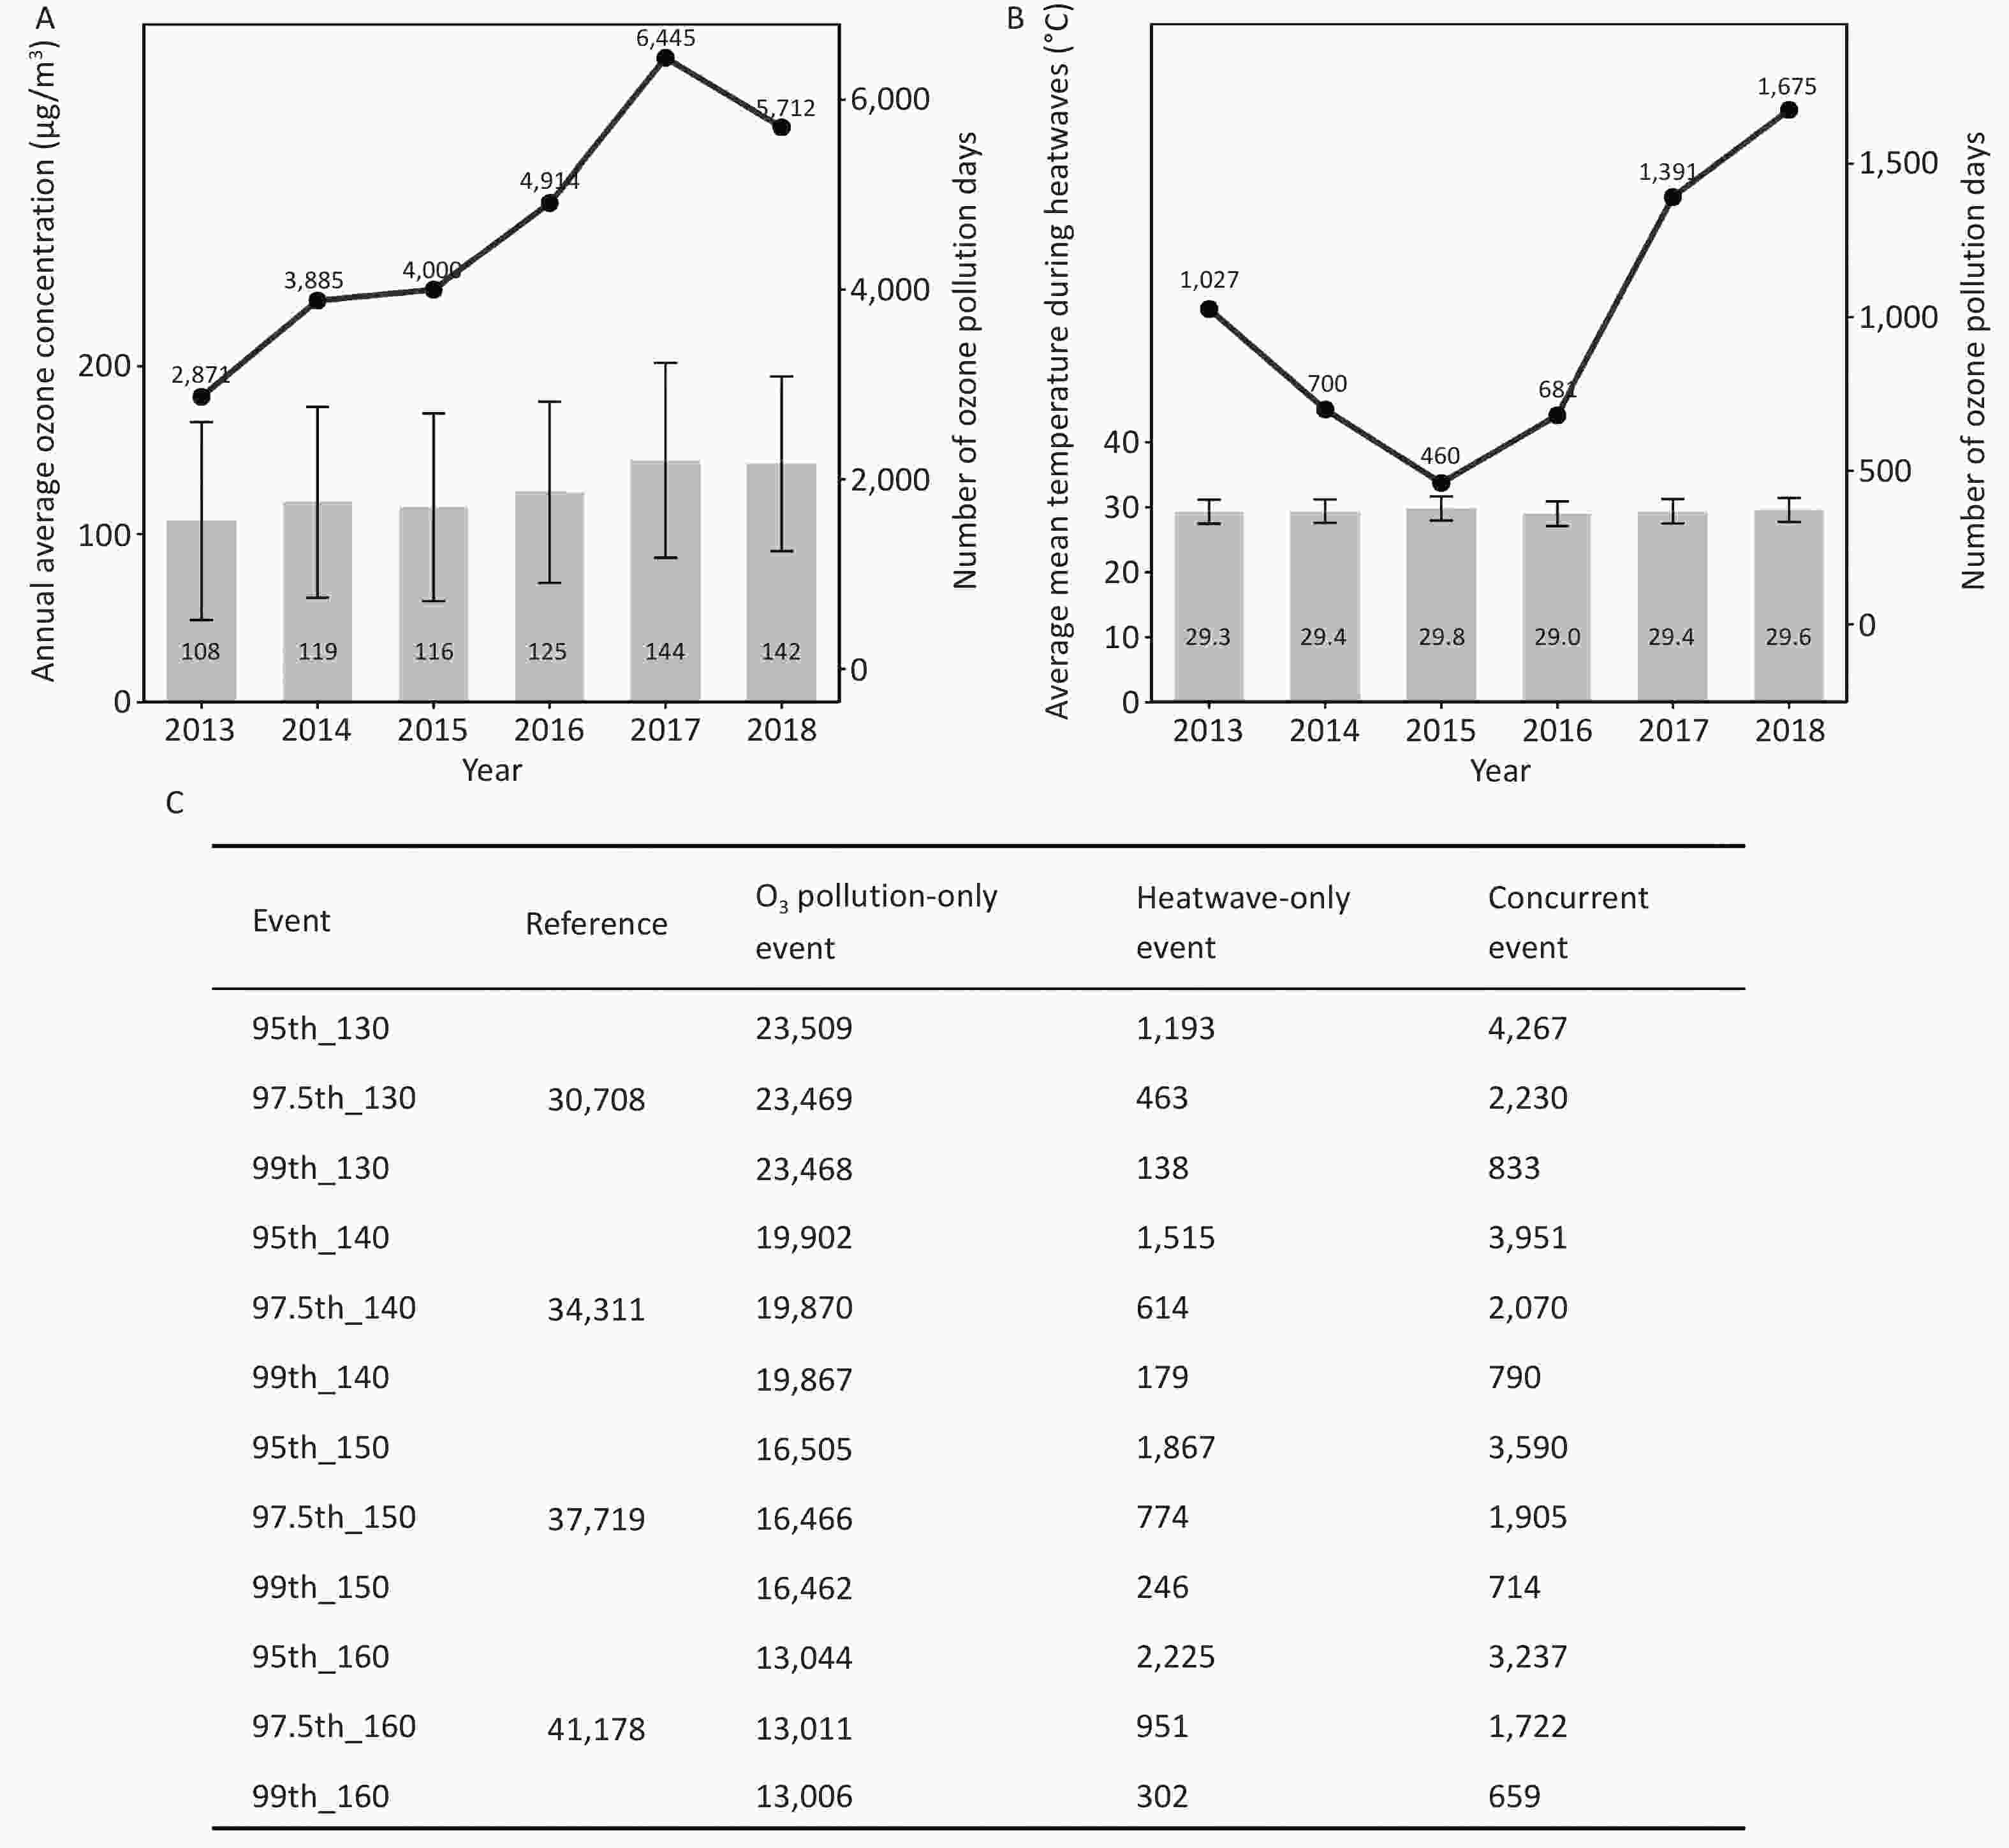
Figure 1. (A) Annual average O3 concentrations and the number of O3 pollution days, (B) average mean temperature during heatwaves and the number of heatwave days, and (C) number of days with events under different definitions. O3: ozone; O3 pollution days were defined as days with daily O3 concentrations ≥ 130 μg/m3 for at least two consecutive days. Heatwave days were defined as days with daily mean temperatures ≥ the 95th percentile for at least two consecutive days. The numbers of days presented in the figure represent the cumulative county-days, calculated as the sum of event days across all 59 included counties.
-
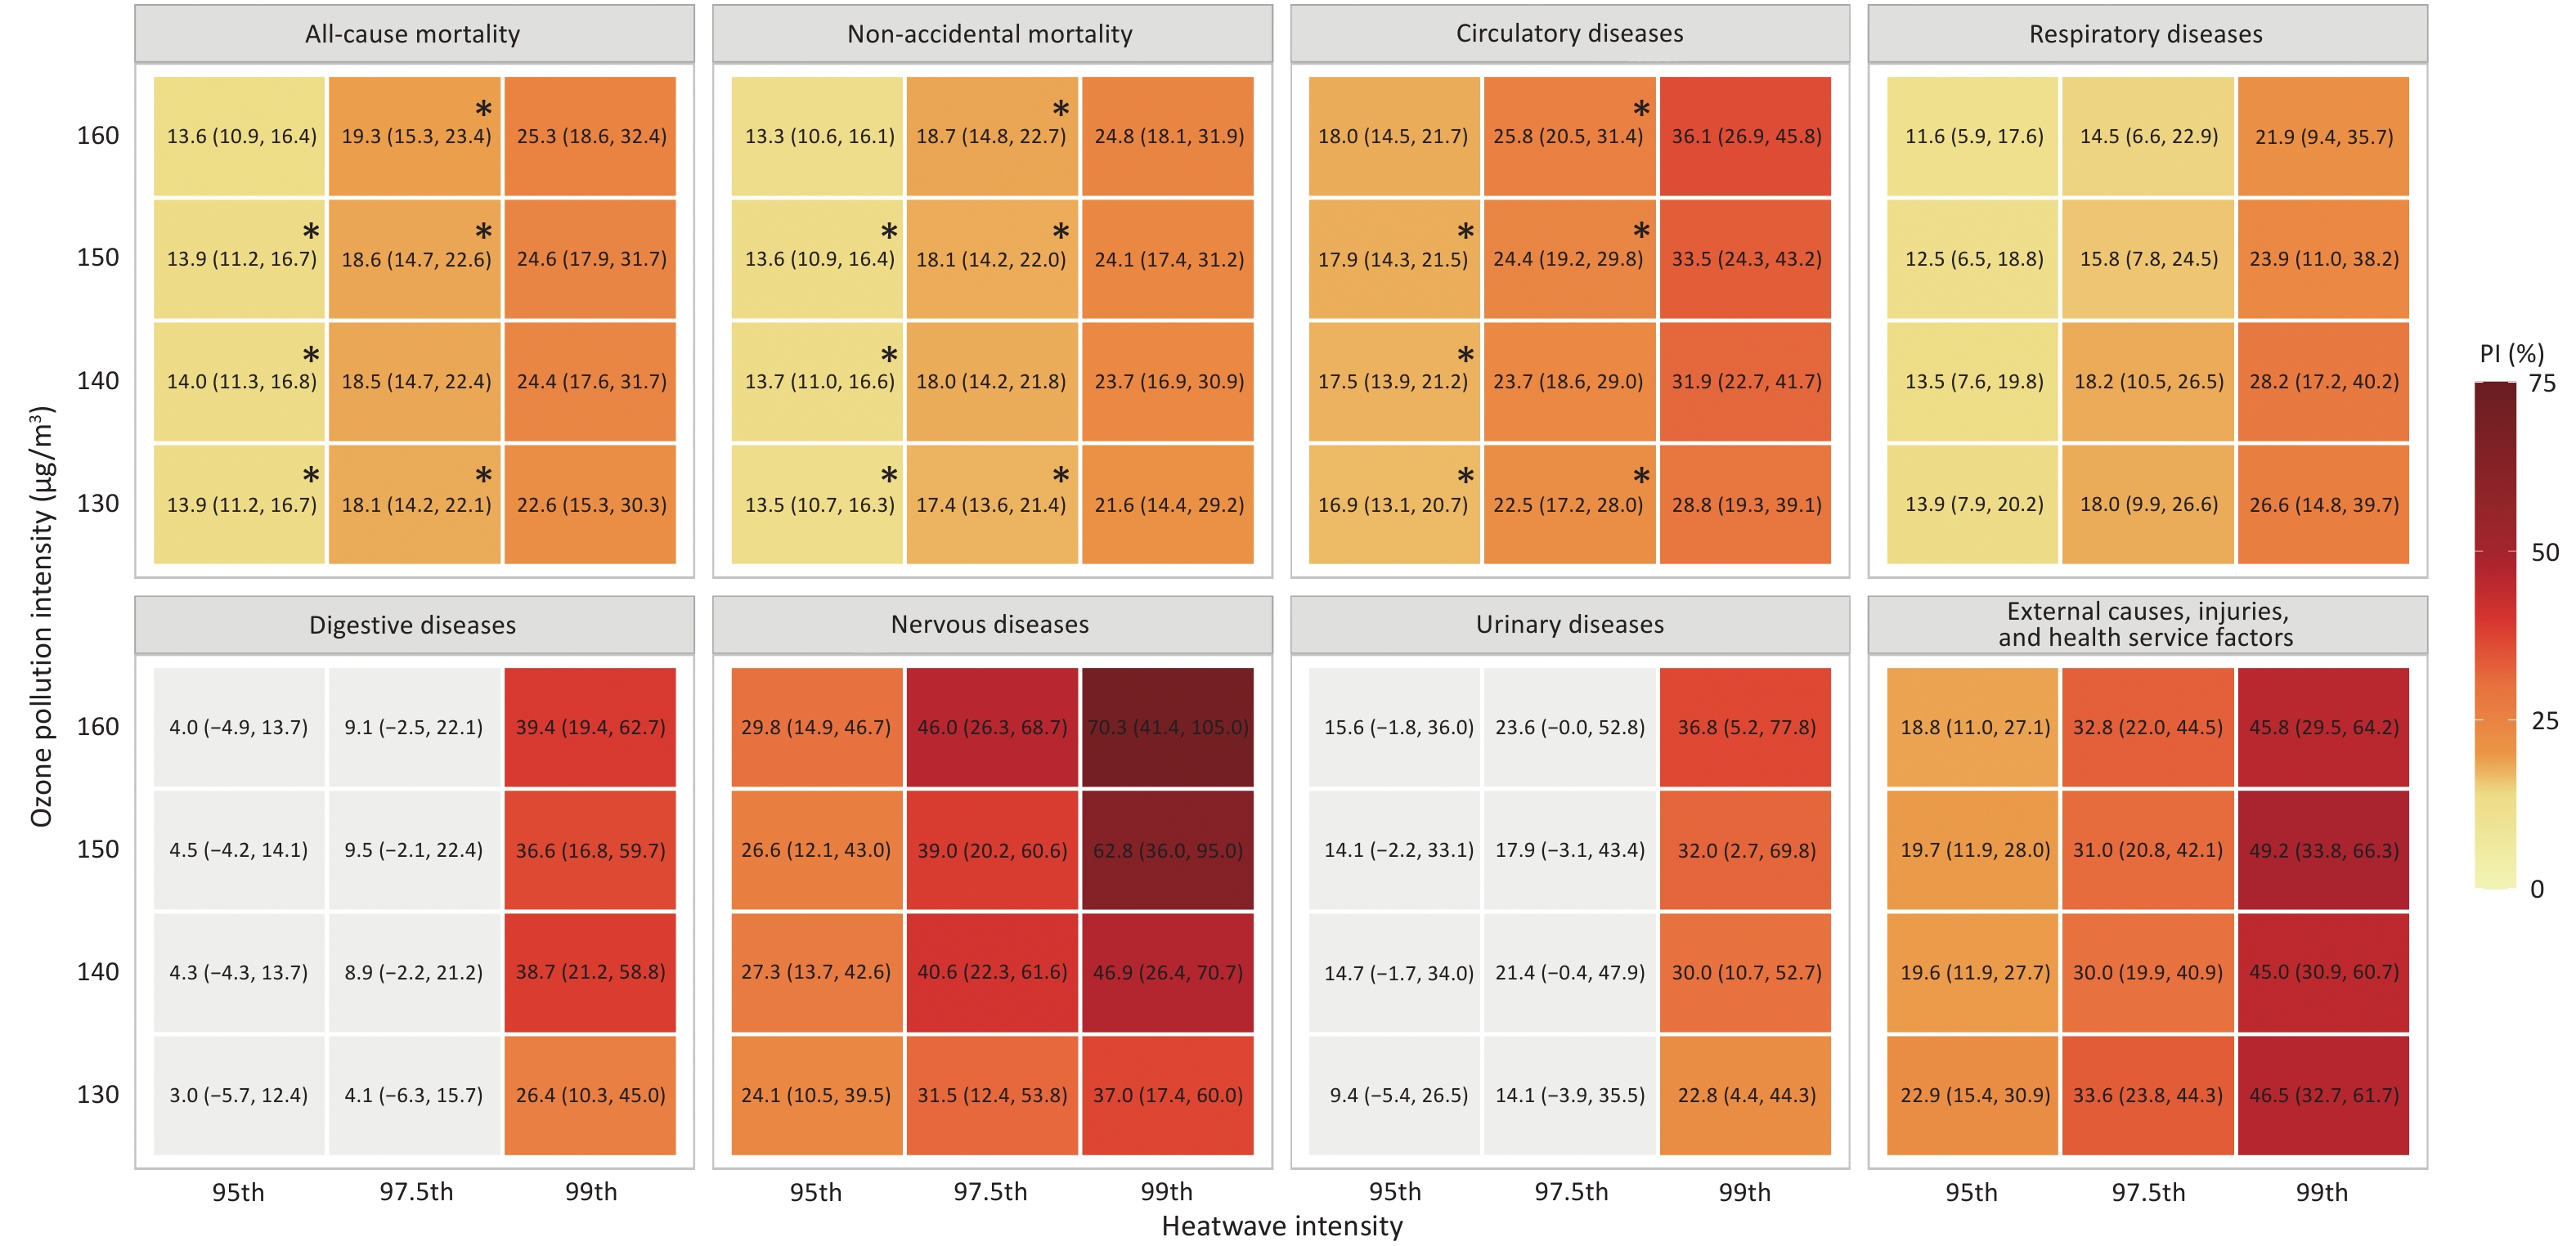
Statistically significant interactions between heatwaves and O3 pollution were observed when the high-O3 cutoff exceeded 130 μg/m3, and this trend remained marginally significant even after FDR correction (FDR-adjusted P = 0.052). However, no significant interaction was detected at lower O3 cutoffs (Supplementary Table S3). Therefore, subsequent analyses were conducted using O3 pollution definitions of ≥ 130 μg/m3. Figure 2 shows the variation in mortality risks and RERI across major disease categories under different heatwave and O3 pollution intensities.
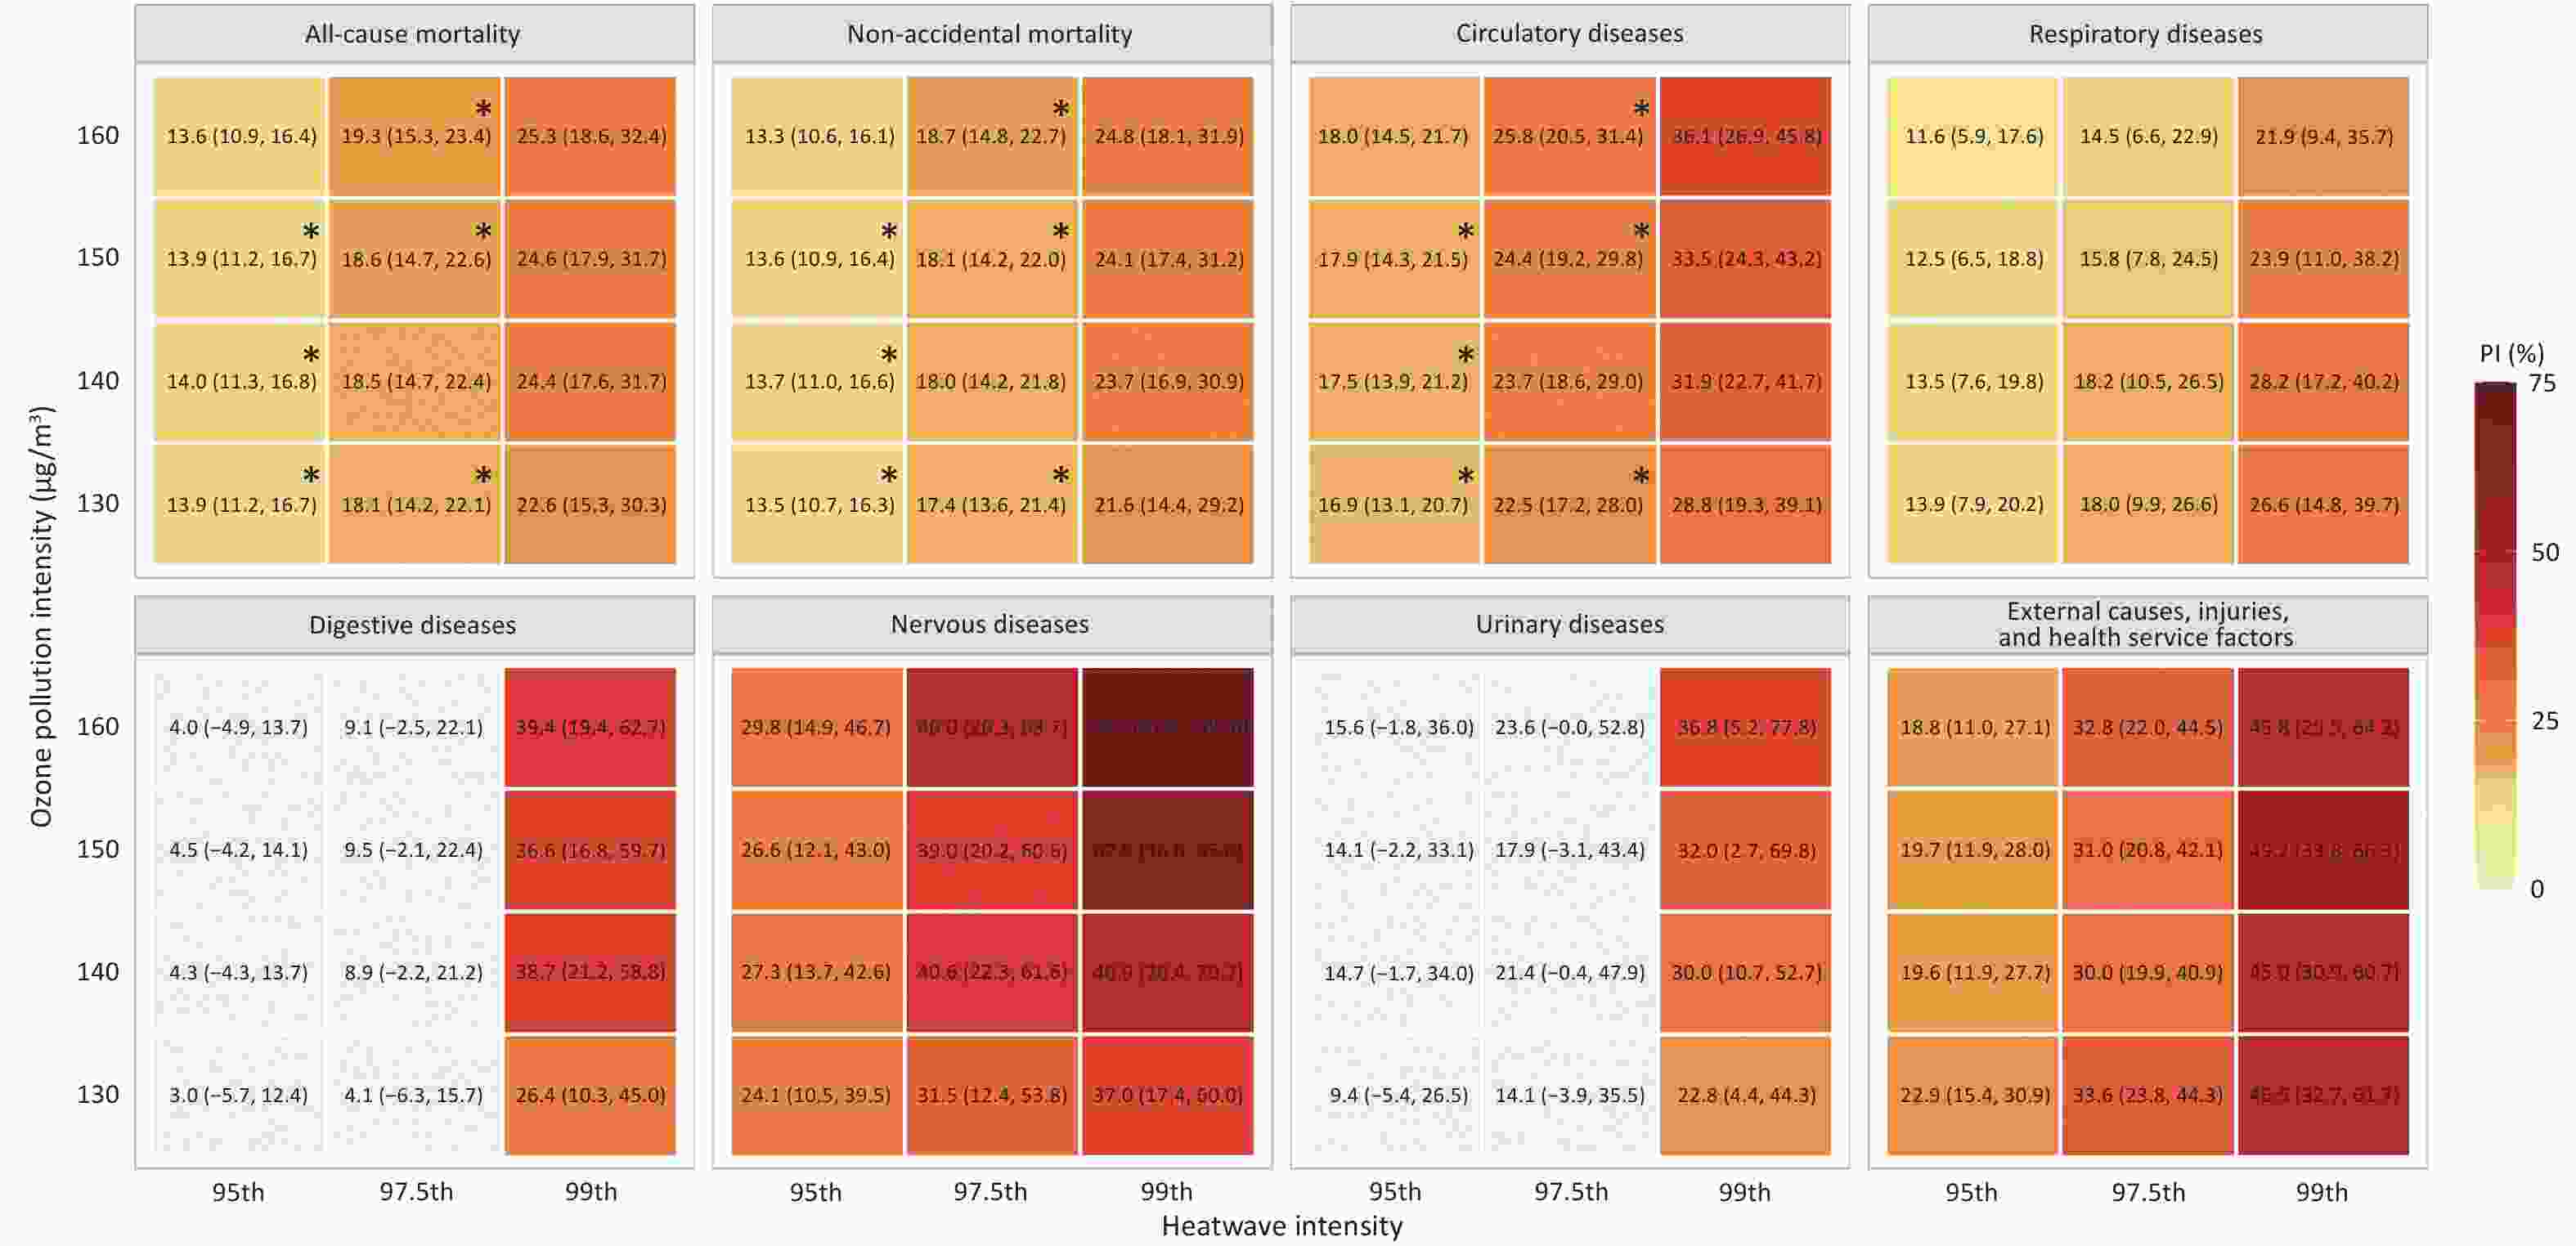
Figure 2. Percentage increase (95% CI) for concurrent events for major disease categories under different heatwave and O3 pollution intensities. Asterisks (*) indicate statistically significant RERI, showing that the joint effect of O3 and heatwaves on mortality was greater than the sum of their individual effects, suggesting an additive interaction. PI: percent increase; CI: confidence interval; RERI: relative excess risk due to interaction; O3: ozone.
Under the 95th_130 definition of Sce_HO, significant associations were observed across all six disease systems, with effect estimates strengthening progressively as heatwave intensity increased. Sce_HO was defined as co-occurring heatwaves (temperature ≥ the 95th percentile for ≥ 2 consecutive days) and elevated O3 (≥ 130 μg/m3 for ≥ 2 consecutive days). Notably, nervous system diseases demonstrated pronounced increases in effect estimates with rising O3 concentrations. Significant associations for digestive and urinary diseases were confined to Sce_HO defined at the 99th heatwave percentile. Under the most extreme definition (99th_160), mortality from nervous system diseases exhibited the largest increase, reaching 70.3% (95% CI: 41.4–105.0). Compared with exposure to Sce_O or Sce_H, Sce_HO produced greater effects on all-cause, non-accidental, circulatory, and respiratory system mortality (Supplementary Figure S2), with significant interactions for the first three disease categories (RERI > 0, AP > 0, and S > 1).
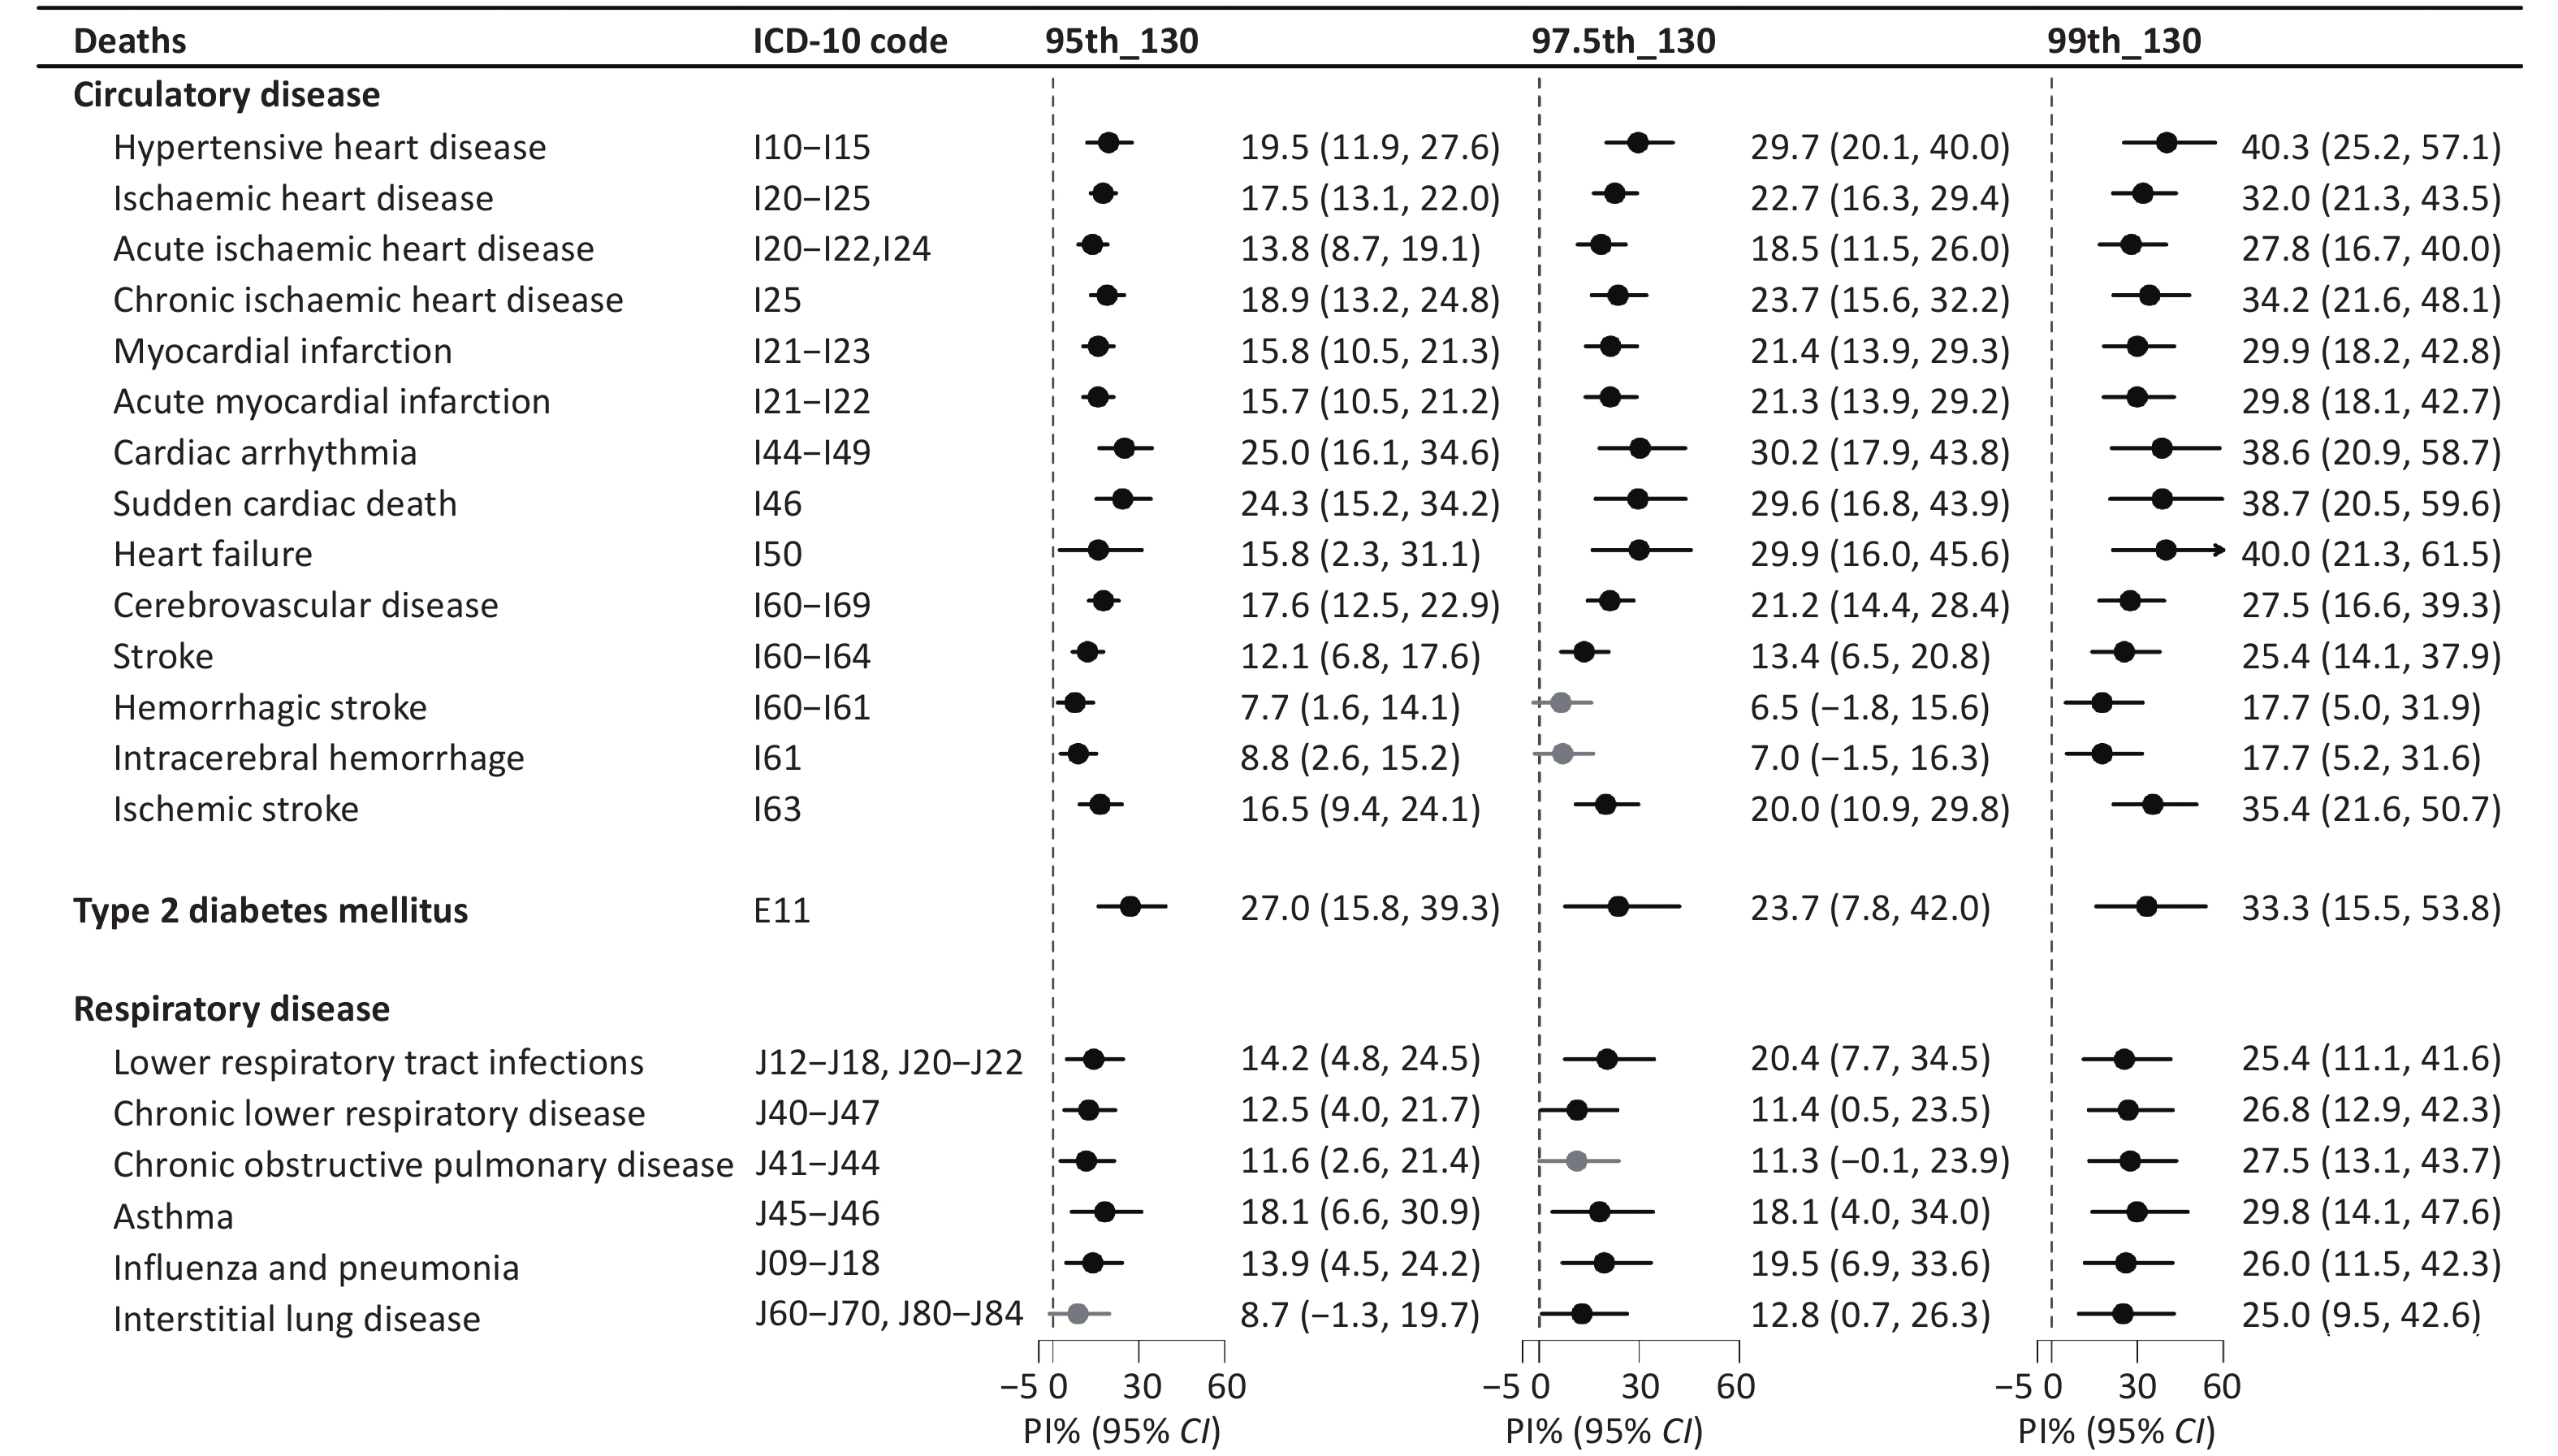
Figure 3 shows the percentage increases in cause-specific mortality under different definitions of Sce_HO. Significant associations were observed across all 21 subcategories. The effect estimates increased with higher heatwave intensity, yet showed little variation with increasing O3 intensity (Supplementary Figure S3). Among circulatory diseases, the largest effect was observed for hypertensive heart disease (PI = 40.3%, 95% CI: 25.2–57.1). Within respiratory diseases, asthma exhibited the highest risk (PI = 29.8%, 95% CI: 14.1–47.6). Type 2 diabetes mellitus showed a substantial excess risk of mortality as well (PI = 33.3%, 95% CI: 15.5–53.8). In cerebrovascular diseases, effect estimates for Sce_HO exceeded those for single-exposure events (RERI > 0, AP > 0, and S > 1; Supplementary Table S3). The effect estimates of other definitions and scenarios are provided in Supplementary Figures S3–S5.
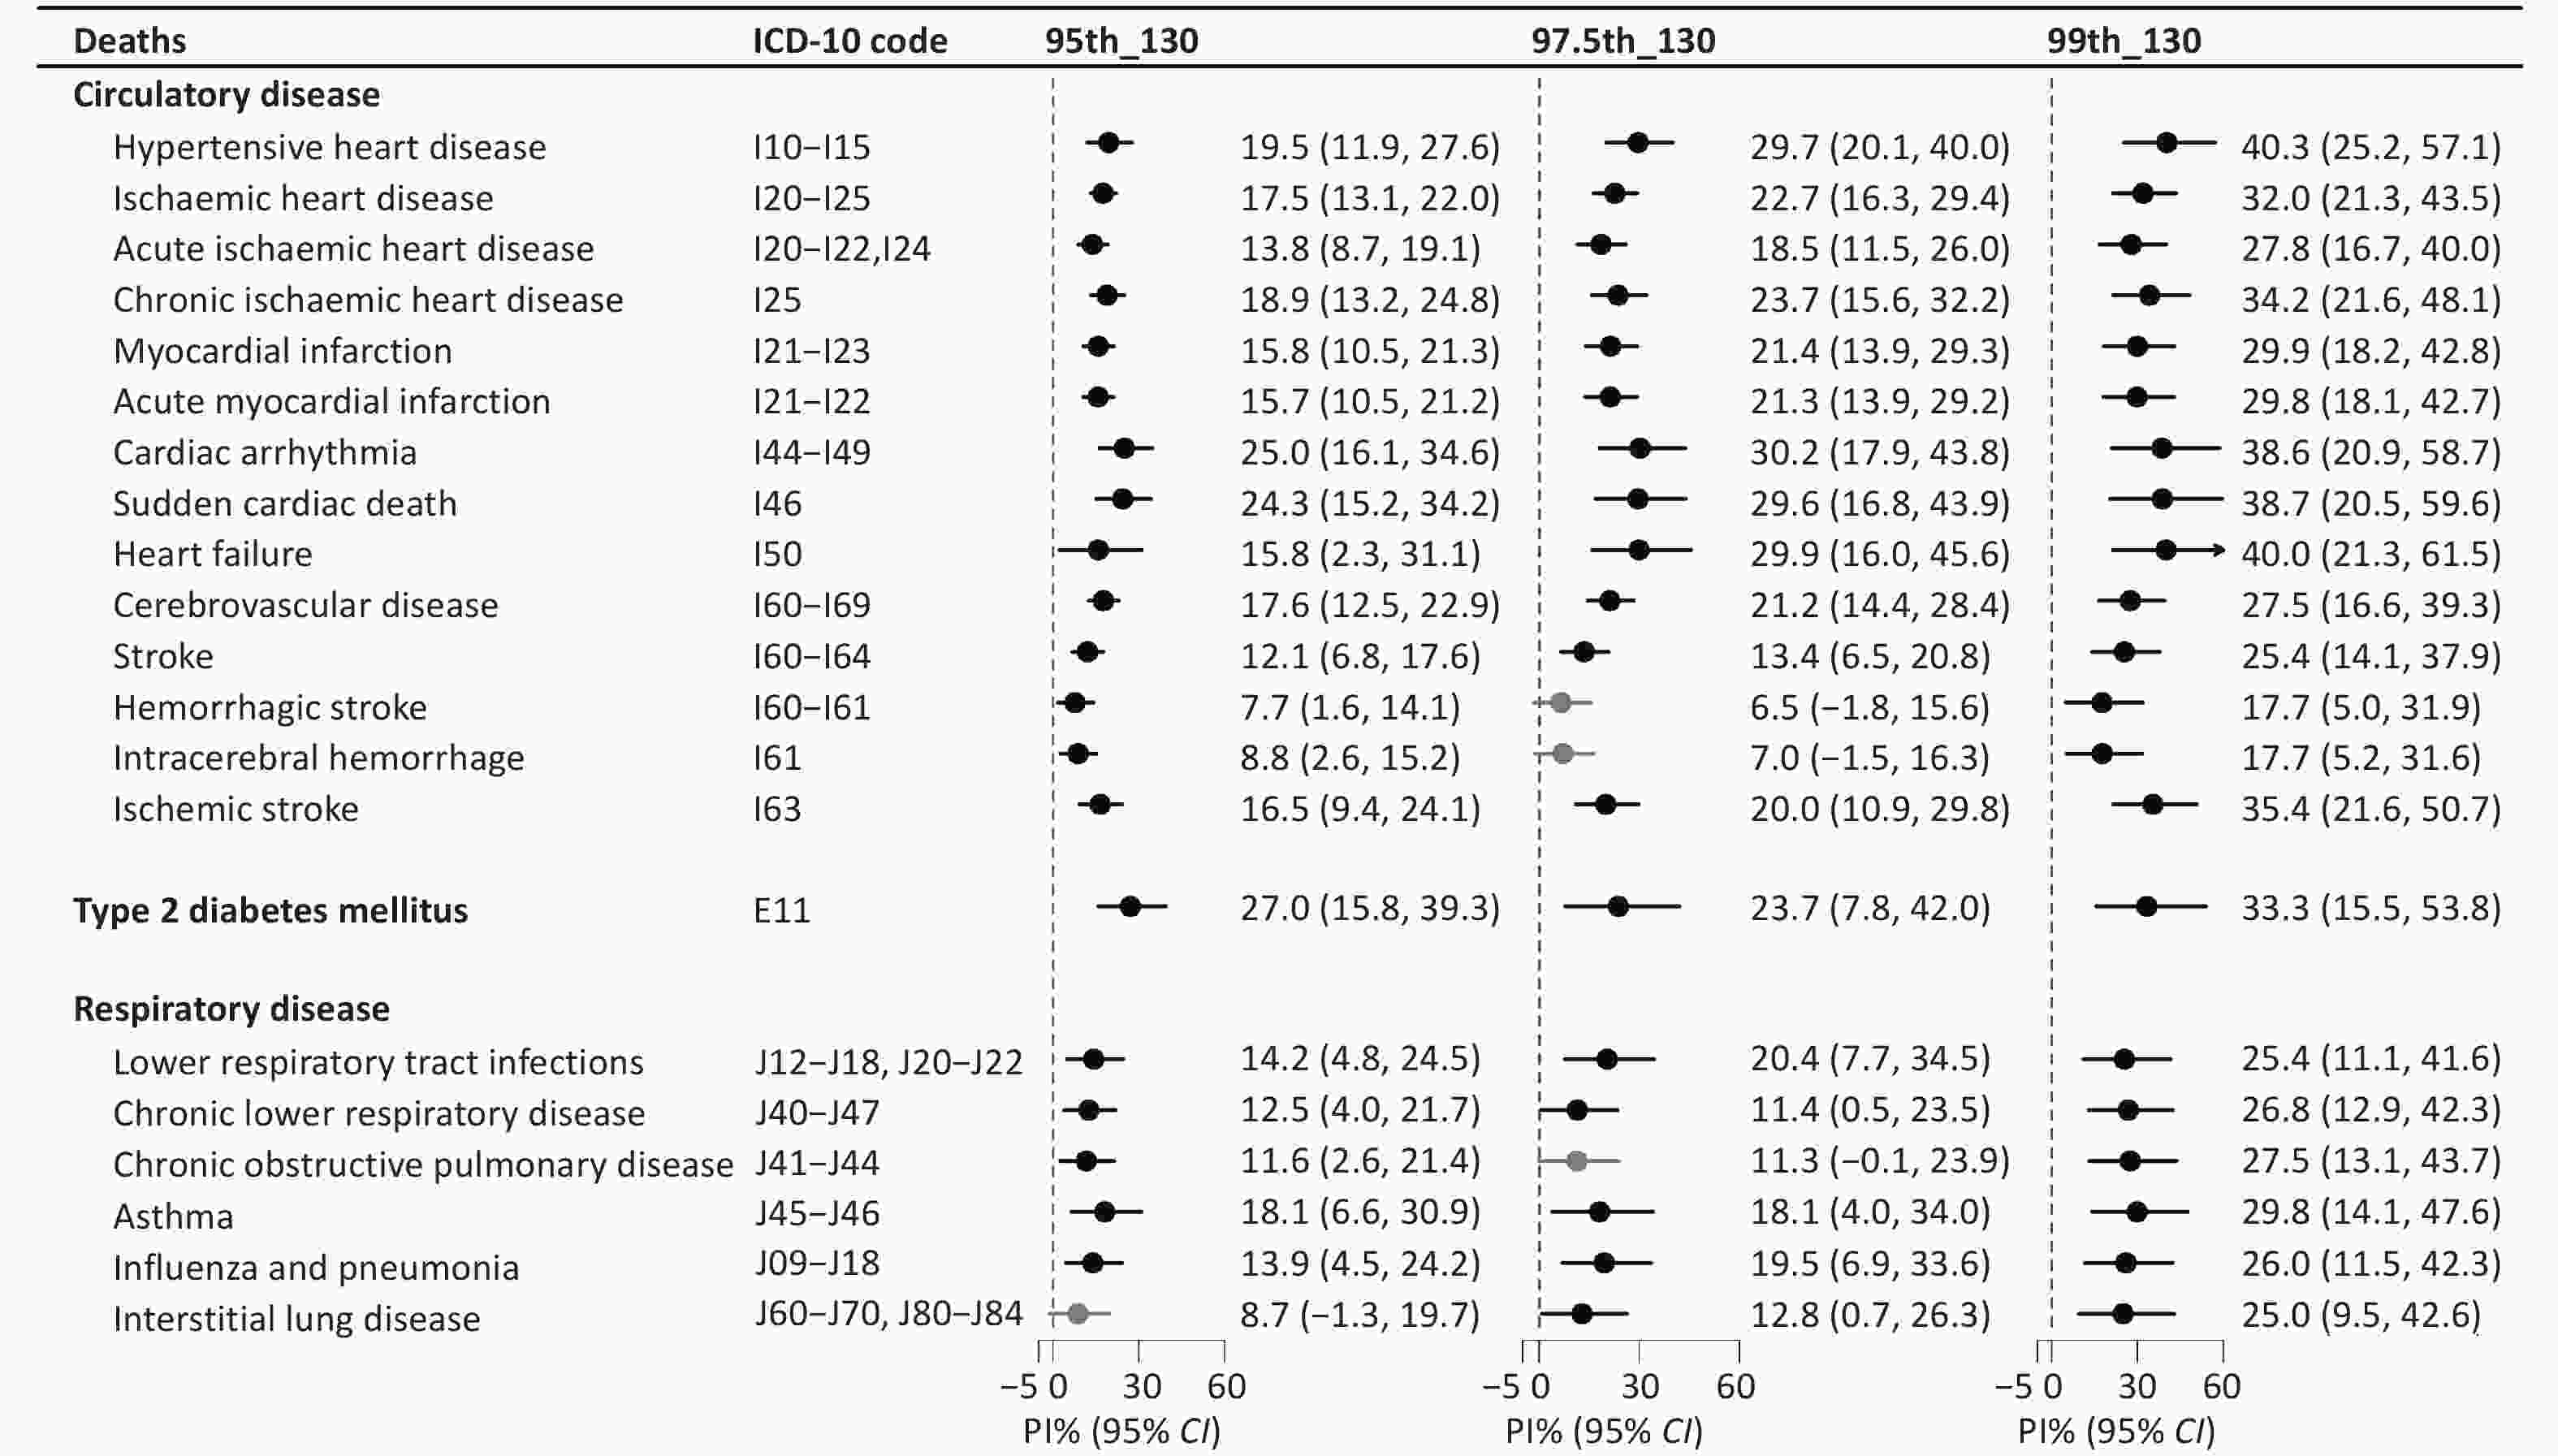
Figure 3. Percentage increases (95% CI) in cause-specific mortality associated with concurrent events under different heatwave definitions (with O3 fixed at 130 µg/m3 for ≥ 2 days). PI: percent increase; CI: confidence interval; O3: ozone.
-
Table S4 presents the percentage increase in mortality in different disease categories associated with the three scenarios, stratified by sex and age. For Sce_HO, the effects on mortality were more pronounced among females and older adults, with the largest effect observed for circulatory diseases in females (PI = 21.1%, 95% CI: 16.2–26.2). For high Sce_O, females were more sensitive, particularly to non-accidental mortality. No significant subgroup differences were identified for Sce_H or for other disease categories.
-
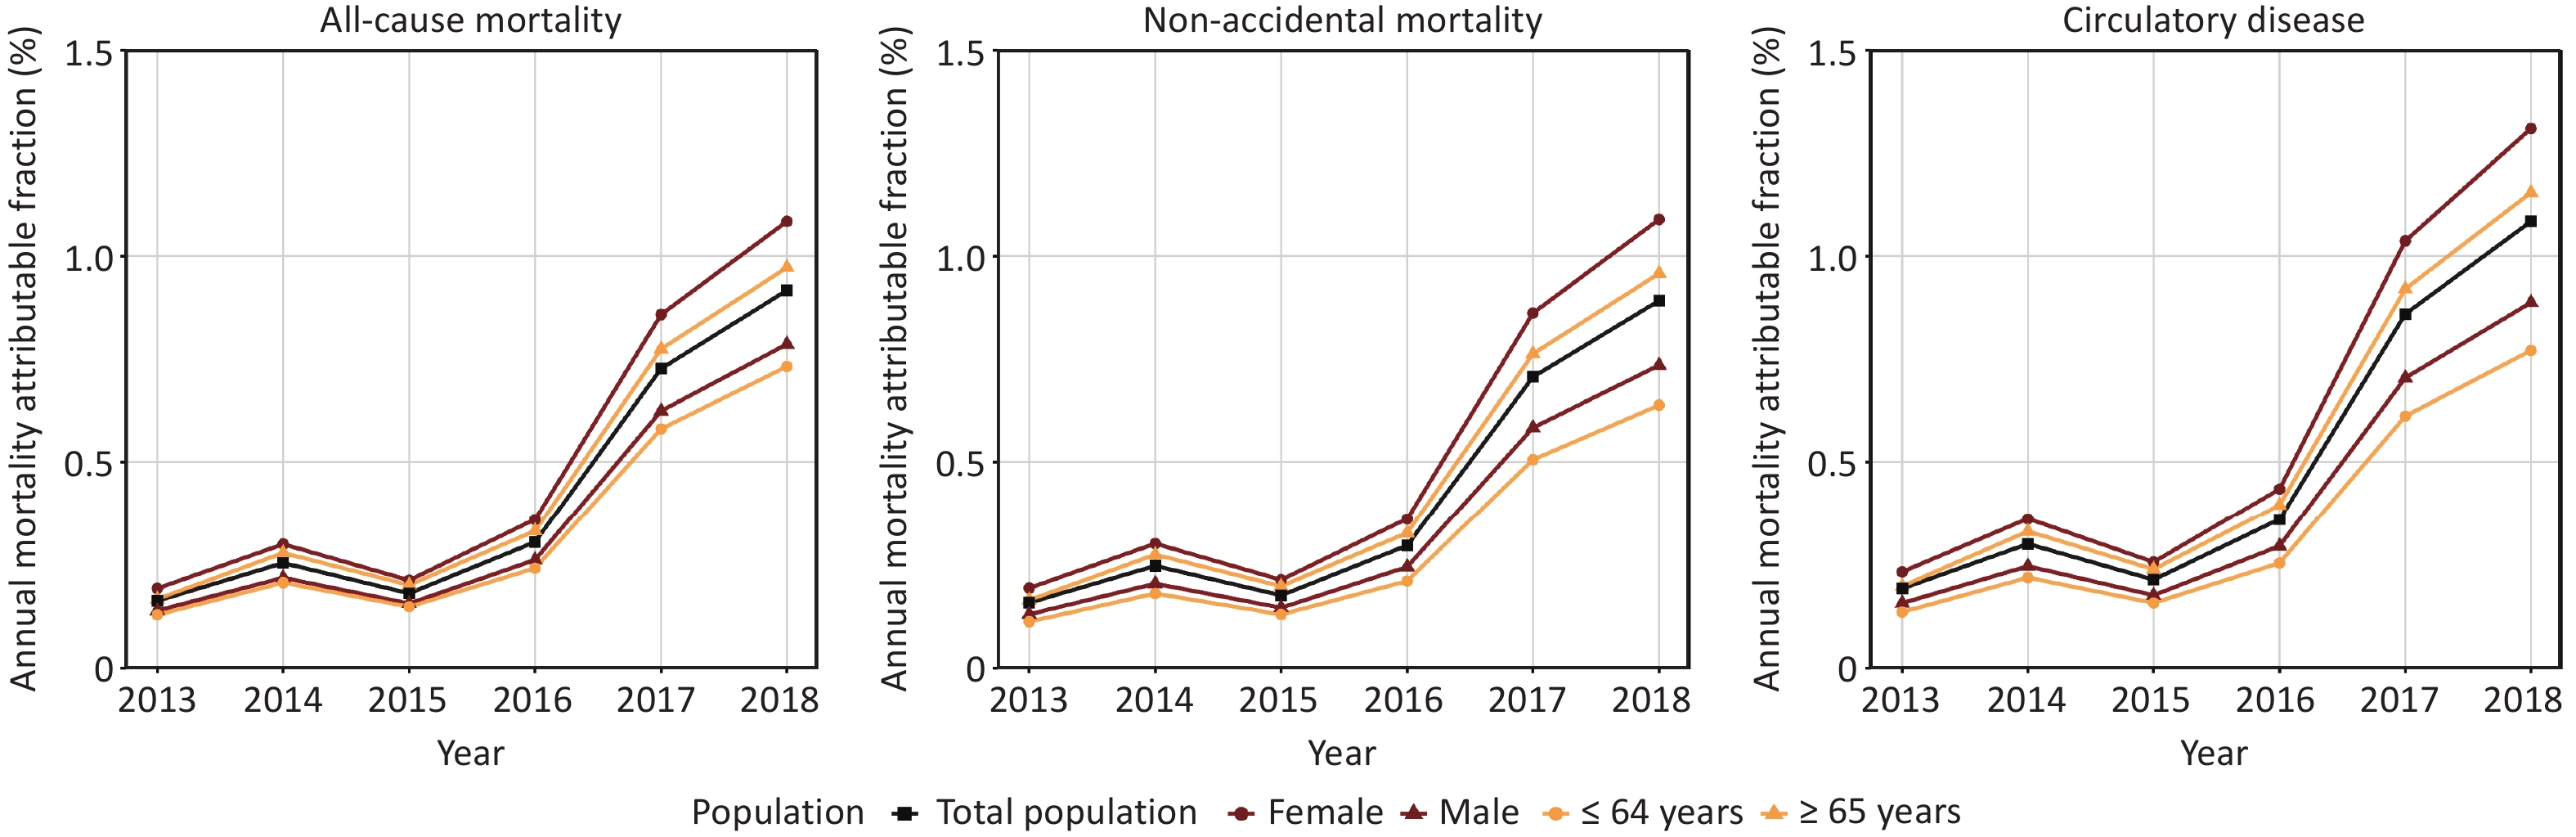
Statistically significant interactions between heatwaves and O3 pollution were observed for all-cause, non-accidental, and circulatory mortality; therefore, subsequent analyses of AF were restricted to these three causes. As shown in Figure 4, the AF of mortality associated with Sce_HO increased substantially from 2013 to 2018. Specifically, an absolute increase of 0.76% was observed for all-cause mortality, comparable to those for non-accidental mortality (0.73%) and circulatory mortality (0.89%) over the same period. The absolute increase was greater among females (0.89%) than among males (0.65%) and among older adults (0.81%) than among those aged 0–64 years (0.60%). The relative increase in the attributable fraction was 467.1% for all-cause mortality. The largest relative increase was observed among older adults with circulatory diseases (485.9%). The Theil-Sen median slope estimator indicated that the annual absolute increase in AF for all-cause mortality was 0.15% per year. A larger annual increase was observed for circulatory mortality, particularly among females (0.22% per year) and older adults (0.19% per year), compared with males (0.15% per year) and those aged 0–64 years (0.13% per year) (Table 1).
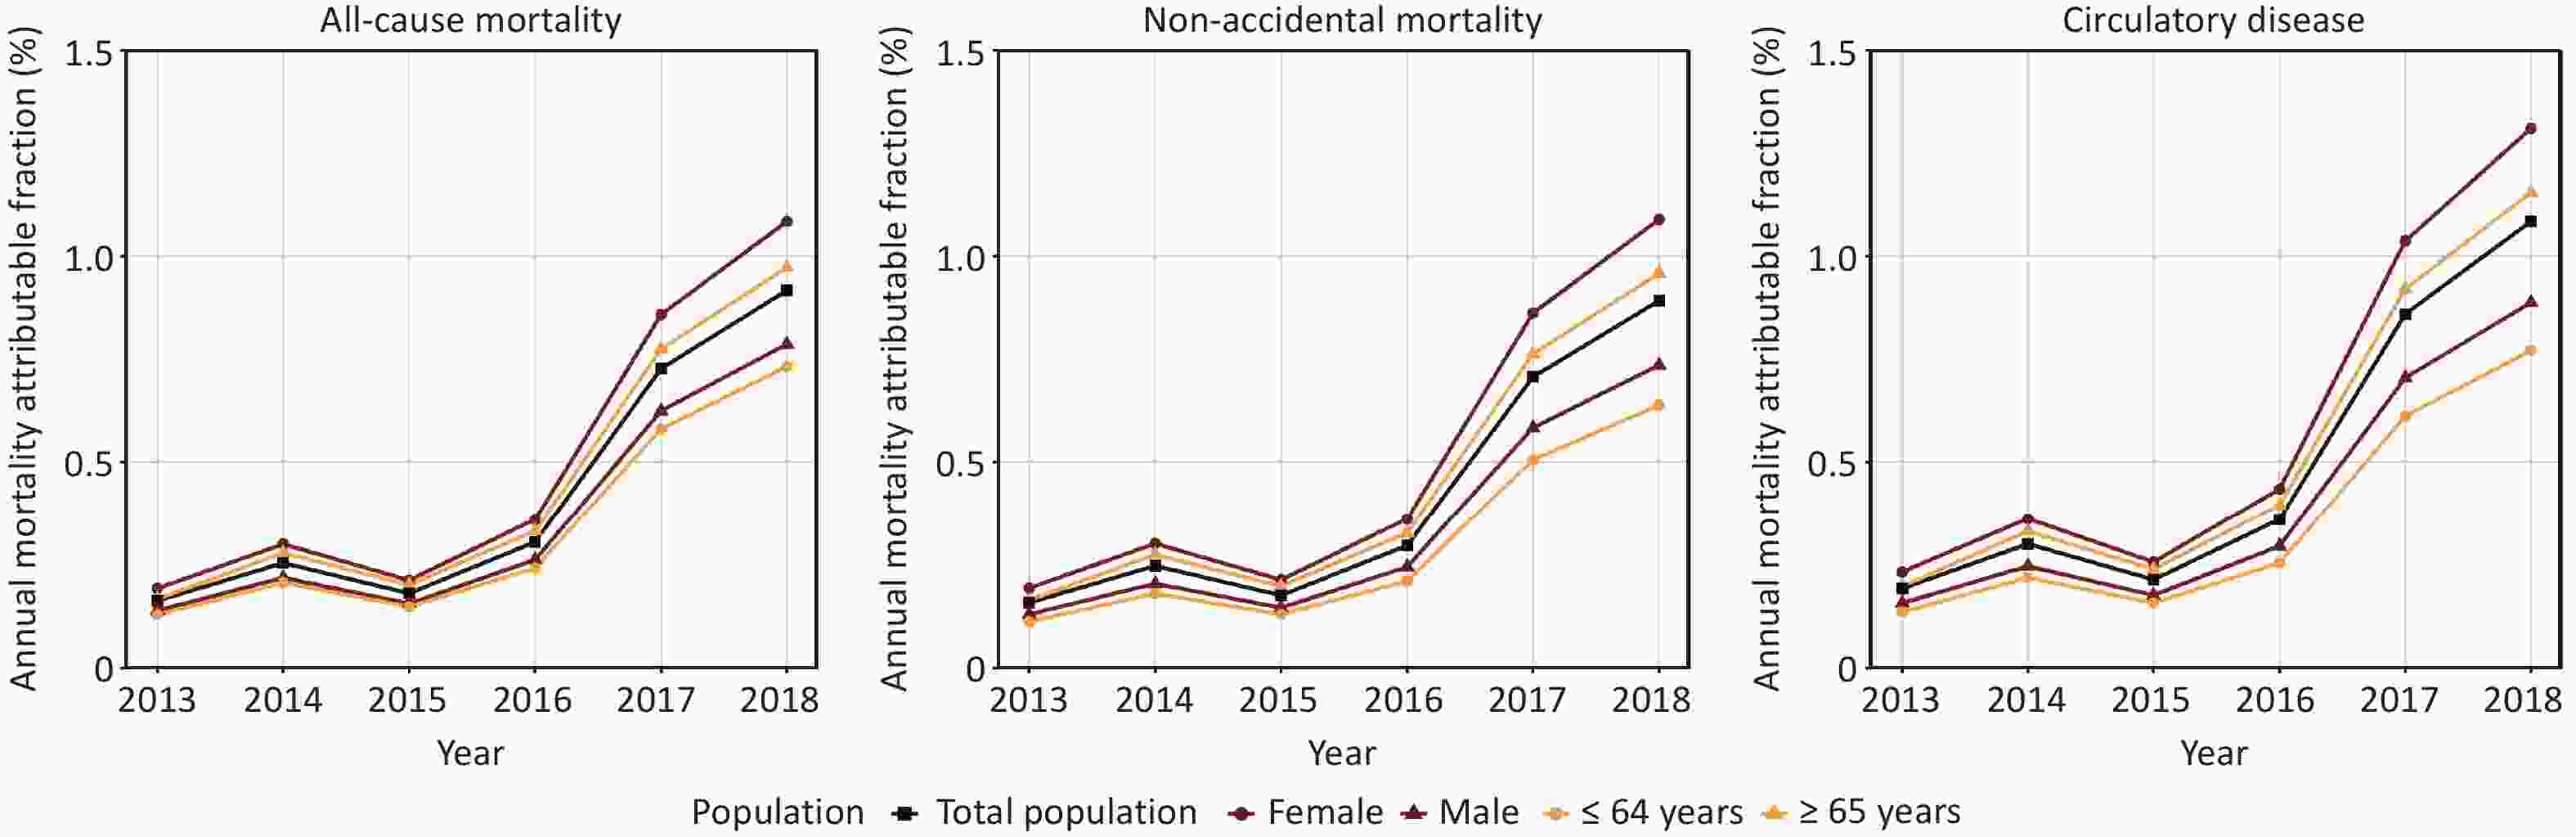
Figure 4. AFs of all-cause, non-accidental, and circulatory mortality associated with concurrent events (lag01) among different population subgroups under the 95th_130 definition in the BTH, 2013–2018. Results for other diseases were not presented because the interaction between heatwaves and O3 pollution was not statistically significant. BTH: Beijing-Tianjin-Hebei and surrounding areas; O3: ozone.
Population All-cause mortality Non-accidental mortality Circulatory disease Absolute increase (%) Relative increase (%) Annual absolute increase
(% per year)Absolute increase (%) Relative increase (%) Annual absolute increase
(% per year)Absolute increase (%) Relative increase (%) Annual absolute increase
(% per year)Total 0.76 (0.62, 0.89) 467.1 0.15 † 0.73 (0.60, 0.87) 467.1 0.15 † 0.89 (0.72, 1.06) 467.1 0.18 † Sex Female 0.89 (0.72, 1.06) 465.6 0.18 † 0.90 (0.72, 1.06) 465.6 0.18 † 1.08 (0.86, 1.29) 465.6 0.22 † Male 0.65 (0.50, 0.79) 468.5 0.13 † 0.61 (0.45, 0.75) 468.5 0.12 † 0.73 (0.53, 0.93) 468.5 0.15 † Age (in years) 0–64 0.60 (0.43, 0.77) 471.1 0.12 † 0.53 (0.35, 0.70) 471.7 0.11 † 0.64 (0.36, 0.90) 472.5 0.13 † ≥ 65 0.81 (0.66, 0.95) 485.8 0.16 † 0.79 (0.64, 0.94) 485.8 0.16 † 0.96 (0.77, 1.14) 485.9 0.19 † Note.a Results for other diseases were not presented because the interaction between heatwaves and O3 pollution was not statistically significant. Estimates with P < 0.05 (two-sided) are marked with a dagger (†); BTH: Beijing-Tianjin-Hebei and surrounding areas. Table 1. Increases in attributable fractions of all-cause, non-accidental, and circulatory mortality associated with concurrent events (lag01) among different population subgroups under the 95th_130 definition in the BTH, comparing 2018 with 2013ᵃ.
From 2013 to 2018, the AN of deaths due to Sce_HO was estimated to be 29,730 (95% CI: 24,451–34,882). Non-accidental causes accounted for 91.5% of these deaths, corresponding to an of 27,209 (95% CI: 22,136–32,157), among which circulatory diseases contributed 52.8% (15,694, 95% CI: 12,629–18,662) (Supplementary Table S5). Females (15,396) and older adults (22,284) represented the major contributors to the AN (Table S5). The AN associated with all extreme events was 59,752, compared with 4,089 for Sce_H and 26,933 for Sce_O (Supplementary Table S5).
-
Models with different degrees of freedom for relative humidity or long-term time trends did not meaningfully change this study’s estimates, which remained robust (Supplementary Table S6). Furthermore, controlling for interannual variations by including “year” as a categorical variable yielded estimates highly consistent with the main model, confirming adequate capture of long-term trends. Similarly, substituting the O3 metric with the 24-hour average concentration produced comparable estimates. When PM2.5 was excluded from the model, the effect estimates remained close to those of the main model, further confirming the robustness of the findings (Supplementary Table S6). All the results of the sensitivity analyses are presented in the Supplementary Materials.
-
Leveraging a large-scale population dataset in a highly climate-sensitive region characterized by increasing O3 concentrations, this analysis provided robust evidence regarding the acute mortality effects of concurrent heatwave–O3 exposure. It found that concurrent exposure significantly increased premature mortality risks across multiple physiological systems, including circulatory, respiratory, and nervous system diseases, and type 2 diabetes mellitus. When O3 levels exceeded 130 μg/m3 for at least two days during heatwaves, significant interactions were triggered that markedly intensified health risks, particularly for circulatory diseases. Nervous system mortality was uniquely sensitive to O3 variations under concurrent exposure, exhibiting a distinct upward trend as concentrations increased. Women, older adults, and individuals with circulatory diseases were identified as groups with heightened risks. The estimates indicated that the disease burden increased annually from 2013 to 2018, with 29,730 deaths attributable to Sce_HO and an annual absolute increase in the AF of 0.15% per year.
The study found that medium-to-high O3 concentrations (approximately 130–160 μg/m3) were associated with a substantial amplification of the mortality effects of heatwaves. There has been consistent evidence that O3 levels of approximately 160 μg/m3 are sufficient to intensify the health impacts of heatwaves, with relative risks being reported in the range of 1.16–1.45[13,14]. However, evidence at lower O3 thresholds has been less consistent. Xu et al. reported significant O3–heatwave interactions in Jiangsu Province when O3 exceeded 100 μg/m3[14], whereas Wang et al. observed no such interaction in Hong Kong at comparable concentrations[15]. This study found that heatwave-related mortality effects were noticeably amplified when O3 concentrations exceeded approximately 130 μg/m3. This threshold was comparable to that reported by Schwarz et al., which identified an effect of O3 at around 61.67 ppb on respiratory disease hospitalizations at the ZIP-code level[28]. This study further observed that O3 levels of approximately 130 μg/m3 could amplify heatwave-related mortality risks to levels similar to those at 160 μg/m3 and, in some cases, surpass the impacts associated with intense heatwave events. These discrepancies were likely driven by a comparatively lower physiological heat tolerance within the BTH when contrasted with subtropical areas, such as Hong Kong [29], coupled with the area’s notably higher baseline O3 concentrations[30]. These heterogeneous findings were further compounded by methodological differences in event definitions and model specifications,[31] alongside demographic variations, particularly the rapidly aging population within the BTH[32]. Future efforts should focus on elucidating the health impacts of medium-to-high O3 concentrations and strengthening O3 control during extreme heat events. This could facilitate the development of an integrated early-warning framework for concurrent heatwave–O3 exposure.
Circulatory diseases, particularly cerebrovascular diseases, were more sensitive to heatwave exposure than to O3 exposure and were the most severely affected by Sce_HO. Sce_H was strongly associated with higher relative risks (RR range: 1.14–1.65) for cardiovascular mortality, whereas the corresponding risk estimates for Sce_O were relatively lower (RR range: 1.01–1.08)[13,33]. An additive interaction between heatwaves and O3 exposure was present in the circulatory system. Xu et al. reported a statistically significant additive effect on cardiovascular mortality (RERI = 0.27, 95% CI: 0.23–0.31), consistent with these findings[33]. In contrast, Du et al. (2024) identified an even stronger association (RERI = 1.05, 95% CI: 0.99–1.11)[13]. Cerebrovascular diseases were highly sensitive to concurrent exposure[34]. Mechanistically, this concurrent exposure aggravated cerebrovascular injury by inducing systemic inflammation (e.g., elevated IL-1β and CRP) and impairing coagulation function (e.g., excessive PAI-1 expression), which promoted thrombus formation[35,36]. Overall, the findings indicated that O3 exposure during heatwaves significantly increased circulatory mortality risk, highlighting the need for targeted preventive measures for individuals with cardiovascular diseases.
Nervous system diseases were particularly susceptible to O3 during Sce_HO. As O3 concentrations increased, the joint effects on nervous system diseases exhibited a progressively steeper increase. Previous studies demonstrated that heatwaves and O3 exposure independently contributed to increased risks of nervous system diseases[18,37,38]. Moreover, among all major disease systems, the largest ozone-related effect estimates were observed for these diseases[18]. In terms of biological mechanisms, experimental evidence suggested that O3 induced neuroinflammation, disrupted the blood–brain barrier, and promoted neuronal apoptosis, while heat stress potentiated these effects, leading to cognitive impairment[39]. However, the joint effects on respiratory mortality did not continue to increase with rising O3 concentrations, likely because the concentration–response curve for ozone-related respiratory mortality was nonlinear, characterized by a steeper increase at moderate-to-high concentrations followed by a plateau at higher levels[40]. This suggested that during Sce_HO, O3 served as a modifying factor whose influence varied across disease systems. Its effects on the nervous system, as a particularly sensitive target, warrant special attention.
Older adults and women experienced a higher health burden, especially as the frequency of Sce_HO increased steadily from 2013 to 2018. The elevated risk among older adults was consistently reported in previous studies, demonstrating greater mortality during concurrent exposure relative to younger individuals[13,31,34]. However, evidence on sex-specific susceptibility has been inconsistent, with some studies indicating higher risks among men [13,34], while others observed greater Sce_HO-related risks in women, consistent with this study’s findings[41,42]. The increased biological susceptibility among older adults resulted from impaired thermoregulation and diminished antioxidant defenses[23,43]. Similarly, women may be more affected because of greater airway reactivity and higher expression of inflammatory mediators[44]. As the climate continues to warm, the annual increase in Sce_HO exacerbates the health risks faced by these population groups. Multiple projections indicate that Sce_HO will continue to increase in the coming decades. Specifically, Sce_HO days in Europe are estimated to increase by approximately 2.6 days per decade. In China, they are expected to increase by approximately 208% by 2060. Globally, days with Sce_HO exposure in the 2080s are projected to be roughly 13.2 times more frequent than during the baseline period[45–47]. These trends suggest that developing targeted early-warning and intervention strategies for women and older adults is essential for reducing health inequities in the context of aging and climate change.
This study has several limitations. Similar to most time-series studies, it is subject to potential exposure misclassification because fixed-site monitoring data were used to approximate population-level exposure[48]. To partially minimize measurement error, analyses were restricted to county-level residents living in counties with monitoring stations or within 10 km of a station. AF calculations relied on pooled relative risks and uniform national average mortality rates because of the lack of daily county-specific data. This uniform application fails to capture local heterogeneity in mortality patterns and healthcare access, introducing bias into the regional burden estimates[49]. This fine-scale regional analysis, conducted in an area characterized by a relatively homogeneous climate and consistently high O3 levels, offers representative evidence for similar environmental settings. Consequently, further multi-regional investigations are warranted to elucidate geographic heterogeneity and compare differences across diverse climatic zones. This study was limited to 2013–2018 to avoid severe confounding biases introduced by the COVID-19 pandemic. The identification of the 130 μg/m3 threshold was partially data-driven. As an exploratory association study, the findings provide a foundation for future prospective cohorts and animal experiments to validate these thresholds and underlying mechanisms.
-
Irreversible global warming is escalating concurrent heatwave–O3 exposures. Therefore, a comprehensive understanding of their health impacts and underlying interaction patterns will be crucial in the coming decades. This study demonstrated that concurrent exposure exerted significant adverse effects across multiple physiological systems, including circulatory, respiratory, and nervous system diseases, and type 2 diabetes mellitus. Medium-to-high O3 concentrations (≥ 130 μg/m3) significantly amplified the adverse health effects of heatwaves. Furthermore, women, older adults, and individuals with circulatory diseases were identified as particularly vulnerable groups. Notably, these concurrent events contributed to a substantial and annually increasing attributable mortality burden from 2013 to 2018. These findings provide crucial empirical evidence to develop an integrated smart early-warning framework, establish feasible protocols for alert grading, and offer valuable guidance for designing targeted interventions to protect vulnerable populations.
HTML
Study Design and Area
Data Collection
Mortality Data
Environmental Data
Demographic Data
Statistical Analysis
Definition of Concurrent Events
Estimation of Mortality Risk from Extreme Events
Estimation of Attributable Number and Fractions
Descriptive Statistics
Mortality Risk of Sce_HO
Stratified Analysis
AN and AF of Sce_HO
Sensitivity Analyses
Competing Interests The authors declare that they have no known competing financial interests or personal relationships that could have influenced the work reported in this paper.
Ethics Ethical review was waived for this study as it exclusively relied on retrospective, de-identified, and aggregated mortality data and did not involve human subjects or personally identifiable information.
Authors’ Contributions Conceptualization: Jianan Li, Chen Chen, and Xiaoming Shi; Methodology: Yiqi Qiu and Chenfeng Li; Formal analysis: Jianan Li; Validation: Jianlong Fang and Chen Chen; Data curation: Jianlong Fang, Yueqiao Zhou, and Jiaonan Wang; Visualization: Jianan Li and Chenfeng Li; Supervision: Chen, Chen Mao, and Xiaoming Shi; Writing – original draft: Jianan Li; Writing – review & editing: Jianan Li, Yiqi Qiu, Mike Z. He, Yu Wang, Chen, and Chen Mao. All authors have read and agreed to the published version of the manuscript.

 Quick Links
 DownLoad: