
-
As global aging accelerates, the proportion of individuals aged 65 years and older is steadily increasing. According to the China Statistical Yearbook 2024[1], 216.76 million individuals were aged 65 years or older by the end of 2023, representing 15.4% of the population. Shanghai, a city with a high life expectancy, is struggling with population aging. By the end of 2023, it had a population of 4.38 million people aged 65 or over, accounting for 28.9% of the total registered permanent residents of the city[2], which is much higher than the standard of China's aging cities. A gradual decline in muscle mass and quantity occurs with increasing age. Sarcopenia, a progressive skeletal muscle disorder closely associated with aging, has accordingly become increasingly prevalent[3]. This deterioration increases the risk of adverse events such as falls, frailty, functional limitations, and even mortality. Notably, a recent prospective cohort study across different cultural contexts found that the combination of sarcopenia and social isolation synergistically elevated the all-cause mortality risk among older Chinese adults[4]. This rising incidence, combined with population aging, not only increases health risks for older adults, but also imposes a substantial socioeconomic burden on healthcare systems and societies worldwide. A recent meta-analysis of nine studies encompassing 7,656 participants aged 50 years and older from community settings identified an overall sarcopenia prevalence of 14%[5]. Furthermore, data from the China Health and Retirement Longitudinal Study (CHARLS) revealed a substantial increase in the prevalence of sarcopenia among the Chinese population, from 8.5% in 2015 to 29.6% in 2018[6]. This marked increase highlights the urgent need for intervention strategies targeting sarcopenia.
Multiple factors may affect sarcopenia progression, among which the gut microbiota plays a particularly significant role[7]. The human gut microbiota plays a critical role in overall health by modulating numerous physiological systems, including muscular functions. By regulating energy balance and nutrient metabolism, the gut microbiota supports the production of short-chain fatty acids (SCFAs), which may promote muscle repair and sustain muscle function[8]. Gut dysbiosis may impair these processes, consequently contributing to the development and progression of sarcopenia[9]. The ingestion of probiotic-rich foods has further been found to affect the composition of the gut microbiota, and existing studies have linked this association to a lower risk of various diseases[10]. Additionally, numerous studies have shown that probiotic supplementation regulates the composition and function of the gut microbiota, thereby influencing the gut-muscle axis and contributing to the prevention or treatment of sarcopenia[11,12]. However, only a limited number of individuals regularly consume probiotics. Most live microbes ingested by individuals over time are derived from their daily food.
In addition to probiotics, live dietary microbes directly affect the gut microbiota[13]. Sanders et al[14] first used cross-sectional data from the NHANES and Nutrition Examination Survey to categorize foods into three groups. Several studies[15,16] have since utilized Sanders' classification system and data from the NHANES database to investigate the relationship between the consumption of live microbes and various health outcomes, including sarcopenia, offering invaluable insights into the potential health effects of live microbes.
Although one study used data from the NHANES database to investigate the relationship between live microbial intake and sarcopenia, significant research gaps remain in this field, particularly when considering the substantial variations in dietary patterns, lifestyle habits, and population characteristics across different countries and regions. No studies have yet been conducted on the relationship between live dietary microbes and sarcopenia in the Chinese population. Therefore, in the present study, we conducted surveys on the dietary intake and incidence of sarcopenia to investigate the association between the consumption of live microbes and sarcopenia using a classification system for live microbes in Chinese foods (CLMCS).
-
Data were obtained from the Shanghai Diet and Health Surveillance (SDHS), a representative cross-sectional study conducted by the Shanghai Municipal Centre for Disease Control and Prevention. The study population comprised adults aged 18 years and older who had resided in the city for at least six months. A multistage stratified random sampling method was used. First, 48 surveillance points across the city were selected using a population proportional probability sampling method. Second, one to three neighborhood/administrative villages were selected from the towns/streets using a simple random sampling method according to the proportion of the population. A total of 71 neighbourhood/administrative villages were selected. A simple random sampling method was applied to select 40 residents from each community and administrative village. Participants were selected from the following age groups, with each group comprising 5 males and 5 females: 18 to 44 years old, 45 to 59 years old, 60 to 74 years old, and 75 years old and above. As sarcopenia is now diagnosed at a younger age, many studies have explored the risk factors for sarcopenia in people aged 50 years and older[17]. Thus, the present study included all participants aged 50 and above from the SDHS.
-
This study was approved by the Ethics Committee of the Shanghai Center for Disease Control and Prevention (KY-2024-16) and was conducted in accordance with the Declaration of Helsinki. Written informed consent was obtained from all the participants before their inclusion.
-
A standardized questionnaire was used to collect information on basic characteristics, personal health, behavioral habits, and diet. Trained investigators collected the data in a one-to-one manner. A 24-hour dietary recall was conducted over three consecutive days, with each participant reporting all foods consumed over the last 24 h, including two weekdays and one weekend. Information collected using the questionnaire was as follows: whether all consumed foods were pre-packaged foods, names of the raw materials, quality of consumption, and primary cooking methods.
Uniformly trained investigators measured each participant’s physical variables, including height, weight, and blood pressure, using standard methods. All tools used for the physical examination were tested and qualified for use in the program. Blood pressure was measured using an electronic sphygmomanometer, with a precision of 1 mmHg. Measurements were conducted three times, at one minute apart.
-
In total, 6 mL of venous blood was collected from each participant after 10–14 h of fasting. The samples were stored in a refrigerator immediately after collection and the test was completed within 8 h. Hematological indicators included fasting blood glucose (FBG) (hexokinase method), serum triglycerides (TG) (enzymatic method), high-density lipoprotein cholesterol (HDL-C) (direct method-catalase clearance method), and glycosylated hemoglobin (HbA1c) (high-performance liquid chromatography method). FBG, TG, and HDL-C were all measured using a Hitachi 008α instrument, while HbA1c was measured using a Tosoh G11 instrument.
-
Dietary intake data were derived from face-to-face 24-hour dietary recall interviews. Participants provided comprehensive details regarding all of their consumed foods and beverages. Foods containing live microbes were classified using the CLMCS, which is based on the Chinese Food Composition Table. Food samples were categorized into low (< 10 CFU/g), medium (10–10 CFU/g), and high (> 10 CFU/g) microbial groups. This method is consistent with the classification criteria proposed by Professor Sanders[3]. Most foods (n = 2,303) were classified as low-level foods, including commonly consumed items such as pork and noodles. Medium-level foods (n = 173) predominantly included fresh fruits consumed with the skin and fermented condiments, such as apples and fermented bean paste. High-level foods (n = 47) consisted primarily of fermented products, including yogurt and milk skin (nai pi zi). The participants were subsequently categorized into three dietary groups: low dietary intake of live microbes (exclusive consumption of low-level foods), medium intake of dietary live microbes (consumption of medium-level foods without high-level foods), and high intake of dietary live microbes (consumption of any high-level foods).
-
Sarcopenia was diagnosed based on the 2019 criteria established by the European Working Group on Sarcopenia in Older People (EWGSOP2019) using a three-step algorithm[18]. First, participants were screened using the SARC-F questionnaire, with a score of ≥ 4 indicating potential sarcopenia. Second, muscle strength and physical performance were evaluated. Low muscle strength was defined as a grip strength < 27 kg for males and < 16 kg for females. Impaired physical performance was defined as a gait speed of ≤ 0.8 m/s. Finally, the presence of low muscle mass was confirmed by bioelectrical impedance analysis (BIA) using a body composition analyzer (Inbody270).
-
A questionnaire survey was conducted to collect demographic data, including age and sex. Educational level was classified into three categories: below high school, high school or equivalent, and above high school. Marital status was categorized into three groups: married, unmarried, and other (widowed or divorced). Annual income was categorized as ≤ 49,000 CNY, 50,000–199,900 CNY, and ≥ 200,000 CNY. Body mass index (BMI) was calculated as weight (kg) divided by height squared (m2). BMI values of less than 18.5 kg/m2, between 18.5 kg/m2 and 24 kg/m2, from 24 kg/m2 to less than 28 kg/m2, and 28 kg/m2 or higher were defined as underweight, normal, overweight, and obese, respectively. Physical activity levels were categorized as insufficient (< 500 metabolic equivalent task (MET)] minutes/week) or moderate to high (> 500 MET-minutes per week)[19]. Hypertension was defined as blood pressure ≥ 140/90 mmHg, measured more than three times on different days. Subjects with fasting plasma glucose (FPG) ≥ 7.0 mmol/L were defined as having diabetes. The prevalence of fatty liver disease was also self-reported.
-
All analyses were conducted using R (version 4.4.2), with p-values less than 0.05 considered statistically significant. Categorical variables are summarized as the frequencies and percentages (%), while continuous variables are reported as means and standard errors (SE). The chi-square test was applied to compare categorical variables, and the t-test was used to compare continuous variables. Univariate analyses were conducted to identify the variables with significant differences between the sarcopenic and non-sarcopenic groups.
The relationship between live dietary microbial intake and sarcopenia was investigated using binary logistic regression analysis. To investigate whether this association was modified by baseline characteristics, the interaction terms between the dietary live microbe group and each stratifying variable (sex, age, diabetes, fatty liver disease, and overweight/obesity) were introduced separately into the fully adjusted logistic regression model. The statistical significance of these interactions was determined by evaluating the p-value of the corresponding interaction terms. Stratified analyses were subsequently conducted to determine specific effect sizes within each subgroup.
-
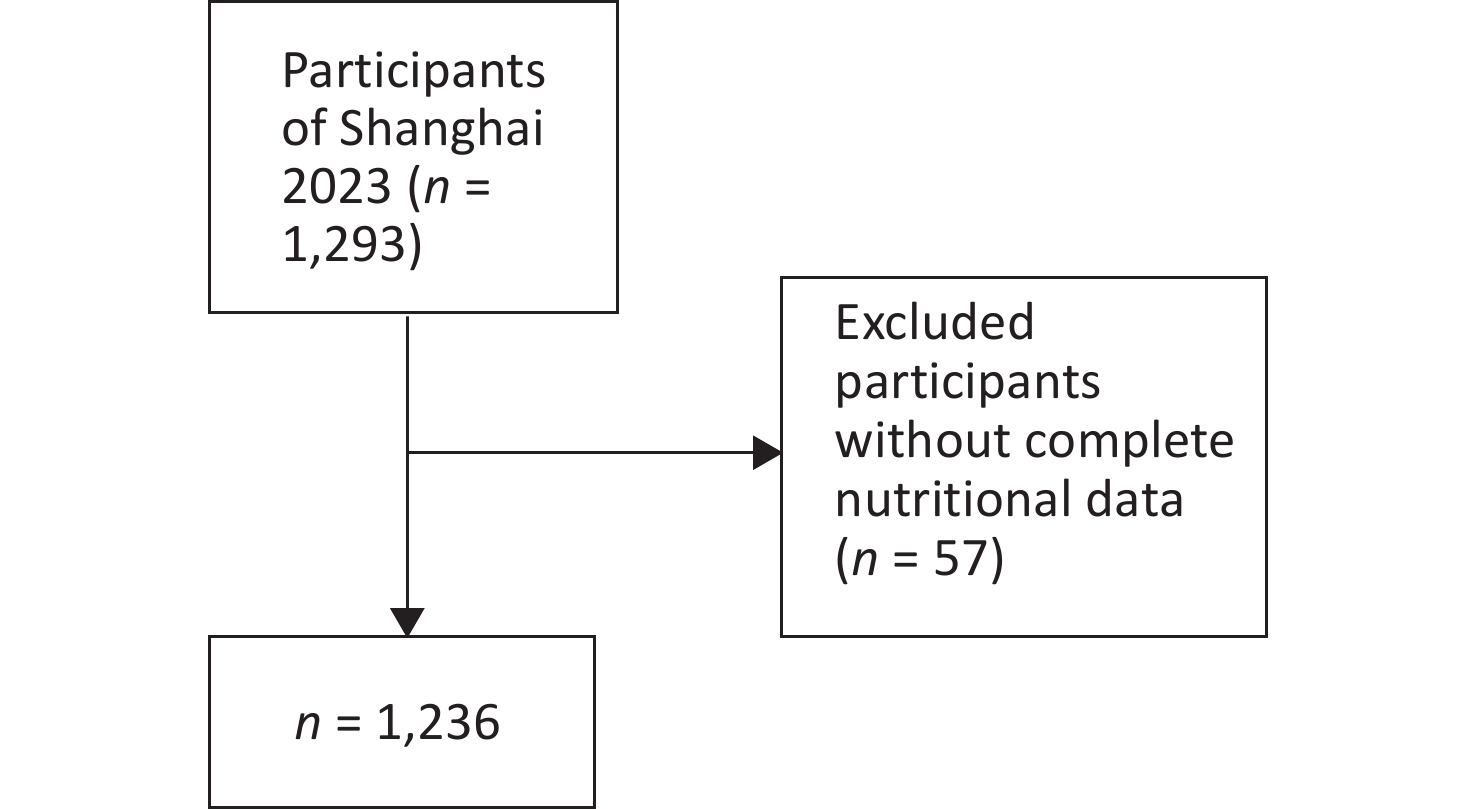
Among the 1,293 initially enrolled participants, 57 were excluded due to incomplete or invalid nutritional data (Figure 1). In total, 1,236 participants were enrolled in this study. The prevalence of sarcopenia in this population was 18.28%. The baseline characteristics of the participants are summarized in Table 1. Significant differences in terms of age, sex, educational level, TC level, diabetes, fatty liver, and BMI were observed between the sarcopenic and non-sarcopenic individuals. Advanced age (P < 0.001) and diabetes mellitus (P = 0.002) were identified as the risk factors for sarcopenia. Females (P = 0.020) and individuals with high educational levels (P = 0.006) exhibited a lower risk of sarcopenia. Importantly, a high dietary intake of live microbes was found to be associated with a lower risk of sarcopenia (P < 0.001). Additionally, individuals with sarcopenia exhibited lower BMI (P < 0.001), TC levels (P = 0.006), and a reduced risk of fatty liver disease (P = 0.005). The relationship between sarcopenia and nutrient intake is shown in Table 2. People without sarcopenia consumed more zinc than those with sarcopenia (P = 0.041).
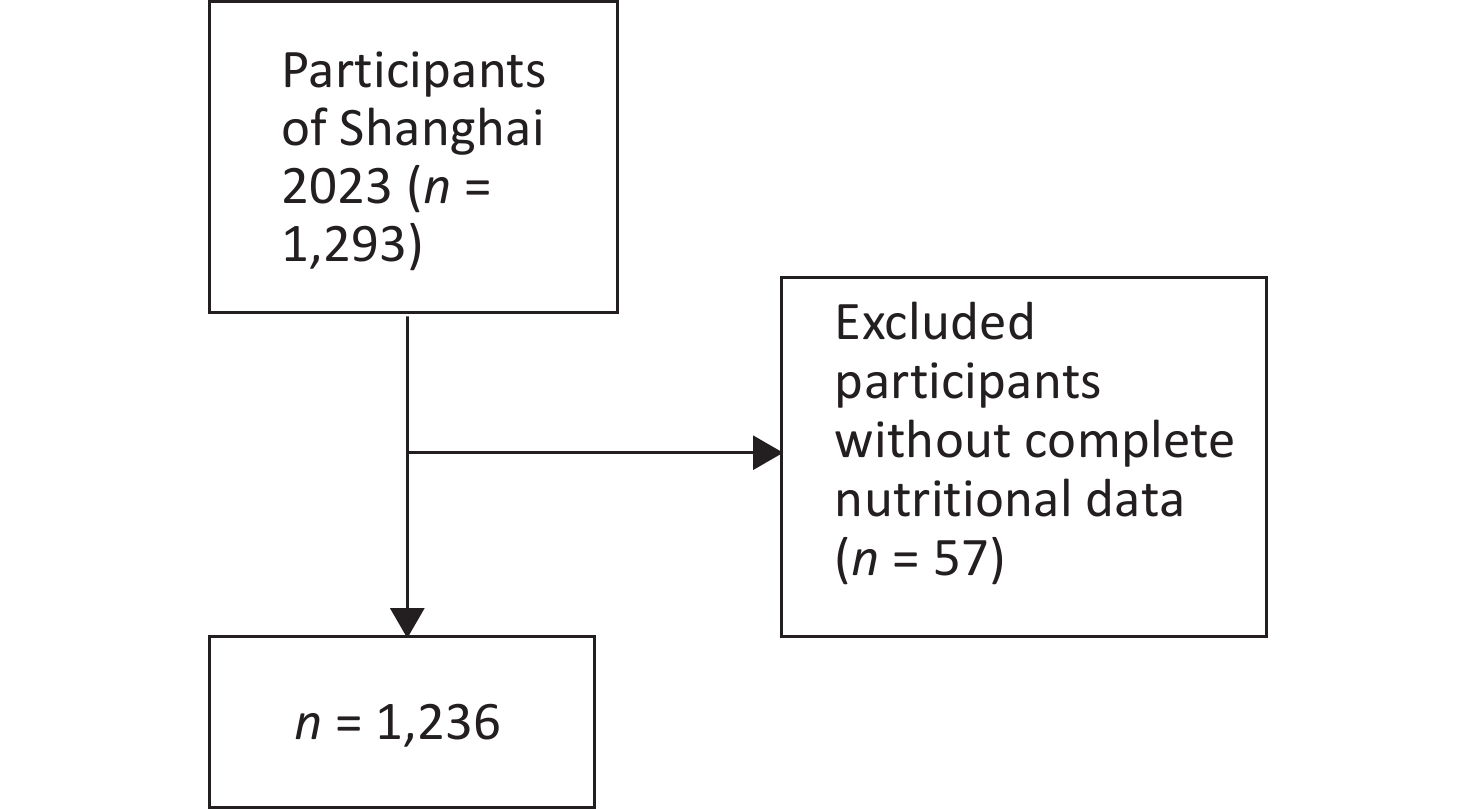
Figure 1. Flowchart illustrating the sample selection from SDHS.
Characteristic Total Sarcopenia P value No (1,010) Yes (226) Age (years) 67.18 ± 9.93 66.15 ± 9.65 71.77 ± 9.91 < 0.001 Gender (%) 0.020 Male 592 (47.90) 468 (46.34) 124 (54.87) Female 644 (52.10) 542 (53.66) 102 (45.13) Education level (%) 0.006 Low 284 (22.98) 214 (21.19) 70 (30.97) Medium 803 (64.97) 670 (66.34) 133 (58.85) High 149 (12.05) 126 (12.48) 23 (10.18) Marital status (%) 0.099 Unmarried 26 (2.10) 19 (1.88) 7 (3.10) Married 981 (79.37) 813 (80.50) 168 (74.34) Other 229 (18.53) 178 (17.62) 51 (22.56) Annual income (%) 0.288 ≤ 49,000 CNY 200 (16.18) 156 (15.45) 44 (19.47) 50,000 – 199,900 CNY 839 (67.88) 689 (68.22) 150 (66.37) ≥ 200,000 CNY 197 (15.94) 165 (16.34) 32 (14.16) BMI(%) < 0.001 < 18.5 31 (2.51) 6 (0.59) 25 (11.06) 18.5 ≤ BMI < 24.0 527 (42.64) 369 (36.53) 158 (69.91) 24.0 ≤ BMI < 28.0 506 (40.94) 463 (45.84) 43 (19.03) BMI ≥ 28.0 172 (13.91) 172 (17.03) 0 (0.00) TG (mmol/L) 1.67 ± 1.13 1.71 ± 1.16 1.48 ± 0.95 0.986 TC (mmol/L) 5.14 ± 1.03 5.14 ± 1.04 5.13 ± 0.99 0.006 Smoking status (%) 0.506 No 881 (71.28) 724 (71.68) 157 (69.47) Yes 355 (28.32) 286 (28.32) 69 (30.57) Alcohol consumption (%) 0.954 No 806 (65.21) 659 (65.25) 147 (65.04) Yes 430 (34.79) 351 (34.75) 79 (34.96) PA (%) 0.500 < 500 MET-min/week 576 (46.60) 463 (45.84) 113 (50.00) ≥ 500 MET-min/week 660 (53.40) 547 (54.16) 113 (50.00) Dietary live microbe group (%) < 0.001 Low 442 (35.76) 337(33.37) 105 (46.46) Medium 633(51.21) 532(52.67) 101 (44.69) High 161 (13.03) 141(13.96) 20 (8.85) Hypertension (%) 0.183 No 689 (55.74) 572(56.63) 117 (51.77) Yes 547 (44.26) 438(43.37) 109 (48.23) Diabetes (%) 0.002 No 1,086 (87.86) 901 (89.21) 185(81.86) Yes 150 (12.14) 109 (10.79) 41 (18.14) Fatty liver (%) 0.005 No 989 (80.02) 793 (78.51) 196 (86.73) Yes 247 (19.98) 217 (21.49) 30 (13.27) Table 1. Baseline characteristics of participants, stratified by sarcopenia status
Nutrient Total Sarcopenia P value No Yes Energy (kcal) 1705.76 ± 647.77 1718.89 ± 662.05 1647.08 ± 577.37 0.132 Protein (g) 74.77 ± 36.75 75.59 ± 37.34 71.08 ± 33.79 0.095 Fat (g) 68.97 ± 37.31 69.11 ± 36.68 68.31 ± 40.1 0.769 Cholesterol (mg) 498.35 ± 442.28 501.06 ± 431.8 486.22 ± 487.22 0.649 Carbohydrate (g) 197.99 ± 88.31 200.01 ± 91.25 188.94 ± 73.31 0.088 Dietary Fiber (g) 8.14 ± 8.40 8.32 ± 8.88 7.35 ± 5.74 0.115 Calcium (mg) 531.47 ± 408.22 538.2 ± 415.41 501.39 ± 373.8 0.221 Phosphorus (mg) 942.03 ± 431.69 953.36 ± 435.35 891.41 ± 412.06 0.051 Potassium (mg) 1809.28 ± 1092.33 1832.24 ± 1111.25 1706.63 ± 999.25 0.118 Sodium (mg) 4504.28 ± 960.69 4480.03 ± 3611.3 4612.64 ± 5254.15 0.649 Magnesium (mg) 267.15 ± 147.96 270.85 ± 151.78 250.62 ± 128.51 0.063 Iron (mg) 20.67 ± 14.71 21.01 ± 15.57 19.17 ± 9.88 0.090 Zinc (mg) 9.79 ± 4.96 9.93 ± 5.09 9.18 ± 4.32 0.041 Selenium (μg) 50.21 ± 32.78 51.02 ± 33.68 46.6 ± 28.22 0.067 Copper (mg) 1.71 ± 1.17 1.74 ± 1.23 1.58 ± 0.85 0.068 Manganese (mg) 5.18 ± 12.46 5.29 ± 13.32 4.67 ± 7.51 0.499 Iodine (μg) 190.67 ± 739.12 165.74 ± 430.11 302.09 ± 1467.54 0.168 Vitamin A (μgRAE) 545.38 ± 602.61 557.82 ± 636.05 489.76 ± 418.59 0.125 Carotene (μg) 2095.42 ± 2740.11 2133.7 ± 2890.07 1924.36 ± 1928.59 0.299 Thiamine (mg) 0.79 ± 0.41 0.8 ± 0.42 0.74 ± 0.38 0.088 Riboflavin (mg) 0.92 ± 0.57 0.93 ± 0.57 0.86 ± 0.55 0.069 Niacin (mg) 14.8 ± 8.15 14.94 ± 8.11 14.14 ± 8.32 0.180 Vitamin C (mg) 80.66 ± 127.85 82.58 ± 139.54 72.09 ± 48.09 0.265 Vitamin E (mg) 23.06 ± 16.59 23.15 ± 15.34 22.68 ± 21.34 0.701 Folate (μg) 84.69 ± 113.54 85.25 ± 116.35 82.19 ± 100.2 0.714 Total 25(OH)D 22.29 ± 7.85 22.31 ± 7.77 22.18 ± 8.23 0.825 Table 2. Intake of dietary nutrients of participants classified by sarcopenia status
-
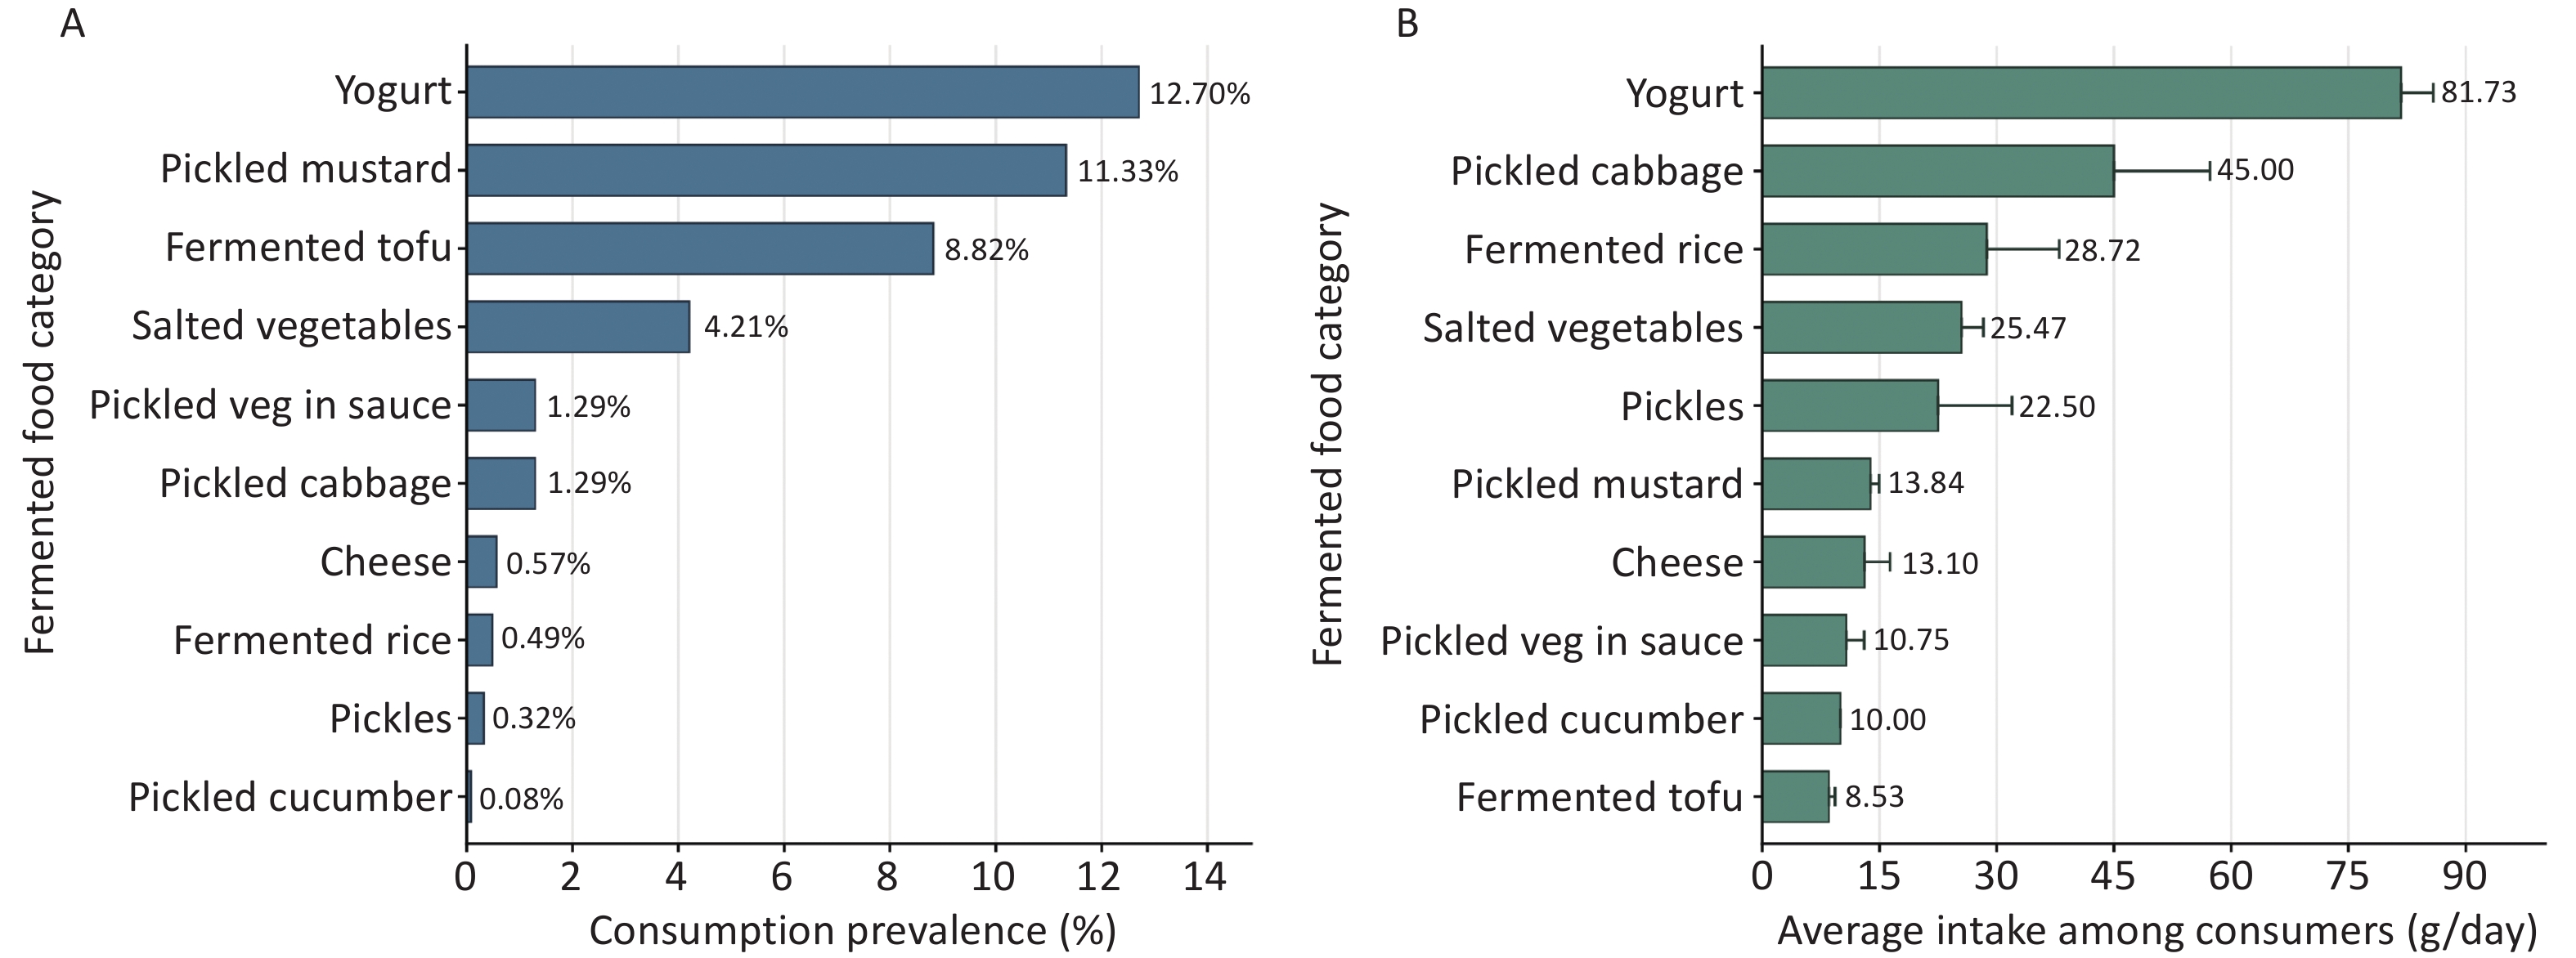
To further elucidate the specific dietary patterns contributing to live microbe intake in this cohort, we analyzed both the consumption prevalence (Figure 2A) and average daily intake among consumers (Figure 2B) for the medium and high live microbial food categories. Yogurt was the most widely consumed live microbial source, with a prevalence of 12.70% and an average intake of 81.73 g/day among consumers. Notably, traditional Chinese fermented foods demonstrated substantial penetration in the older population, with pickled mustard (11.33%) and fermented tofu (8.82%) classified as the second- and third-most prevalent sources, respectively. When examining the intake volume among actual consumers, items typically consumed as side dishes or condiments showed realistic portion sizes, such as pickled cabbage (45.00 g/day), fermented rice (28.72 g/day), and fermented tofu (8.53 g/day, equivalent to approximately one standard cube). Consistent with traditional dietary habits, the consumption of typical Western fermented foods, such as cheese, was exceptionally rare (0.57%).
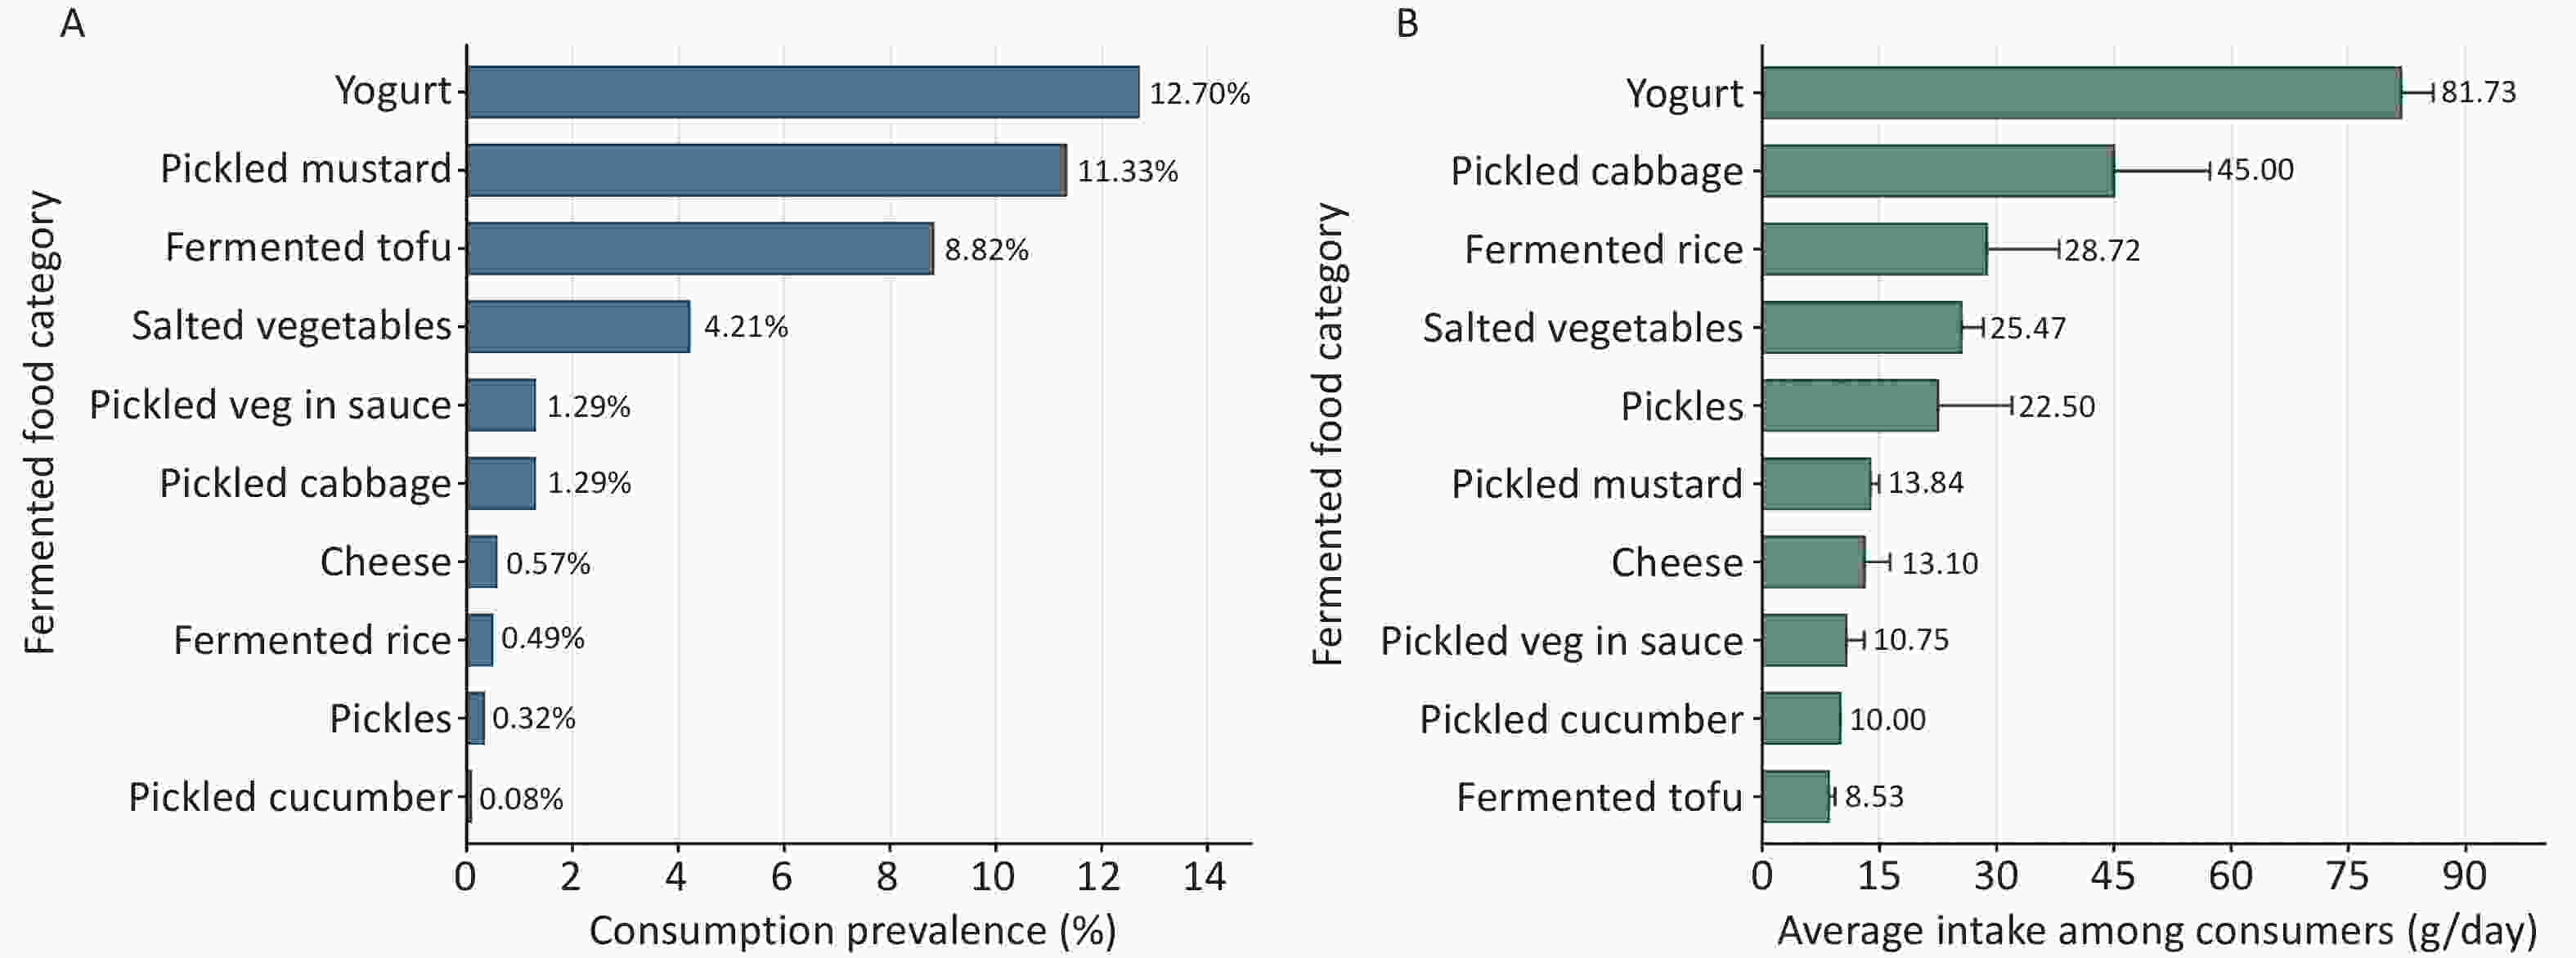
Figure 2. Dietary sources of live microbes among the study participants. (A) Consumption prevalence of various fermented food categories. (B) Average daily intake among consumers.
-
The association between live microbe intake and the risk of sarcopenia was investigated using both unadjusted and adjusted logistic regression analyses (Table 3). In the crude model, both medium dietary live microbe intake (OR = 0.61, 95% CI: 0.45-0.83) and high dietary live microbe intake (OR = 0.46, 95% CI: 0.27-0.76) groups showed significantly lower risk of sarcopenia compared to the low intake group. The protective effects observed for both intake levels remained significant in Model 1, which was adjusted for age and sex (P < 0.001). Model 2 was further adjusted for educational level, marital status, and BMI (P = 0.007). Model 3 was further adjusted for chronic diseases (diabetes and fatty liver), and showed no substantial changes in the results (P = 0.008). In the fully adjusted Model 4, which was adjusted for all covariates, the medium intake of dietary live microbes (OR = 0.64, 95% CI: 0.44-0.93) and high intake of dietary live microbes (OR = 0.41, 95% CI: 0.22-0.77) groups were still correlated with a reduced risk of sarcopenia (P = 0.007).
Model Low dietary live microbe group Medium dietary live microbe group High dietary live microbe group P trend Crude model 1 [Reference] 0.61 (0.45, 0.83) 0.46 (0.27, 0.76) < 0.001 Model 1 1 [Reference] 0.58 (0.42, 0.79) 0.43 (0.25, 0.73) < 0.001 Model 2 1 [Reference] 0.66 (0.46, 0.96) 0.41 (0.22, 0.75) 0.007 Model 3 1 [Reference] 0.66 (0.45, 0.95) 0.42 (0.23, 0.78) 0.008 Model 4 1 [Reference] 0.64 (0.44, 0.93) 0.41 (0.22, 0.77) 0.007 Note. Crude model: unadjusted model. Model 1: adjusted for gender, age. Model 2: adjusted for gender, age, education level and BMI. Model 3: adjusted for gender, age, education level, BMI, diabetes and fatty liver. Model 4: adjusted for gender, age, education level, BMI, diabetes, fatty liver, TC , protein, phosphorus, calcium and zinc intake. Table 3. Logistic regression analysis of the association between sarcopenia and dietary live microbe group
-
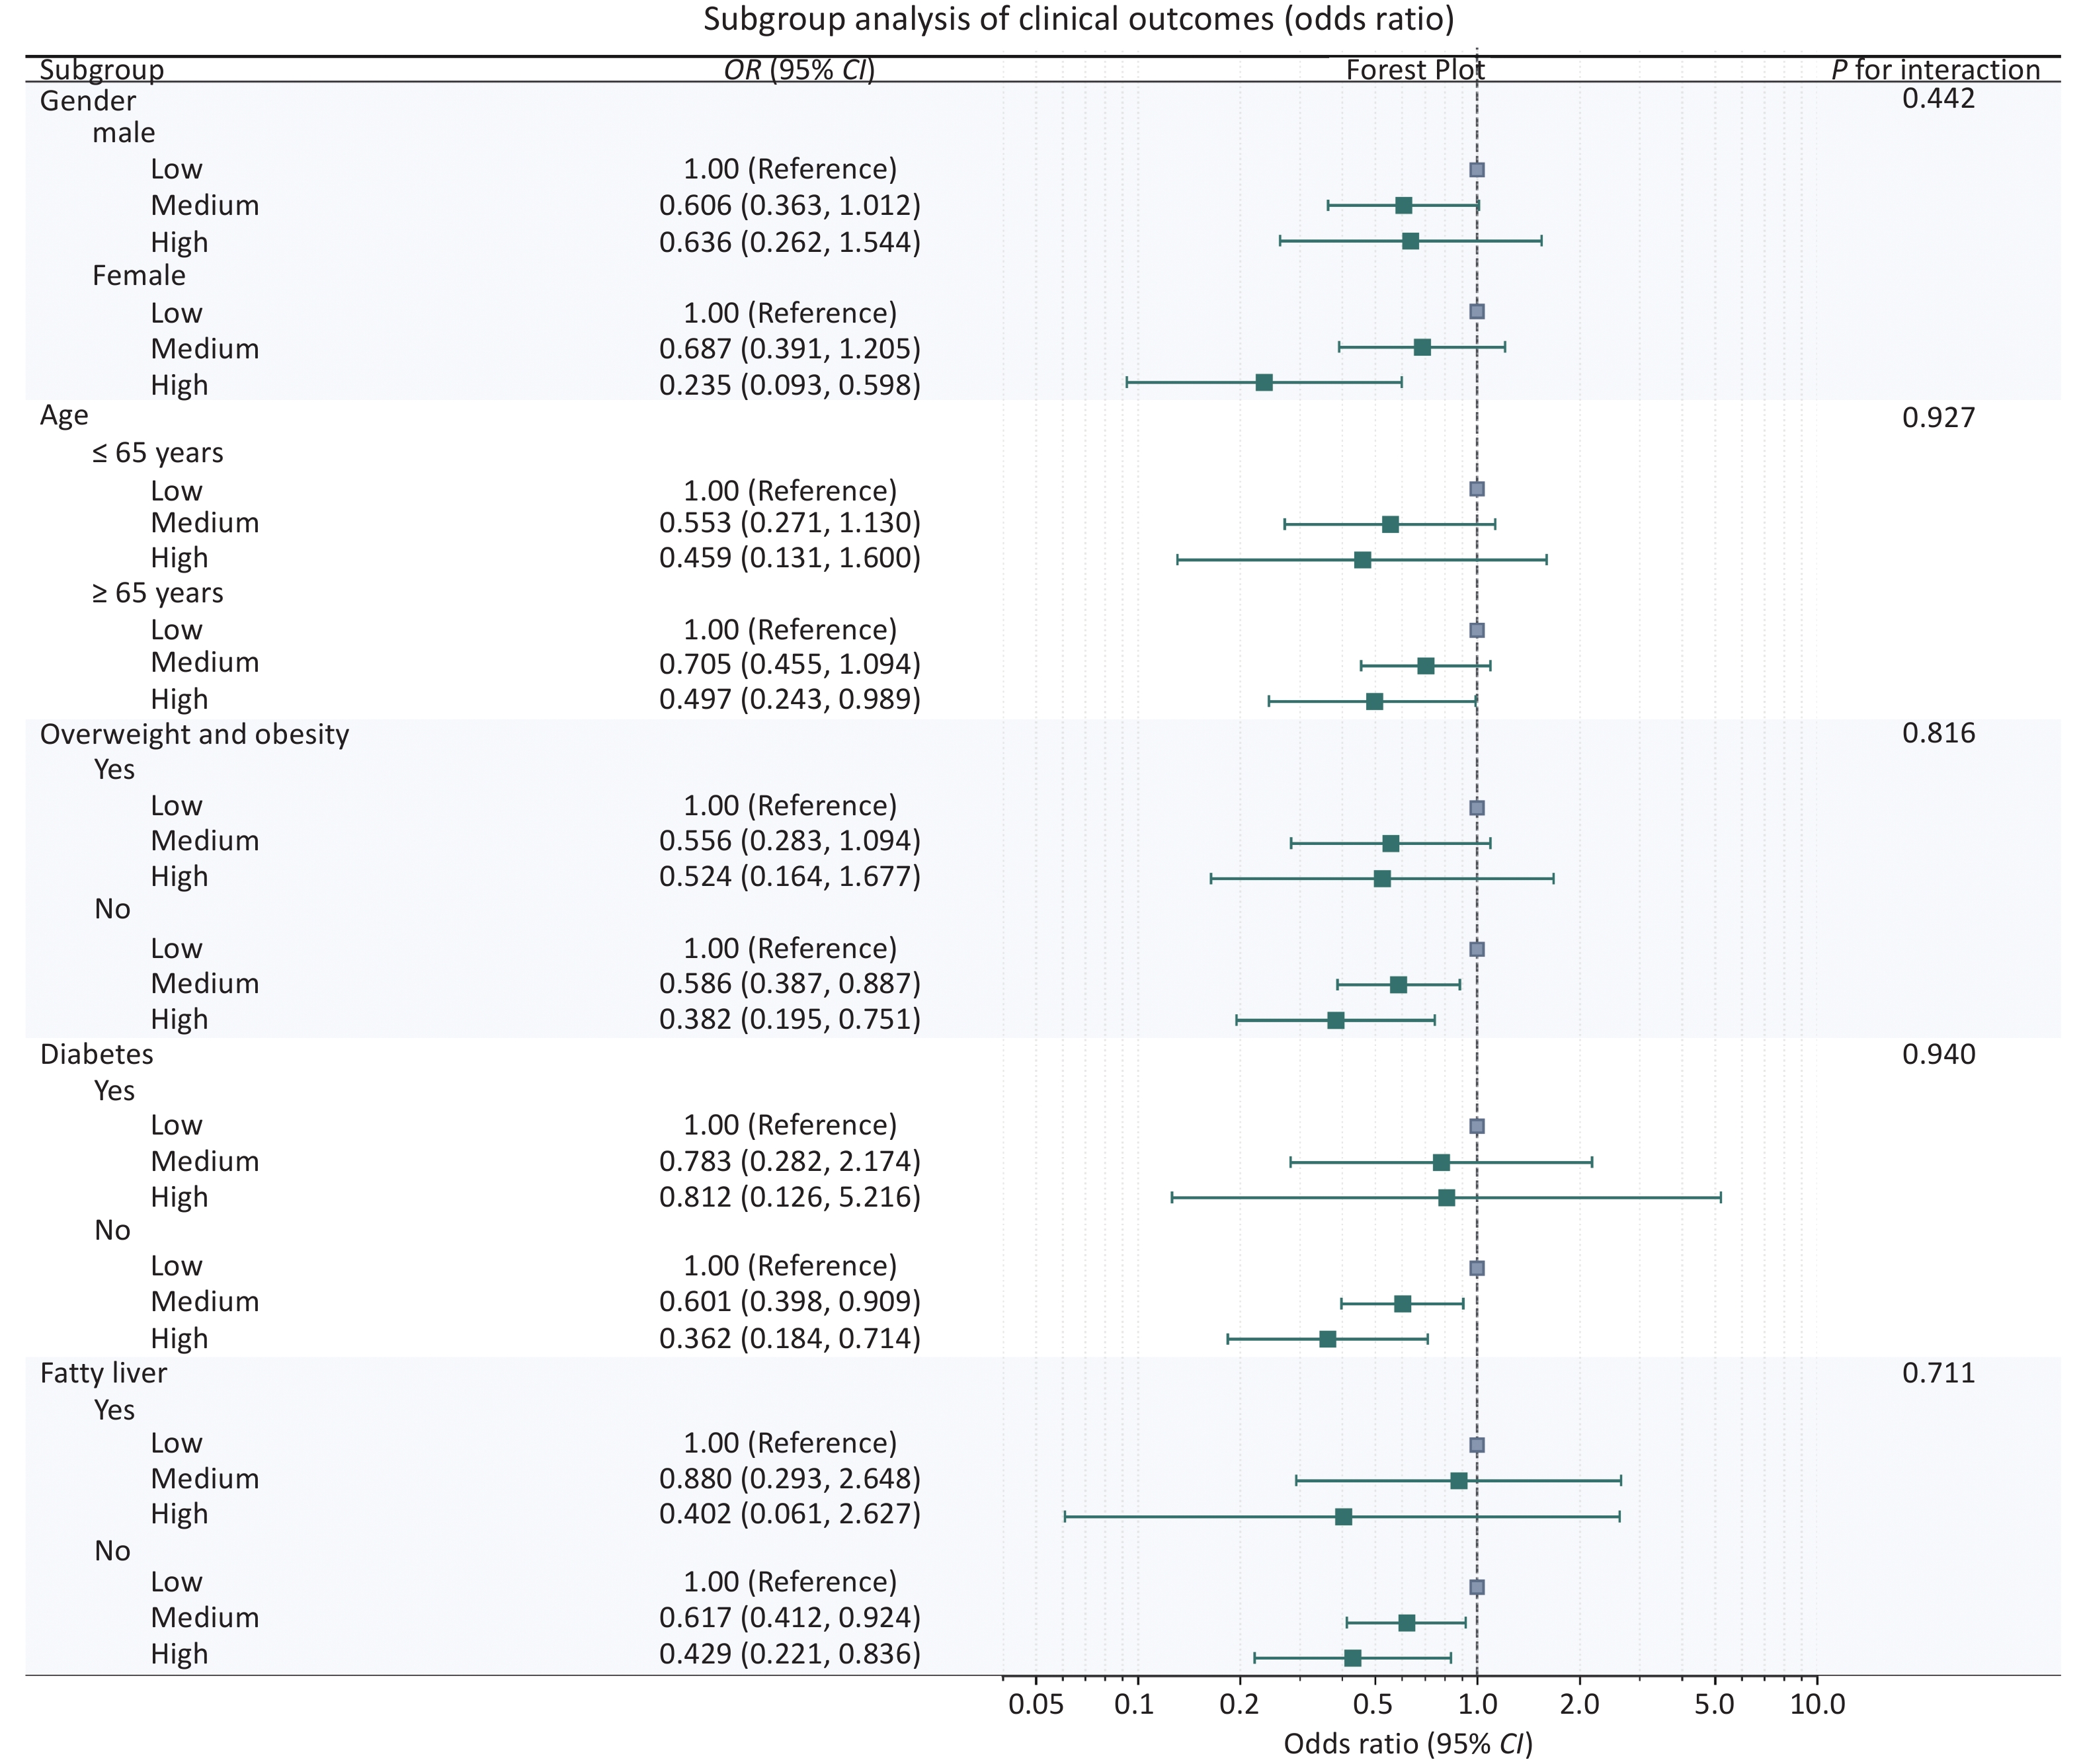
To evaluate whether the association between dietary live microbe intake and sarcopenia was modified by potential confounding factors, subgroup analyses were conducted for sex, age, diabetes, fatty liver disease, overweight, and obesity (Figure 3). The results revealed no statistically significant interactions between live dietary microbial groups and these factors (P > 0.05). However, a higher dietary intake of live microbes was found to be significantly associated with a reduced risk of sarcopenia in participants aged ≥ 65 years (OR = 0.497, 95% CI: 0.243–0.989); however, this association was not statistically significant in those aged < 65 years (OR = 0.459, 95% CI: 0.131–1.600). Interestingly, a significant inverse association was found between a high dietary intake of live microbes and sarcopenia in the non-overweight subgroup (OR = 0.382, 95% CI: 0.195–0.751), while this association was not statistically significant in the overweight and obese subgroups (OR = 0.524, 95% CI: 0.164–1.677). Among participants without diabetes, compared to the group with a low intake of live dietary microbes, the OR for sarcopenia was 0.601 (95% CI: 0.398–0.909) for the medium intake group and 0.362 (95% CI: 0.184–0.714) for the high intake group. Among participants with diabetes, compared with the low-intake group, the OR was 0.783 (95% CI: 0.282–2.174) for the medium-intake group and 0.812 (95% CI: 0.126–5.216) for the high-intake group. Among individuals without fatty liver, high dietary microbe intake was significantly associated with a lower risk of sarcopenia (OR = 0.429, 95% CI: 0.221–0.836); however, this association was not statistically significant in those with fatty liver (OR = 0.402, 95% CI: 0.061–2.627).
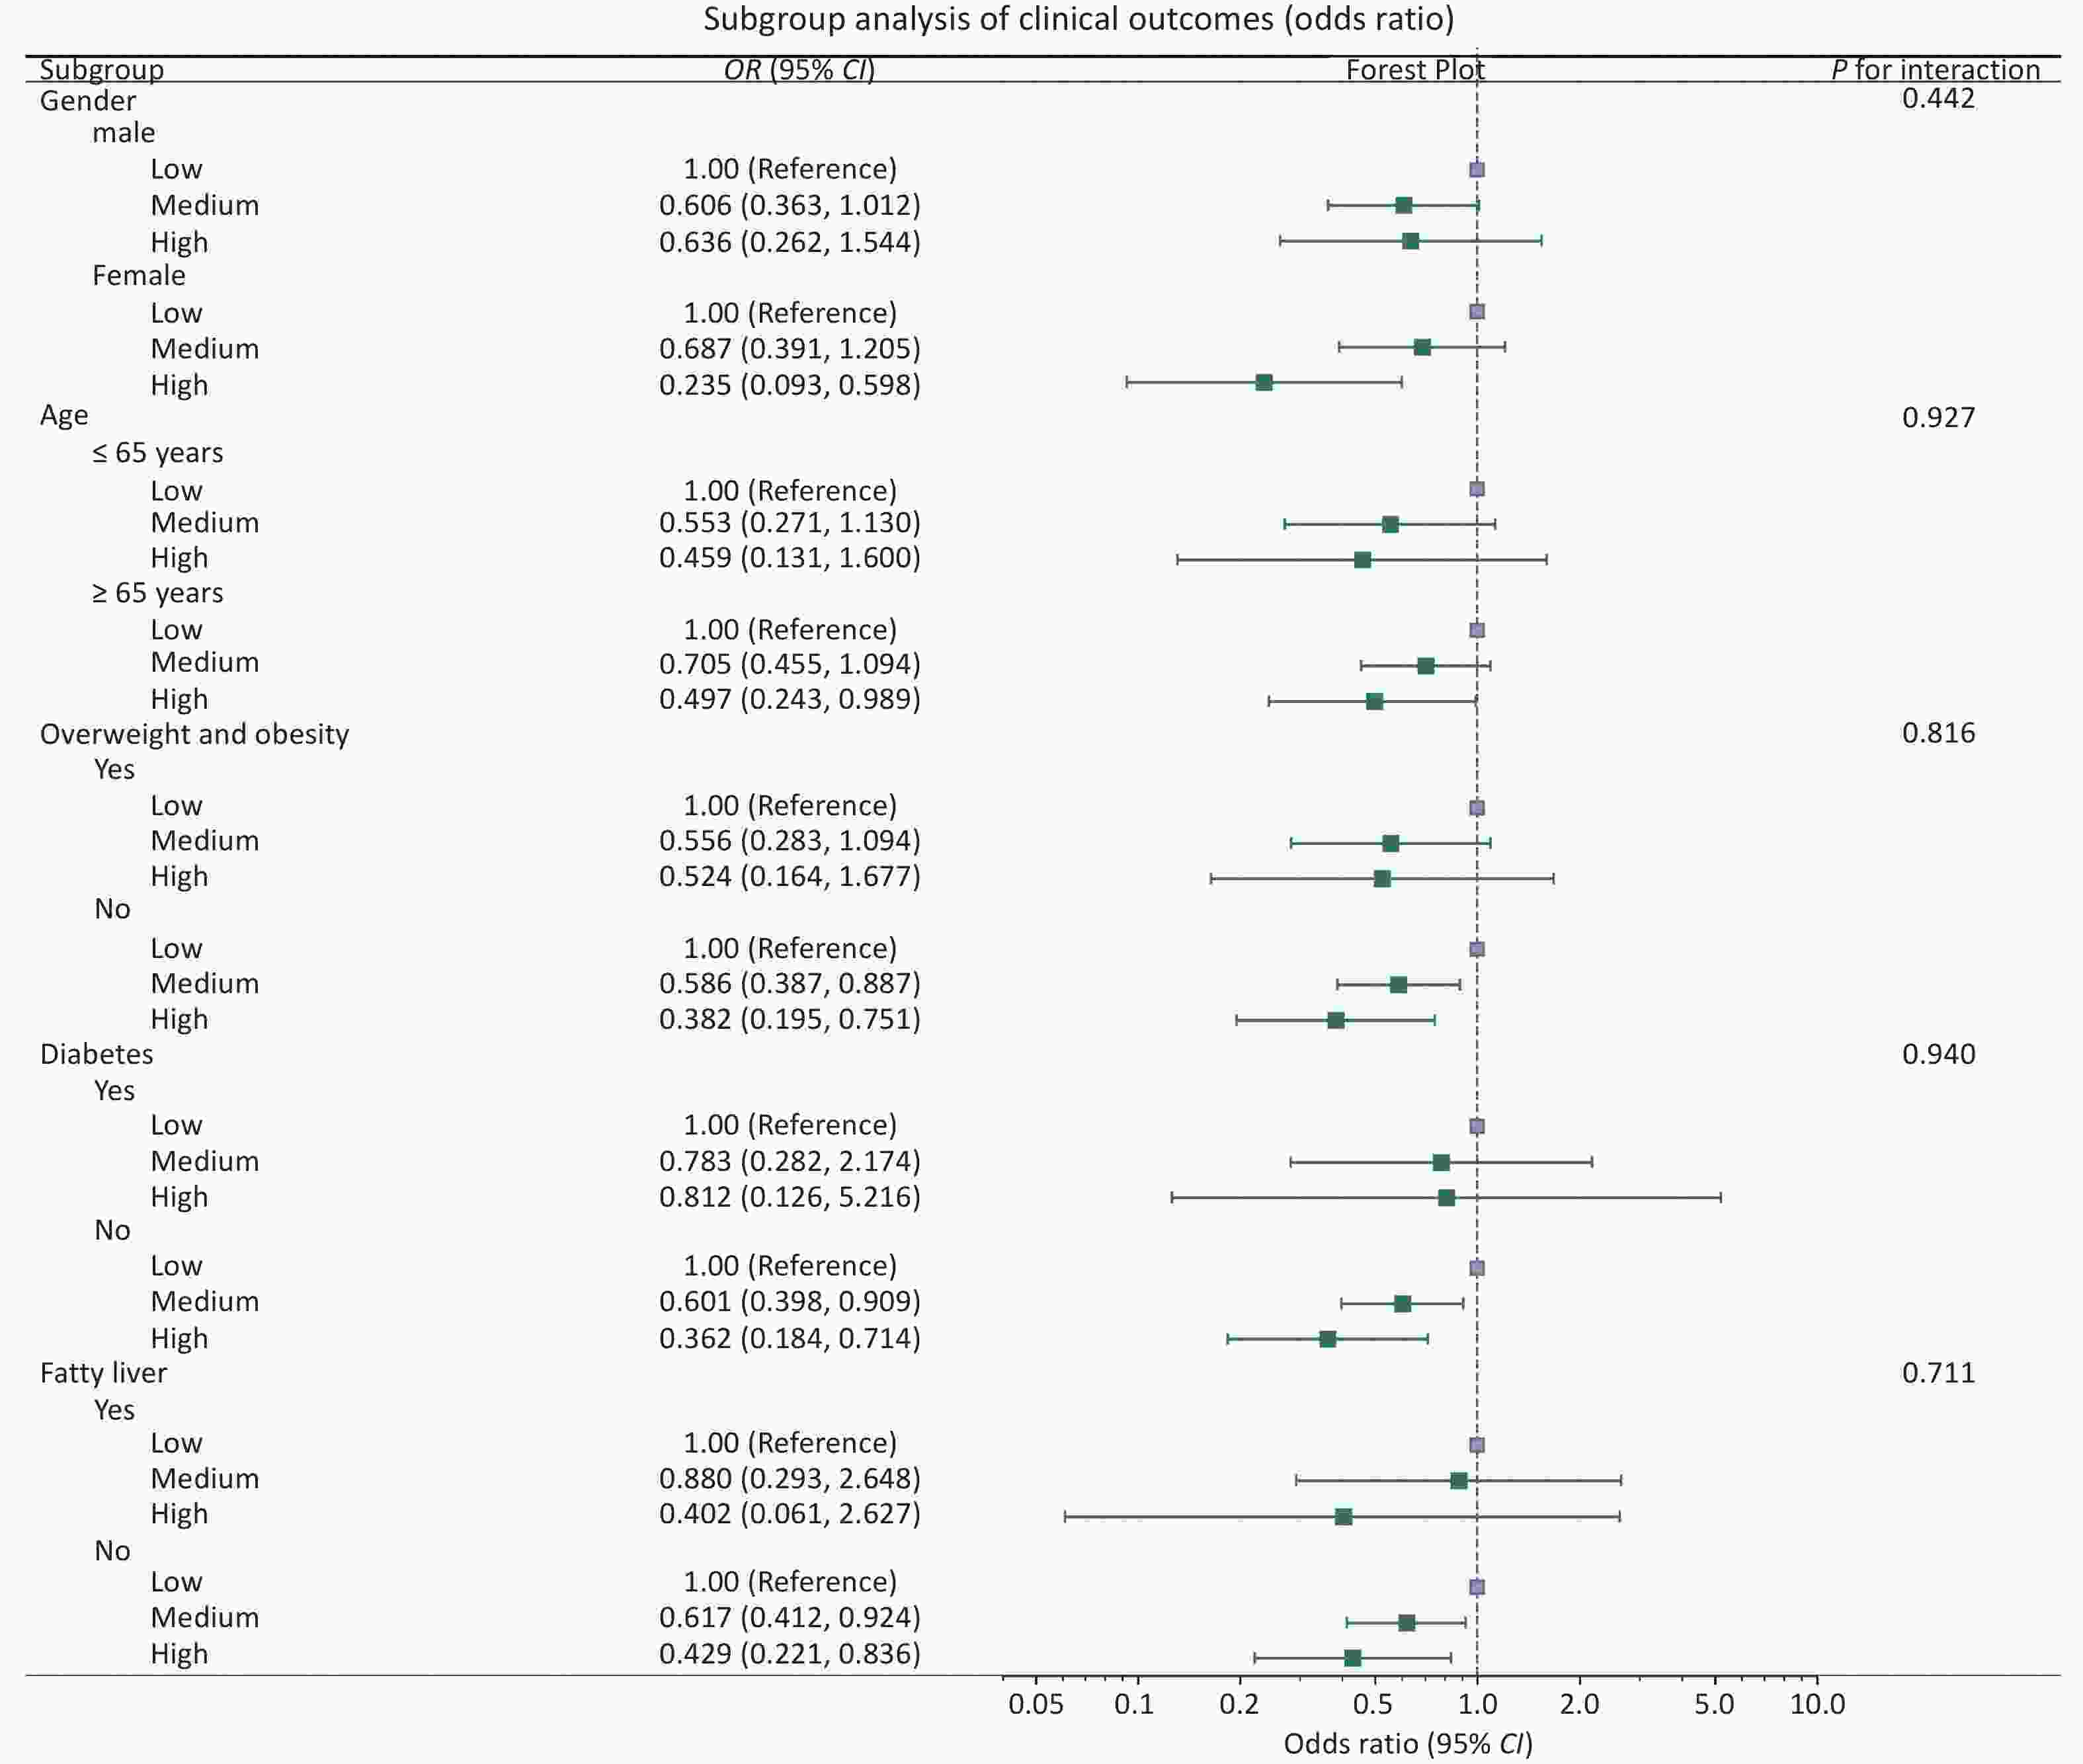
Figure 3. Subgroup analyses for sarcopenia and live microbe intake in participants stratified by gender, age, diabetes, hypertension, fatty liver, and overweight/obesity.
-
Sarcopenia has a significant effect on the quality of life of older adults; however, few studies have investigated the relationship between sarcopenia and the intake of live microbes. In our study, the prevalence of sarcopenia was found to be 18.28%, which is higher than 16.70% reported in a previous study based on the West China Health and Aging Trend (WCHAT)[20]. This also suggests the need for further research into sarcopenia in Shanghai, a representative of the eastern coastal cities of China.
Recent studies based on the NHANES database have focused on the role of the total intake of live dietary microbes in sarcopenia[21-23]. The classification systems used in these studies were largely based on the consumption patterns of typical American diets and fermented foods such as yogurt, cheese, and sauerkraut. In contrast, the Chinese diet features a broad range of fermented foods, including fermented tofu, pickled vegetables, and other region-specific products that differ in terms of live microbial composition and processing methods. Compared with cheese, which predominantly contains Lactobacillus and Streptococcus species[24], fermented black soybeans (Dou chi) harbor a more diverse microbial community, including Bacillus, Aspergillus, and Mucor[9]. These dietary differences may lead to distinct compositions of the gut microbiota and subsequent differences in health effects. Our findings confirm the association between a higher intake of live microbes and a reduced risk of sarcopenia in the Chinese population. Nevertheless, despite these differences in food sources, our study similarly found that a high dietary intake of live microbes was independently associated with lower odds of sarcopenia (OR = 0.41, P[1] = 0.007), even after controlling for a comprehensive range of demographic, nutritional, and health-related covariates. Prior studies based on the NHANES data have also reported a significant inverse association between live microbe intake and sarcopenia, with an OR of approximately 0.63 in the highest vs. lowest intake group[25]. Dietary intake of live microbes has additionally been suggested to affect muscle health via the gut-muscle axis, based on existing research[26]. Live microbes may improve muscle health largely by modulating gut function, as supported by relevant evidence[27]. Specifically, live microbes can reshape the gut microbiota composition and enhance microbial diversity, primarily by increasing the abundance of beneficial commensal microbes, such as Lactobacillus and Bifidobacterium species[28]. These microbes can outcompete pathogenic or pro-inflammatory bacteria, thereby restoring the microbial balance and promoting intestinal homeostasis. Healthy and diverse microbiota can promote the production of SCFAs, such as butyrate, acetate, and propionate, which can improve muscle function. SCFAs serve as energy sources for colonocytes and as signaling molecules that affect systemic metabolic and immune responses. Prior studies have shown that live microbe intake upregulates the anti-inflammatory cytokine IL-10 and downregulates the levels of ROS and the pro-inflammatory cytokine TNF-α[11]. These alterations minimize chronic inflammation-mediated muscle damage and decelerate muscle protein breakdown. Moreover, SCFAs may directly affect the skeletal muscle. In particular, butyric acid has been reported to activate several signaling pathways, such as AMP-activated protein kinase (AMPK) and PGC-1α, both of which play critical roles in mitochondrial function, oxidative metabolism, and resistance to muscle atrophy[29]. SCFAs may also affect the systemic availability of energy substrates and muscle-related anabolic signals, thereby contributing to muscle maintenance. In brief, ingestion of live microbes can affect muscle function through microbial colonization, thereby affecting the gut microbiota. Although a substantial body of research has focused on the association between probiotics and gut microbiota, the long-term use of probiotic supplements remains limited in the general population. Consuming foods that are naturally rich in live microbes not only enhances the diversity of the gut microbiota, but also provides substrates to support their growth. In fact, compared to probiotic supplements, the dietary intake of live microbes through habitual foods may offer a more feasible approach for achieving sustained or even permanent colonization in the gut. As such, incorporating live microbe-rich foods into the diet may be a promising strategy for managing sarcopenia. However, the present study did not assess these metabolites and inflammatory markers, which precludes confirmation of the existence of these mechanisms.
Sarcopenia is controlled by many factors, including dietary intake of live microbes[30]. In addition to exploring the relationship between sarcopenia and live microbes, the present study assessed the correlation between sarcopenia and other influencing factors, thereby strengthening our results. High consumption of live microbes was found to be significantly associated with a lower risk of sarcopenia in individuals aged > 65 years. Although this association was not statistically significant in those under 65 years of age, the lack of any significant overall interaction indicates that the protective effect may still be broadly relevant but more easily detectable in older populations[31]. Furthermore, a significant decrease in the risk of sarcopenia was observed among non-overweight individuals, while this association was not statistically significant in the overweight and obese subgroups. This suggests that the metabolic burden associated with obesity may attenuate the beneficial effects of live microbes[32]. Interestingly, a higher prevalence of fatty liver was observed in individuals without sarcopenia, indicating the presence of a complex interplay in which fatty liver may diminish the benefits of live microbes via metabolic dysregulation, inflammation, or alterations in the gut-liver axis[33]. A stronger inverse association between live microbe intake and sarcopenia was found in individuals without diabetes than in those with diabetes, indicating that an individual’s metabolic health status affects the efficacy of interventions based on live microbes[34]. These findings highlight the potential interaction between metabolic health status and the efficacy of live microbe-based interventions in mitigating muscle loss. In individuals without diabetes, the intake of live microbes may have beneficial effects by reshaping the composition of the gut microbiota[35]. However, these pathways may be compromised in patients with diabetes. These findings suggest that the protective effects of live microbes against sarcopenia vary depending on an individual’s metabolic condition, highlighting the need for personalized strategies based on each individual’s metabolic profiles.
Our study has several noteworthy features. Firstly, we used a scientific sampling method and a validated assessment tool to improve the representativeness of the samples and the accuracy of the results. Further, this is the first study to investigate the association between the intake of live dietary microbes and sarcopenia in a Chinese population, and the second study to do so on a global scale. Therefore, it is important to study the relationship between live microbes, dietary habits, and sarcopenia development. However, this study has some limitations. First, due to the cross-sectional nature of this study, we could not establish a causal relationship between live microbial intake and the development of sarcopenia. Second, dietary data were collected using a 24-hour dietary recall method, which relies on memory and may therefore lead to recall bias or omissions, particularly among elderly participants. Third, our assessment of physical activity was categorized into only two levels, and did not distinguish between exercise types (e.g., resistance vs. aerobic exercise) or intensity, even though resistance exercise has been well-established a core factor directly related to muscle mass and sarcopenia prevention. The diabetic subgroup in the present study had a relatively small sample size, which may have limited the statistical power. Currently, the classification of live dietary microbes is still in the estimation stage, and precise quantitative analyses of foods containing live microbes are lacking. In addition, the survey questionnaire did not collect information on the use of anti-inflammatory drugs, which may be a potential confounding factor. Therefore, future studies should strengthen the accuracy of the assessment of live microbes and their intake to improve the scientific validity and reproducibility of our results.
-
In conclusion, based on data from a Chinese population and a classification system for live microbial content in Chinese foods, the present study indicated that individuals with a higher consumption of live microbes exhibit a lower risk of developing sarcopenia, suggesting a potential protective role of a high intake of dietary microbes in maintaining skeletal muscle health. These findings emphasize the importance of live microbe-rich foods in health education and highlight the need for further studies on their underlying mechanisms.
HTML
Study Design and Methodology
Ethics Approval and Consent to Participate
Data Collection
Collection of Blood Samples and Detection of Indicators
Measurement of Dietary Live Microbe Intake
Diagnosis of Sarcopenia
Covariates
Statistical Analysis
Clinical Characteristics of the Participants
Dietary Sources of Live Microbes
Association between Dietary Live Microbes and Sarcopenia
Subgroup Analysis and Interaction Analysis
Competing Interests The authors declare that they have no conflicts of interest.
Ethics This study was approved by the Ethics Committee of the Shanghai Center for Disease Control and Prevention (KY-2024-16). Informed consent was obtained from all participants before enrollment, and all procedures were conducted in accordance with the Declaration of Helsinki.
Authors’ Contributions X.S. contributed to the conceptualization, data curation, statistical analysis, original draft writing, and visualization. Z.W. was responsible for resources, writing, reviewing, and editing. J.W. participated in the conceptualization and methodology. W.L., Z.S., and L.S. were involved in data collection. C.S. and C.Y. conducted literature searches. G.S. supervised the study and contributed to the writing, review, and editing of the manuscript. J.Z. contributed to writing, reviewing, and editing the manuscript. X.X. was responsible for conceptualization, supervision, writing, review, and editing.
Data Sharing Owing to participant privacy regulations, we were unable to provide public access to individual-level data in accordance with the ethical guidelines. Additionally, the written informed consent obtained from the study participants did not include provisions for public data sharing. Qualified researchers can request access to the aggregated dataset upon reasonable request by contacting the corresponding author. The supplementary materials will be available in www.besjournal.com.
Consent for publication Not applicable.
&These authors contributed equally to this work.

 Quick Links
 DownLoad: