





-
Diabetic microvascular complications, including diabetic retinopathy, diabetic neuropathy, and diabetic kidney disease, impose a high economic burden on the global healthcare system and pose substantial challenges for individuals with type 2 diabetes (T2D). Therefore, early identification of high-risk individuals is essential for long-term diabetes management. Patients with T2D frequently exhibit metabolic disturbances, and insulin resistance (IR) plays a pivotal role in the pathophysiology of diabetic complications[1]. Recent evidence suggests that the triglyceride-glucose (TyG) index and its combination with adiposity indices (e.g., body mass index [BMI], waist circumference [WC], and waist-to-height ratio [WHtR]) are useful markers of IR[2].
Previous studies have reported that the TyG index is positively associated with the risk of diabetic retinopathy[3,4] and diabetic kidney disease[5,6]. However, findings have been inconsistent across studies[7] .Most previous studies were limited by small sample sizes and cross-sectional designs. Evidence regarding the association with diabetic neuropathy remains limited. Moreover, although general and abdominal obesity are associated with an increased risk of microvascular complications in diabetes, few studies have explored the relationship between obesity-related derivatives of the TyG index and diabetic microvascular complications[8]. To fill these knowledge gaps, we aimed to investigate the associations of TyG, TyG-BMI, TyG-WC, and TyG-WHtR with the risk of composite and individual microvascular complications in patients with T2D enrolled in the UK Biobank.
The UK Biobank is a large community-based prospective cohort study of common diseases in middle-aged and older adults, including more than 500,000 participants aged 37–73 years from 22 sites across England, Scotland, and Wales between March 2006 and October 2010. Extensive data were obtained through touchscreen questionnaires, physical measurements, and the collection of biological samples during recruitment. The specific methods for data collection have been previously described[9]. Patients with prevalent T2D at recruitment were identified using a UK Biobank algorithm based on self-reported physician-diagnosed diabetes, use of oral hypoglycemic medication or insulin, or HbA1c levels ≥ 6.5%[10], or through electronic health records (ICD-10 code: E11). For our analysis, we excluded participants with prevalent microvascular complications (n = 5,604) and those without triglyceride, blood glucose, waist circumference, or height measurements (n = 3,323). Consequently, 17,619 participants with T2D were eligible for inclusion in the analysis (Supplementary Figure S1).
A random peripheral venous blood sample was obtained from each participant at the baseline assessment, and biochemical measurements were performed using a Beckman Coulter AU5800 chemistry analyzer. Detailed methods and quality control procedures are available on the UK Biobank website (https://biobank.ndph.ox.ac.uk/showcase/refer.cgi?id=1227). Height, weight, and WC were measured by trained nurses, and three indicators (BMI, WC, and WHtR) were selected to represent general and central obesity in participants with T2D. Finally, four TyG-related indices, namely TyG, TyG-BMI, TyG-WC, and TyG-WHtR, were included in the current analysis[2].
The following equations were used to calculate the four indices above:
(1) TyG = Ln[TG (mg/dL)*glucose (mg/dL) / 2]
(2) TyG-BMI = Ln[TG (mg/dL) × glucose (mg/ dL) / 2] × [weight (kg) / height2 (m2)]
(3) TyG-WC = Ln[TG (mg/dL) × glucose (mg/dL) / 2] × WC (cm)
(4) TyG-WHtR = Ln[TG (mg/dL) × glucose (mg/dL) / 2] × [WC (cm)/height (cm)].
Diabetic retinopathy (ICD-10 codes: E113, E143, H280, H360), diabetic neuropathy (ICD-10 codes: E114, E144, G590, G629, G632, G990), and diabetic kidney disease (ICD-10 codes: E112, E142, N180, N181, N182, N183, N184, N185, N188, N189) were identified through linkage of the cohort database with hospital inpatient admissions and death registries. Linked health record data were available until December 31, 2021.
Information on age, sex, race, educational level, smoking status, drinking status, and leisure-time physical activity was collected using touchscreen questionnaires. The Townsend Deprivation Index (TDI) reflects socioeconomic status and is calculated using national census data according to participants' residential postal code. Smoking status was categorized as never, previous, or current. Drinking status was categorized as never, previous, or current alcohol consumption. Leisure-time physical activity was quantified as weekly metabolic equivalent of task minutes (MET-min/week) using the International Physical Activity Questionnaire-long form. Medical histories of hypertension, cardiovascular disease (CVD), and diabetes duration were ascertained using questionnaires, verbal interviews, and electronic health records. Medications for T2D, hypertension, and hyperlipidemia were ascertained through questionnaires and verbal interviews. The baseline characteristics according to quartiles of the TyG index and comparisons between the included and excluded participants are presented in Supplementary Tables S1 and S2.
Cox proportional hazards regression models were used to calculate hazard ratios (HRs) and 95% confidence intervals (CIs). Tests for linear trends were performed by including the median value of each quartile of the TyG-related indices as a continuous variable in the regression models. Missing values for continuous variables (0.2% for TDI, 1.5% for leisure-time physical activity, 4.4% for HbA1c level, and 4.9% for diabetes duration) were imputed using mean values, whereas missing values for categorical variables (0.9% for race, 2.4% for education level, 1.1% for smoking status, and 0.6% for drinking status) were imputed using the missing-indicator method. Three models were constructed for the analysis. In Model 1, we adjusted for age (continuous, years), sex (male, female), race (White, other), and the TDI (continuous). In Model 2, we additionally adjusted for educational level (college or university degree, other), smoking status (never, past, current), drinking status (never, past, current), leisure-time physical activity (continuous, MET-min/week), history of hypertension (yes, no), and history of CVD (yes, no). In Model 3, we further adjusted for diabetes duration (continuous, years), HbA1c (continuous, mmol/mol), use of diabetes medication (yes, no), use of antihypertensive medication (yes, no), and use of lipid-lowering medication (yes, no). To avoid overadjustment and multicollinearity, lipid fractions and obesity measures were not included in the models.
To evaluate the dose-response relationships, restricted cubic spline (RCS) models with knots placed at the 10th, 50th, and 90th percentiles of the TyG-related indices were fitted. If the RCS analysis indicated a nonlinear association, we estimated the inflection point for the association between the TyG-related indices and the risk of diabetic microvascular complications and evaluated the associations using a two-segment Cox proportional hazards model on either side of the inflection point. Following previous studies, the R package “segmented” was used to determine the inflection point based on likelihood ratio tests and bootstrap resampling.
Stratified analyses were conducted according to age, sex, race, educational level, diabetes duration, HbA1c level, use of diabetes medication, use of antihypertensive medication, use of lipid-lowering medication, history of hypertension, and history of CVD. Interactions between TyG-related indices and the stratification variables with respect to the risk of the study outcomes were examined using likelihood ratio tests by adding product terms to the multivariable-adjusted Cox models. We performed several sensitivity analyses to evaluate the robustness of our results. First, to minimize potential reverse causation, we excluded participants who developed outcomes within the first 2 years of follow-up. Second, we investigated the association between TyG-related indices and the risk of diabetic microvascular complications with additional adjustment for the estimated glomerular filtration rate (eGFR), a marker of kidney function. All statistical analysis were performed using SAS V.9.4 (SAS Institute Inc., Cary, NC, USA) and R version 4.0.2 (R Foundation for Statistical Computing, Vienna, Austria). Statistical significance was defined as a two-sided P < 0.05.
Among 17,619 participants with T2D, 61.8% were men, and the mean age ± standard deviation was (59.1 ± 7.3) years. During a total of 201,213 person-years of follow-up (median 12.4 years; interquartile range 11.5 to 13.3 years; maximum 14.7 years), 3,327 (18.9%) participants developed composite microvascular complications, including 1,484 (8.4%) diabetic retinopathy, 701 (4.0%) diabetic neuropathy, and 1,819 (10.3%) with diabetic kidney disease. After adjusting for potential confounders, compared with participants in the lowest quartile of each TyG-related index, those in the highest quartile had HRs (95% CIs) of 1.48 (1.34, 1.63) for the TyG index, 1.60 (1.44, 1.77) for the TyG-BMI index, 1.56 (1.41, 1.73) for the TyG-WC index, and 1.61 (1.45, 1.78) for the TyG-WHtR index for composite diabetic microvascular complications (Table 1). Tests for trend indicated significant associations between all TyG-related indices and outcomes (all P for trend < 0.001). Overall, TyG-WHtR showed the strongest association with composite microvascular complications, followed by TyG-BMI and TyG-WC, whereas all four indices showed consistent positive associations with the outcome.
HR (95% CIs) Cases/person-years Model 1 Model 2 Model 3 TyG index Q1 681/50,600 Reference Reference Reference Q2 817/50,635 1.18 (1.06−1.30) 1.17 (1.05−1.29) 1.21 (1.09−1.34) Q3 833/50,271 1.23 (1.11−1.36) 1.20 (1.09−1.33) 1.23 (1.11−1.36) Q4 996/49,708 1.57 (1.42−1.73) 1.55 (1.40−1.71) 1.48 (1.34−1.63) P for trend < 0.001 < 0.001 < 0.001 Per 1 unit increase 1.26 (1.21−1.33) 1.26 (1.20−1.32) 1.22 (1.17−1.28) TyG-BMI index Q1 691/50,568 Reference Reference Reference Q2 782/50,533 1.10 (0.99−1.22) 1.06 (0.96−1.18) 1.13 (1.01−1.25) Q3 843/50,455 1.23 (1.11−1.36) 1.16 (1.05−1.28) 1.21 (1.09−1.34) Q4 1,011/49,637 1.68 (1.52−1.86) 1.55 (1.40−1.71) 1.60 (1.44−1.77) P for trend < 0.001 < 0.001 < 0.001 Per 100 units increase 1.42 (1.34−1.50) 1.35 (1.27−1.43) 1.35 (1.28−1.43) TyG-WC index Q1 688/51,003 Reference Reference Reference Q2 766/50,853 1.07 (0.97−1.19) 1.03 (0.93−1.15) 1.07 (0.96−1.19) Q3 840/50,371 1.23 (1.11−1.36) 1.17 (1.05−1.29) 1.20 (1.08−1.33) Q4 1,033/48,987 1.69 (1.53−1.87) 1.56 (1.41−1.73) 1.56 (1.41−1.73) P for trend < 0.001 < 0.001 < 0.001 Per 100 units increase 1.15 (1.13−1.18) 1.13 (1.11−1.16) 1.12 (1.10−1.15) TyG-WHtR index Q1 661/51,072 Reference Reference Reference Q2 787/50,544 1.16 (1.04−1.28) 1.12 (1.01−1.24) 1.16 (1.05−1.29) Q3 824/50,513 1.22 (1.10−1.35) 1.16 (1.04−1.28) 1.20 (1.08−1.33) Q4 1,055/49,084 1.75 (1.58−1.93) 1.61 (1.46−1.78) 1.61 (1.45−1.78) P for trend < 0.001 < 0.001 < 0.001 Per 1 unit increase 1.27 (1.23−1.32) 1.23 (1.19−1.28) 1.22 (1.18−1.27) Note. Abbreviations: TyG, triglyceride-glucose index; WC, waist circumference; WHtR, waist-to-height ratio; TDI, Townsend Deprivation Index; CVD, cardiovascular disease; T2D, type 2 diabetes; HR, hazard ratio; CI, confidence interval. Model 1: Multivariable models adjusted for age, sex, race, and TDI. Model 2: Multivariable models adjusted for age, sex, race, TDI, education level, smoking status, drinking status, leisure-time physical activity, history of hypertension, and history of CVD. Model 3: Multivariable models were adjusted for age, sex, race, TDI, education level, smoking status, drinking status, leisure-time physical activity, history of hypertension, history of CVD, HbA1c, diabetes duration, and use of diabetes medication, antihypertensive medication, and lipid-lowering medication. Table 1. Associations between TyG-related indices and composite microvascular complications in individuals with T2D (n = 17,619)
For individual diabetic microvascular outcomes, positive associations were observed for all four TyG-related indices (Supplementary Tables S3–S5). In the fully adjusted model, the HRs (95% CIs) for the highest versus lowest quartile of TyG, TyG-BMI, TyG-WC, and TyG-WHtR were 1.49 (1.29, 1.72), 1.38 (1.19, 1.60), 1.35 (1.16, 1.58), and 1.45 (1.25, 1.68) for diabetic retinopathy; 2.05 (1.64, 2.58), 2.07 (1.64, 2.60), 2.29 (1.80, 2.90), and 1.94 (1.55, 2.44) for diabetic neuropathy; and 1.47 (1.28, 1.69), 1.74 (1.51, 2.01), 1.73 (1.49, 2.00), and 1.80 (1.56, 2.08) for diabetic kidney disease, respectively (all P for trend < 0.01). The estimated strongest association varied according to the outcome. TyG, TyG-WC, and TyG-WHtR yielded the largest estimated HRs for diabetic retinopathy, diabetic neuropathy, and diabetic kidney disease, respectively.
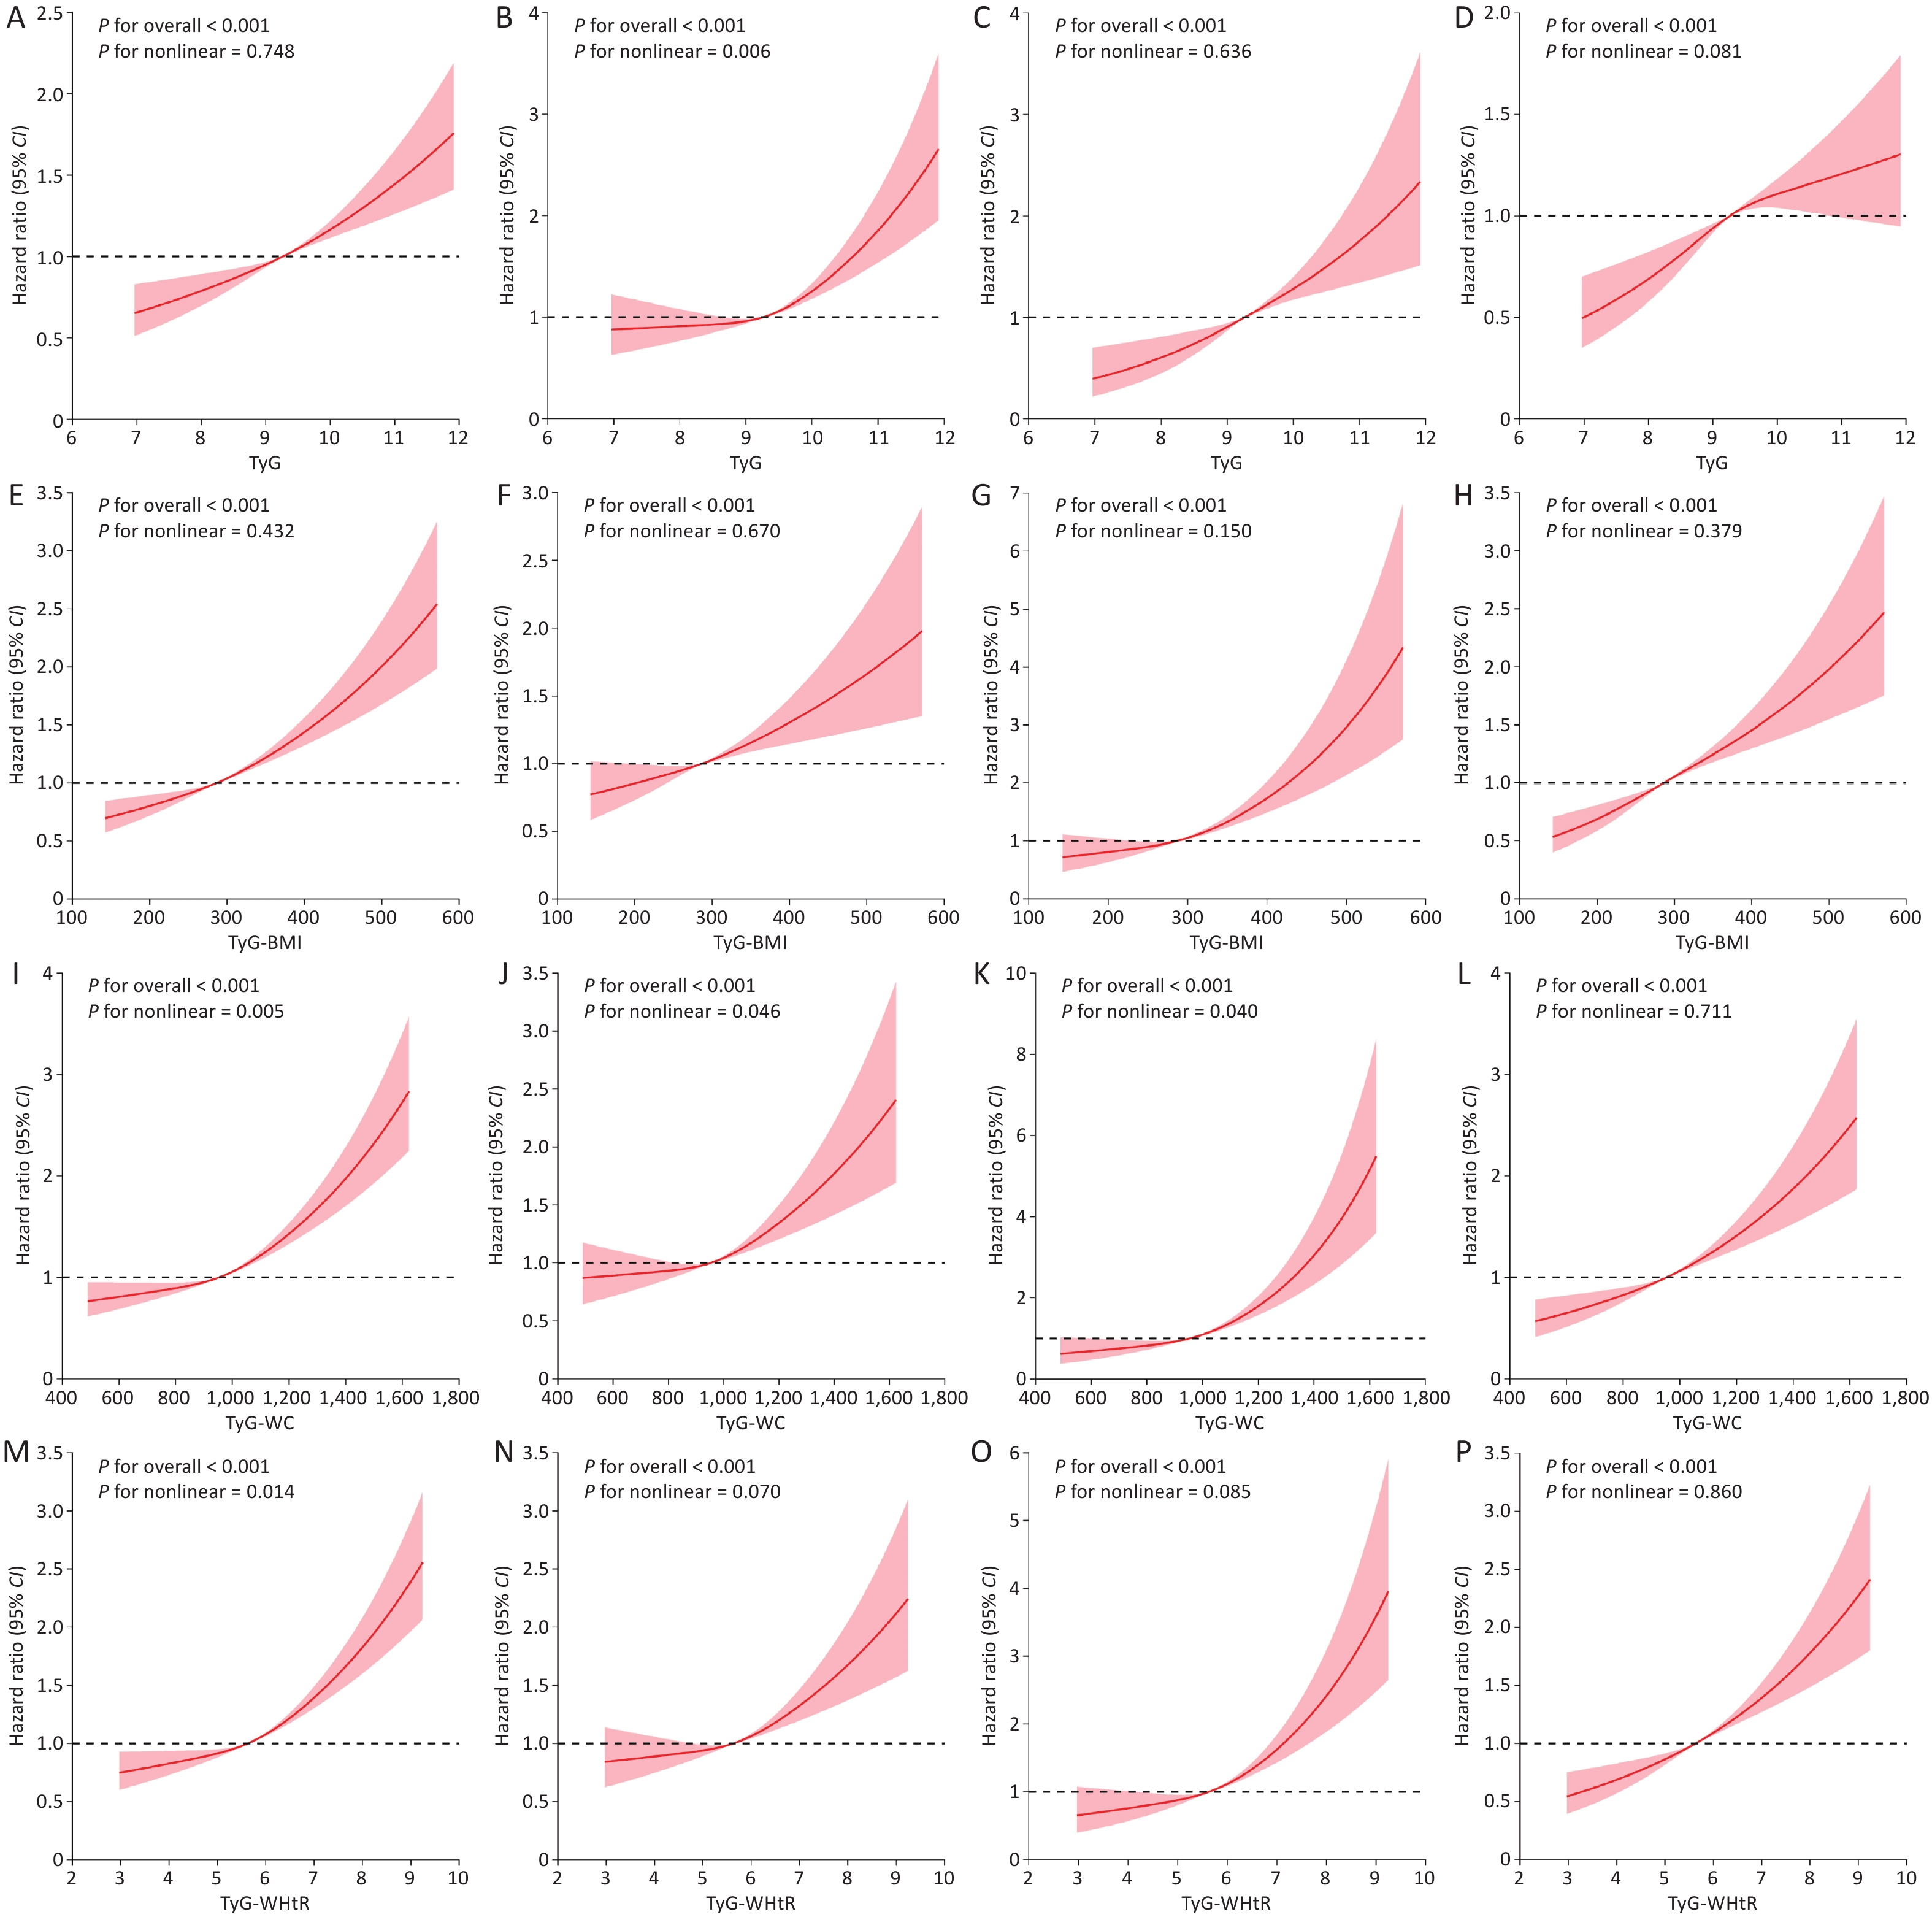
Dose-response analyses further supported the positive associations between TyG-related indices and microvascular complications (Figure 1). All four TyG-related indices were positively associated with the risk of all outcomes in a dose-response manner (all P for the overall association < 0.001). Nonlinear patterns were observed for the association of TyG with diabetic retinopathy, TyG-WC with composite microvascular complications, diabetic retinopathy, and diabetic neuropathy, and TyG-WHtR with composite microvascular complications (all P for nonlinearity < 0.05). In threshold analyses, TyG-WC was not significantly associated with composite microvascular complications or diabetic retinopathy below the estimated inflection points of 899.3 and 896.2, respectively. However, above these inflection points, the associations became significant, with adjusted HRs of 1.13 (1.10, 1.17) and 1.08 (1.03, 1.14), respectively.
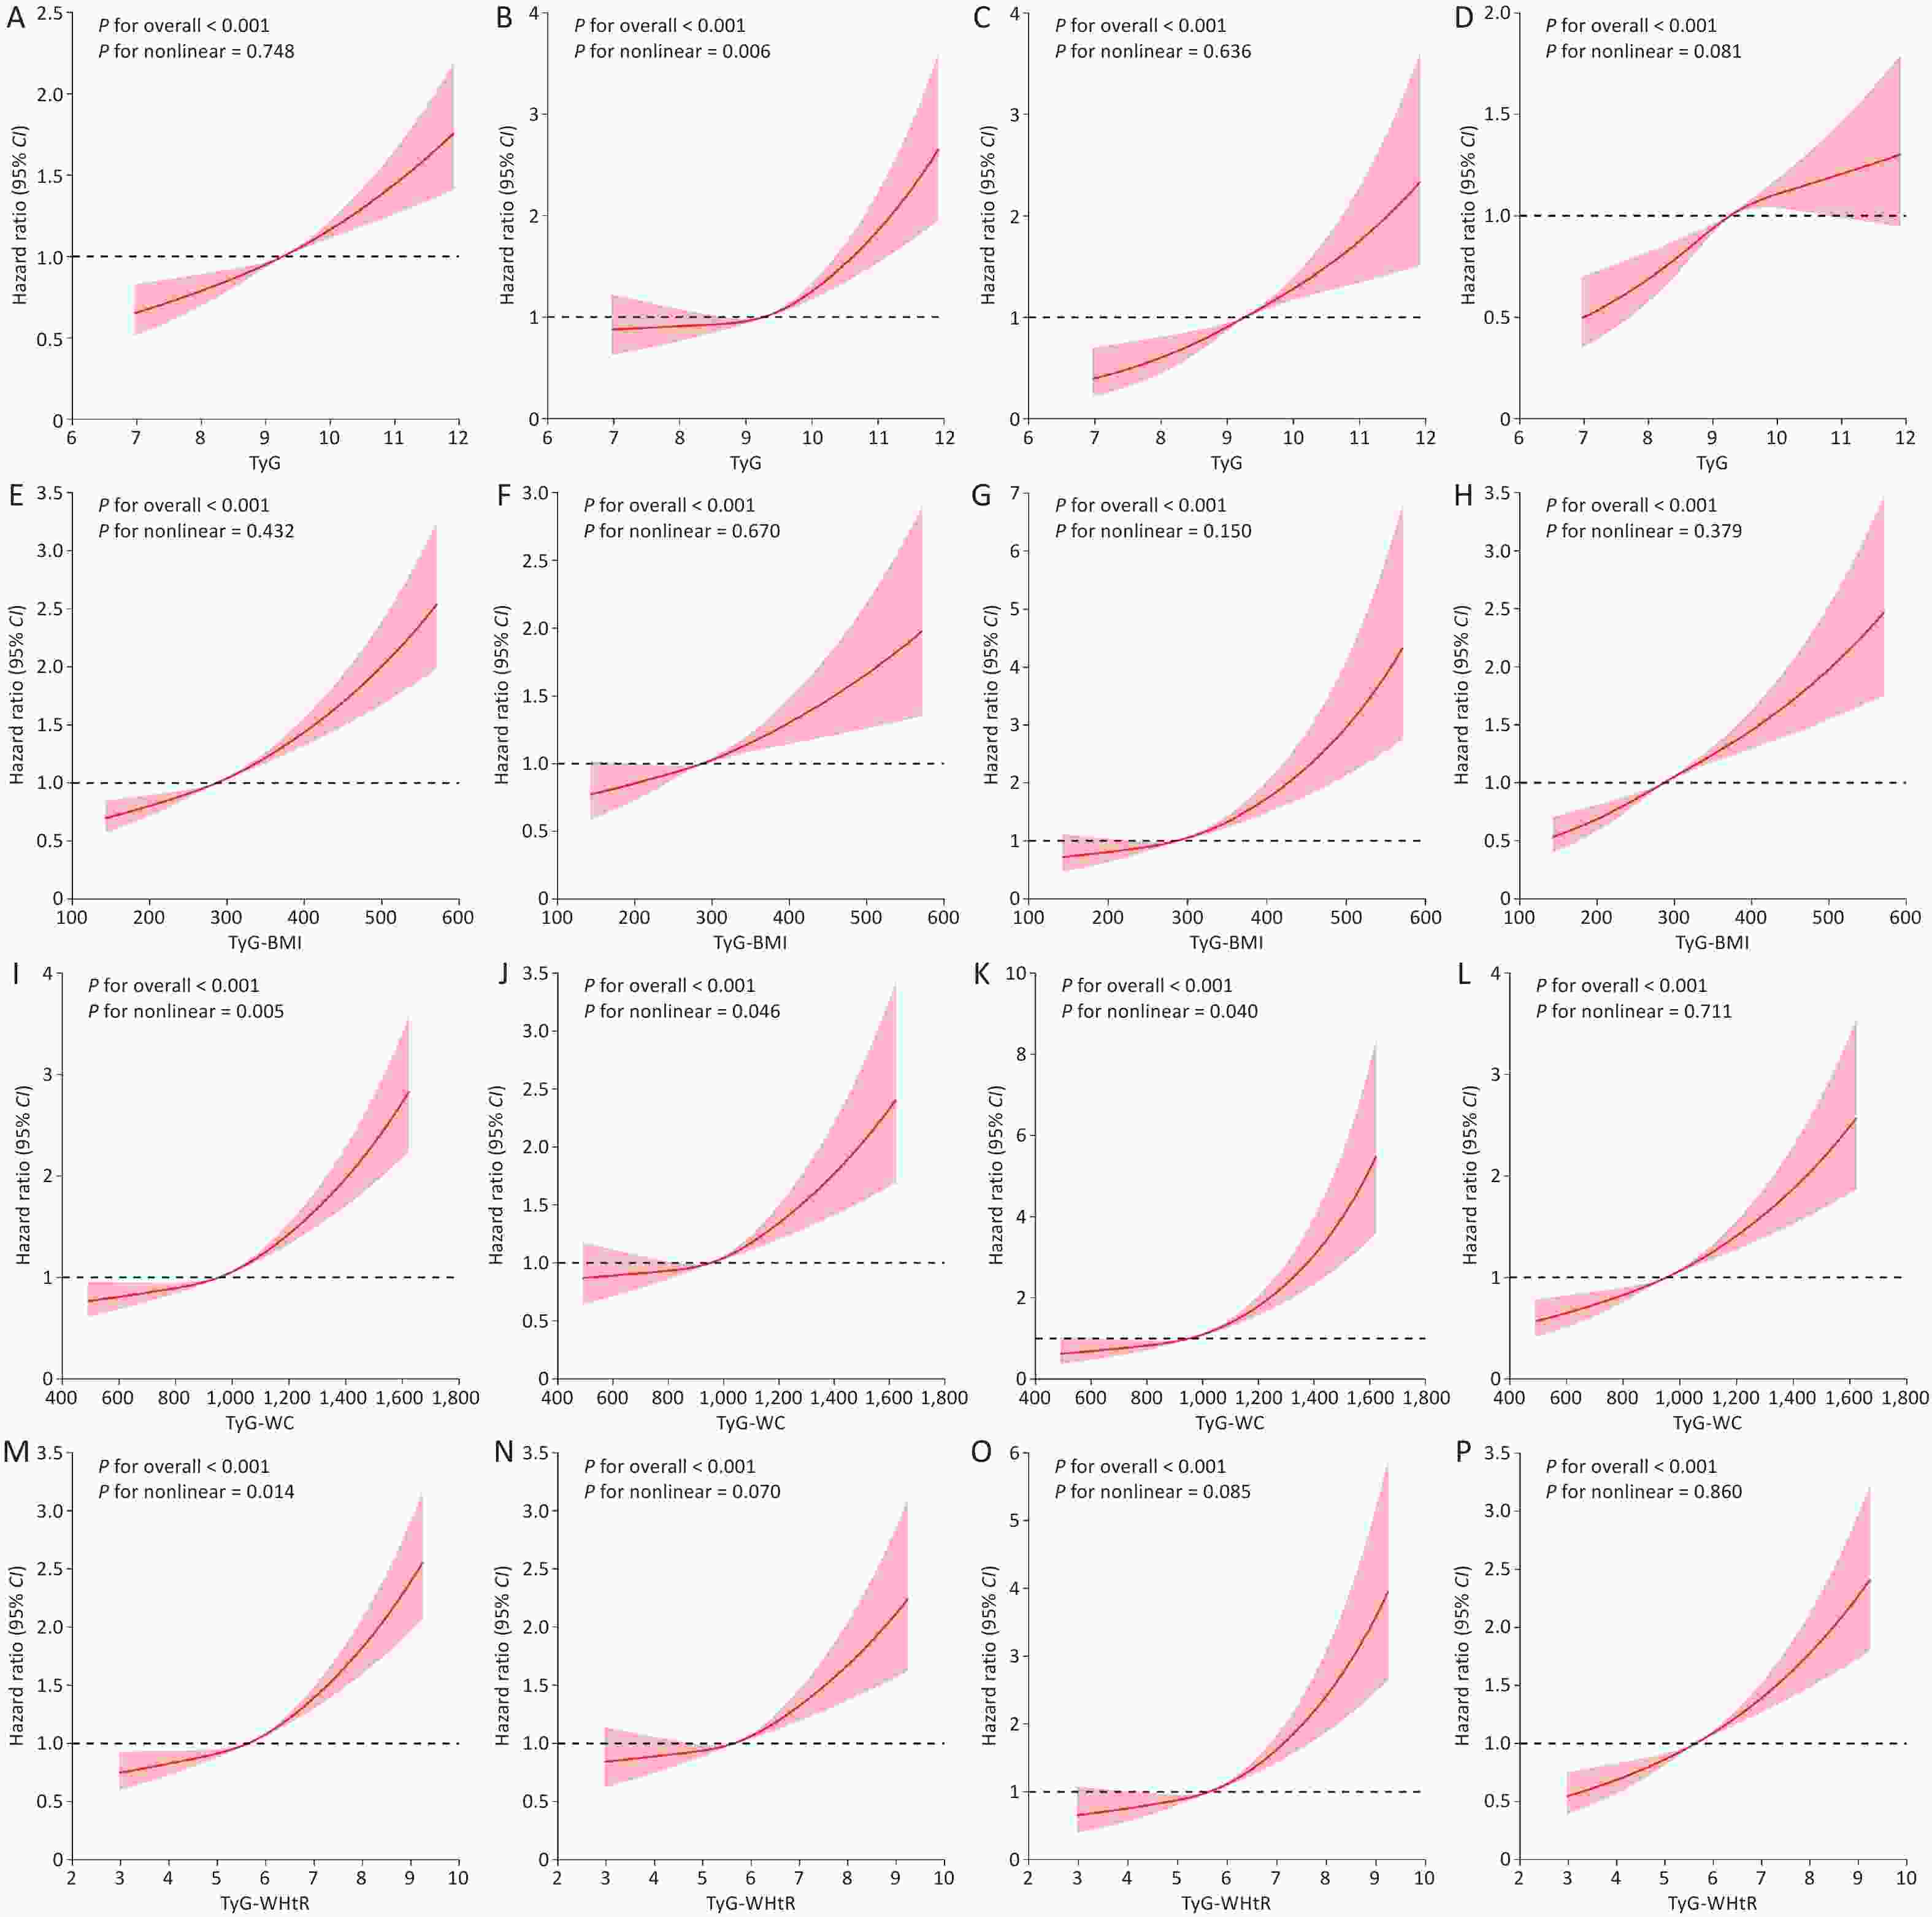
Figure 1. The restricted cubic spline of the associations between TyG-related indices and composite microvascular complications (A, E, I, M), diabetic retinopathy (B, F, J, N), diabetic neuropathy (C, G, K, O) and diabetic kidney disease (D, H, L, P). The multivariable models were adjusted for age, sex, race, TDI, education level, smoking status, drinking status, leisure-time physical activity, history of hypertension, history of CVD, HbA1c, diabetes duration, use of diabetes medication, use of antihypertensive medication, use of lipid-lowering medication. Abbreviations: TyG, triglyceride glucose index; TDI, Townsend Deprivation Index; CVD, cardiovascular disease.
The associations between TyG-related indices and composite microvascular complications were generally consistent in subgroup analyses stratified by sex, race, diabetes duration, HbA1c level, and use of glucose-lowering medications (Supplementary Tables S6–S9). The results remained robust after excluding participants who developed outcomes within the first two years of follow-up (Supplementary Tables S10–S13) and after additional adjustment for eGFR (Supplementary Tables S14–S17).
Our study adds to the existing evidence on the association of TyG-related indices with the risk of diabetic microvascular complications. To date, only a handful of studies have evaluated the relationship between the TyG index and the risk of diabetic microvascular complications. Most previous studies were limited by cross-sectional design, relatively short follow-up periods, and relatively small sample sizes. Moreover, previous studies have yielded inconsistent results. The large prospective cohort design and long duration of follow-up strengthen the validity of our findings. Additionally, our results showed significant associations between TyG-related indices and diabetic neuropathy, as well as composite diabetic microvascular complications, outcomes that have been investigated less frequently[3,7].
TyG index HR (95% CI) P Outcome: diabetic retinopathy Model 1 Fitting model by standard linear regression 1.27 (1.18−1.36) < 0.001 Model 2 Fitting model by two-piecewise linear regression Inflection point 10.294 <10.294 1.17 (1.06−1.28) 0.001 ≥10.294 1.77 (1.20−2.62) 0.004 P for likelihood test 0.002 TyG-WC HR (95% CI)† P Outcome: composite microvascular complications Model 1 Fitting model by standard linear regression 1.12 (1.10−1.15) < 0.001 Model 2 Fitting model by two-piecewise linear regression Inflection point 899.3 <899.3 1.05 (0.97−1.14) 0.208 ≥899.3 1.13 (1.10−1.17) < 0.001 P for likelihood test 0.022 Outcome: diabetic retinopathy Model 1 Fitting model by standard linear regression 1.09 (1.06−1.13) < 0.001 Model 2 Fitting model by two-piecewise linear regression Inflection point 896.2 <896.2 0.99 (0.89−1.11) 0.926 ≥896.2 1.08 (1.03−1.14) 0.003 P for likelihood test 0.108 Outcome: diabetic neuropathy Model 1 Fitting model by standard linear regression 1.23 (1.18−1.29) < 0.001 Model 2 Fitting model by two-piecewise linear regression Inflection point 1026.7 <1026.7 1.13 (1.01−1.26) 0.029 ≥1026.7 1.30 (1.19−1.43) < 0.001 P for likelihood test 0.095 TyG-WHtR HR (95% CI) P Outcome: composite microvascular complications Model 1 Fitting model by standard linear regression 1.22 (1.18−1.27) < 0.001 Model 2 Fitting model by two-piecewise linear regression Inflection point 5.7 <5.7 1.13 (1.02−1.25) 0.02 ≥5.7 1.25 (1.17−1.35) < 0.001 P for likelihood test 0.035 Note. Abbreviations: TyG, triglyceride glucose index; WC, waist circumference; WHtR, waist-to-height ratio; TDI, Townsend Deprivation Index; CVD, cardiovascular disease; T2D, type 2 diabetes; HR, hazard ratio; CI, confidence interval. Multivariable models were adjusted for age, sex, race, TDI, education level, smoking status, drinking status, leisure-time physical activity, history of hypertension, history of CVD, HbA1c level, diabetes duration, use of diabetes medication, use of antihypertensive medication, and use of lipid-lowering medication. † The data shows the HRs for TyG-WC per 100 units increment. Table 2. Threshold effects of TyG-related indices on microvascular complications in participants with T2D
Furthermore, our results demonstrate associations of TyG-WC and TyG-WHtR with composite and individual microvascular complications in patients with T2D. To our knowledge, our study is the first to report a potential threshold effect of TyG-WC showing that TyG-WC was not significantly associated with composite microvascular complications or diabetic retinopathy below the inflection point. These results suggest that lower WC may, to some degree, attenuate the association between an increased TyG index and the risk of microvascular complications among patients with T2D.
Several potential mechanisms may explain the association between TyG-related indices and microvascular complications in patients with T2D. First, the TyG index is derived from glucose and triglyceride levels; therefore, it reflects the status of glucose metabolism and hyperlipidemia, both of which are associated with the risk of diabetic microvascular complications. Moreover, as a surrogate marker of IR, the TyG index may be associated with adverse effects mediated by inflammation, oxidative stress, reduced NO production, mitochondrial damage, and vascular endothelial dysfunction. Abdominal obesity contributes to insulin resistance and inflammation. When combined with obesity-related indices such as BMI, WC, and WHtR, these indices may provide a more comprehensive assessment of risk by reflecting both central obesity and its metabolic consequences.
The strengths of this study include its large sample size, long follow-up period, and extensive collection of clinical and demographic data, which allowed us to comprehensively evaluate the associations between TyG-related indices and diabetic microvascular complications. Despite its strengths, this study should be interpreted in light of its limitations. First, as microvascular complications were identified via hospital inpatient records and death registries, there may have been an underreporting of cases. Second, measurements of TG and random glucose were available only at baseline; therefore, within-subject biological variability in these measurements could not be accounted for. In addition, information on lifestyle behaviors was collected at recruitment, and these behaviors may change over time; hence, the observed associations might be attenuated owing to non-differential misclassification bias. Third, our study was limited in terms of ethnic diversity (> 85% of participants were White); therefore, our results may not be directly generalizable to other ethnic groups. Finally, detailed information on glucose-lowering treatment intensity, medication adherence, quality of diabetes management, and healthcare utilization was not fully available. Therefore, although we adjusted for a broad range of covariates, residual confounding due to disease severity or differences in medical surveillance cannot be completely excluded.
In conclusion, our findings suggest that the TyG index and its combination with adiposity indices, including TyG-BMI, TyG-WC, and TyG-WHtR, are positively associated with the risk of diabetic microvascular complications. In addition, no significant association was observed between TyG-WC and composite microvascular complications or diabetic retinopathy when TyG-WC was below the corresponding inflection point. These findings suggest that TyG-related indices may help identify individuals with T2D who are at increased risk of developing microvascular complications. Further studies are required to validate these findings and determine whether improving insulin resistance, lipid metabolism, and adiposity can reduce the burden of diabetic microvascular complications.
HTML
Competing Interests The authors declare that they have no competing interests.
Ethics Ethical approval for the UK Biobank study was granted by the North West Research Ethics Committee (06/MRE08/65), and all participants provided informed consent.
Authors’ Contributions Conceptualization: Xufang Sun and Xi Chen; data analysis: Xi Chen and Yuhe Tan; literature search: Xi Chen and Mingzhu Yuan; manuscript drafting: Xi Chen and Yuhe Tan; supervision and project management: Xufang Sun and An Pan; Funding acquisition: Xufang Sun and Xi Chen; resources: Hao Wang, An Pan; review and editing: Hao Wang and Tingting Geng. All authors reviewed the results and approved the final version of the manuscript.
Data Sharing Data from UK Biobank are available at www.ukbiobank.ac.uk/register-apply. This research was conducted using the UK Biobank Resource under Application Number 88159. Supplementary materials are available at www.besjournal.com.
&These authors contributed equally to this work.
Reference

 Quick Links
 DownLoad: