
-
Per- and polyfluoroalkyl substances (PFAS) are synthetic chemicals widely used in industrial applications and consumer products[1]. Their persistence and bioaccumulation have raised health concerns, with associations reported for metabolic disorders, cancer, cognitive impairment, impaired fetal growth, and dose-response or threshold-related effects[2]. Therefore, accurate assessment of serum PFAS concentrations is important for exposure surveillance and risk evaluation. Human biomonitoring programs, including Human Biomonitoring for Europe, Australian Human Biomonitoring, and the National Health and Nutrition Examination Survey (NHANES), have measured PFAS in biological matrices. However, routine serum testing is costly and time-consuming. Predictive models based on major exposure sources such as diet and indoor dust may provide practical alternatives.
Previous studies predicting PFAS concentrations have focused primarily on dietary factors. Consumption of fish and red meat, both rich in fatty acids (FAs), has been associated with higher serum PFAS concentrations[3]. Our previous work showed that circulating FAs improved PFAS prediction[4], suggesting that FAs may reflect co-exposure patterns and have potential mechanistic relevance. However, few studies have jointly evaluated dietary and circulating FAs. Given the structural similarities between FAs and PFAS and the binding of PFAS to liver fatty acid-binding protein[5,6], we integrated NHANES data, machine-learning models, and molecular docking to identify key dietary and serum FA predictors of eight PFAS compounds and total PFAS concentrations.
The NHANES is a nationally representative survey conducted by the U.S. Centers for Disease Control and Prevention to assess the health and nutritional status of the U.S. general population through interviews, physical examinations, and biospecimen analysis. Eight continuous NHANES cycles from January 2003 to March 2020 were used. Dietary data and serum PFAS measurements were available across all included cycles, whereas serum FAs were measured only in 2011–2012 and 2013–2014; therefore, analyses involving circulating FAs were restricted to this period. Participants were classified into three analytical groups according to the predictors used for PFAS prediction: dietary FAs, circulating FAs, and combined dietary and circulating FAs. After excluding participants with inconsistent food/FA definitions, missing serum PFAS measurements, or missing covariates, 10,135, 787, and 752 participants were included in the Dietary FA, Circulating FA, and Combined FA groups, respectively (Supplementary Figure S1). The present study was therefore conducted as a secondary analysis of data from a previously approved study, without requiring additional institutional review board approval from the authors’ institutions.
Dietary intake was assessed using two 24-hour dietary recalls, and the mean intake of the two recalls was used. Nineteen dietary FAs were derived from individual food files based on the U.S. Department of Agriculture Food and Nutrient Database for Dietary Studies. Serum FA and PFAS measurements were obtained from NHANES laboratory files as secondary data. Seven PFAS congeners consistently assessed across the cycles were selected, including perfluorodecanoic acid (PFDA), perfluorohexane sulfonic acid (PFHxS), 2-(N-methylperfluoroctanesulfonamido)acetic acid (N-MeFOSA-Ac), perfluorononanoic acid (PFNA), perfluoroundecanoic acid (PFUnDA), perfluorooctanoic acid (PFOA), and perfluorooctanesulfonic acid (PFOS). The monomethyl branched isomer of PFOS (Sm-PFOS) was additionally included because of its high detection rate (> 98%), and the total PFAS was calculated as the sum of available PFAS concentrations. Values below the limit of detection were imputed as LOD/√2. Covariates were selected based on previous studies and data availability[7,8], including age, gender, body mass index, race/ethnicity, survey cycle, smoking, alcohol use, education, family income-to-poverty ratio, marital status, and metabolic equivalent.
Participant characteristics were summarized as mean (standard deviation), median (interquartile range), or counts and percentages. Dietary FA intake, serum FA concentrations, and PFAS levels were log-transformed prior to analysis. Geometric means, geometric standard deviations, and percentile distributions of the FAs were calculated. The analytic framework is shown in Supplementary Figure S2. First, Spearman’s correlation analysis was used to screen the food groups associated with PFAS. Secondly, generalized linear models were used to compare the predictive performance of saturated, monounsaturated, and polyunsaturated FAs using R2 and partial R2. Third, four predictor strategies (SFAs, PUFAs, SFAs+PUFAs, and all FAs) were evaluated using multiple linear regression: Lasso, Ridge, random forest, XGBoost, and LightGBM. Data were split into training and testing sets in an 8:2 ratio, the hyperparameters were tuned by five-fold cross-validation, and performance was evaluated using R2, mean absolute error, and root mean square error. Additionally, Model calibration was assessed for the tree-based models using predicted-versus-observed calibration plots. Fourth, SHapley Additive exPlanations (SHAP) were used to quantify FA importance. Because the model performance varied across PFAS congeners, the SHAP values from random forest, XGBoost, and LightGBM were aggregated using an R2-standardized weighting scheme, with weights estimated separately for each PFAS outcome. The predominant FAs were defined as those ranked in the top one-third of the weighted SHAP values. Analyses were performed using R 4.3.3, with two-sided P < 0.05 considered statistically significant, and PFAS survey weights were applied. As this was an exploratory prediction study, P-value adjustment was not applied to the predictor selection.
Molecular docking was used to explore LFABP-related biological plausibility for FA-based PFAS prediction. Three simulations were performed: PFAS–LFABP docking to assess the affinity of PFAS for LFABP, PFAS–FA docking to evaluate potential modification binding, and FA–LFABP docking to assess potential competitive binding. The docking results were interpreted as hypothesis generation rather than mechanistic proof. All simulations used AutoDock Vina following a previously described protocol[9]. More detailed settings for these methods are provided in Text S1.
We analyzed 10,135 participants in the dietary FA group, 787 in the circulating FA group, and 752 in the combined FA group (mean age 47–49 years; ~49% male; mean body mass index (BMI) ~29 kg/m2; predominantly non-Hispanic white, never or light drinkers, and nonsmokers; Supplementary Table S1). C18:1 was the most abundant dietary FA (median 24.96 g), and C18:2n-6 was the most abundant serum FA (median 3,600 µmol/L; Supplementary Table S2).
Dietary intake is the primary route of PFAS exposure, and Spearman analysis showed that FA-rich foods were broadly correlated with serum PFAS; cheese and total protein foods were correlated with all nine PFAS congeners, and meat, cured meat, seafood, and solid fats were correlated with most congeners (Supplementary Figure S3). Because these foods are rich in FAs—including meat and dairy (saturated fats) and seafood (PUFAs)—these associations are consistent with previous dietary studies. Consumption of aquatic products has likewise been linked to higher serum PFAS concentrations. Collectively, these findings indicate FAs as promising predictors of PFAS exposure, with differing dietary patterns and exposure levels.
Across the six machine learning (ML) models, tree-based models consistently outperformed linear models. XGBoost and LightGBM achieved the highest R2 and lowest Mean Absolute Error (MAE) / Root Mean Squared Error (RMSE), with the best performance observed for Sm-PFOS in the combined group (SFA + PUFA: R2 = 0.508), followed by PFOS in the dietary (R2 = 0.430), PFOA (SFA: R2 = 0.396), and PFUnDA (PUFA: R2 = 0.392) groups (Supplementary Table S3). Calibration plots confirmed overall agreement between predicted and observed values, with a wider dispersion for low-R2 congeners (Supplementary Figures S4 and S5). The combined SFA and PUFA dataset outperformed the full FA set for most predictions. The limited contribution of MUFA likely reflects both its few measured species and their structural and metabolic redundancy with PUFAs, which provides little independent information. The superiority of the tree-based models, especially LightGBM, likely reflects their ability to capture nonlinear FA–PFAS relationships and feature interactions while applying built-in regularization, corroborating our previous findings in pregnant women. Mechanistically, saturated FAs may promote cellular lipid accumulation that facilitates PFAS sequestration, whereas PUFAs reduce it through a PPARγ-dependent pathway, consistent with their distinct predictive behavior.
SHAP analysis was used to identify key predictors of PFAS concentrations based on the RF, XGBoost, and LightGBM models, which outperformed the linear models. As shown in Supplementary Figure S6, the most important dietary FAs from the dietary group for PFAS prediction were consistently selected by the RF, XGBoost, and LightGBM models based on the dietary FA group. Similarly, stable FA contributors were identified in the circulating and combined FA groups across all three models (Supplementary Figures S7 and S8).
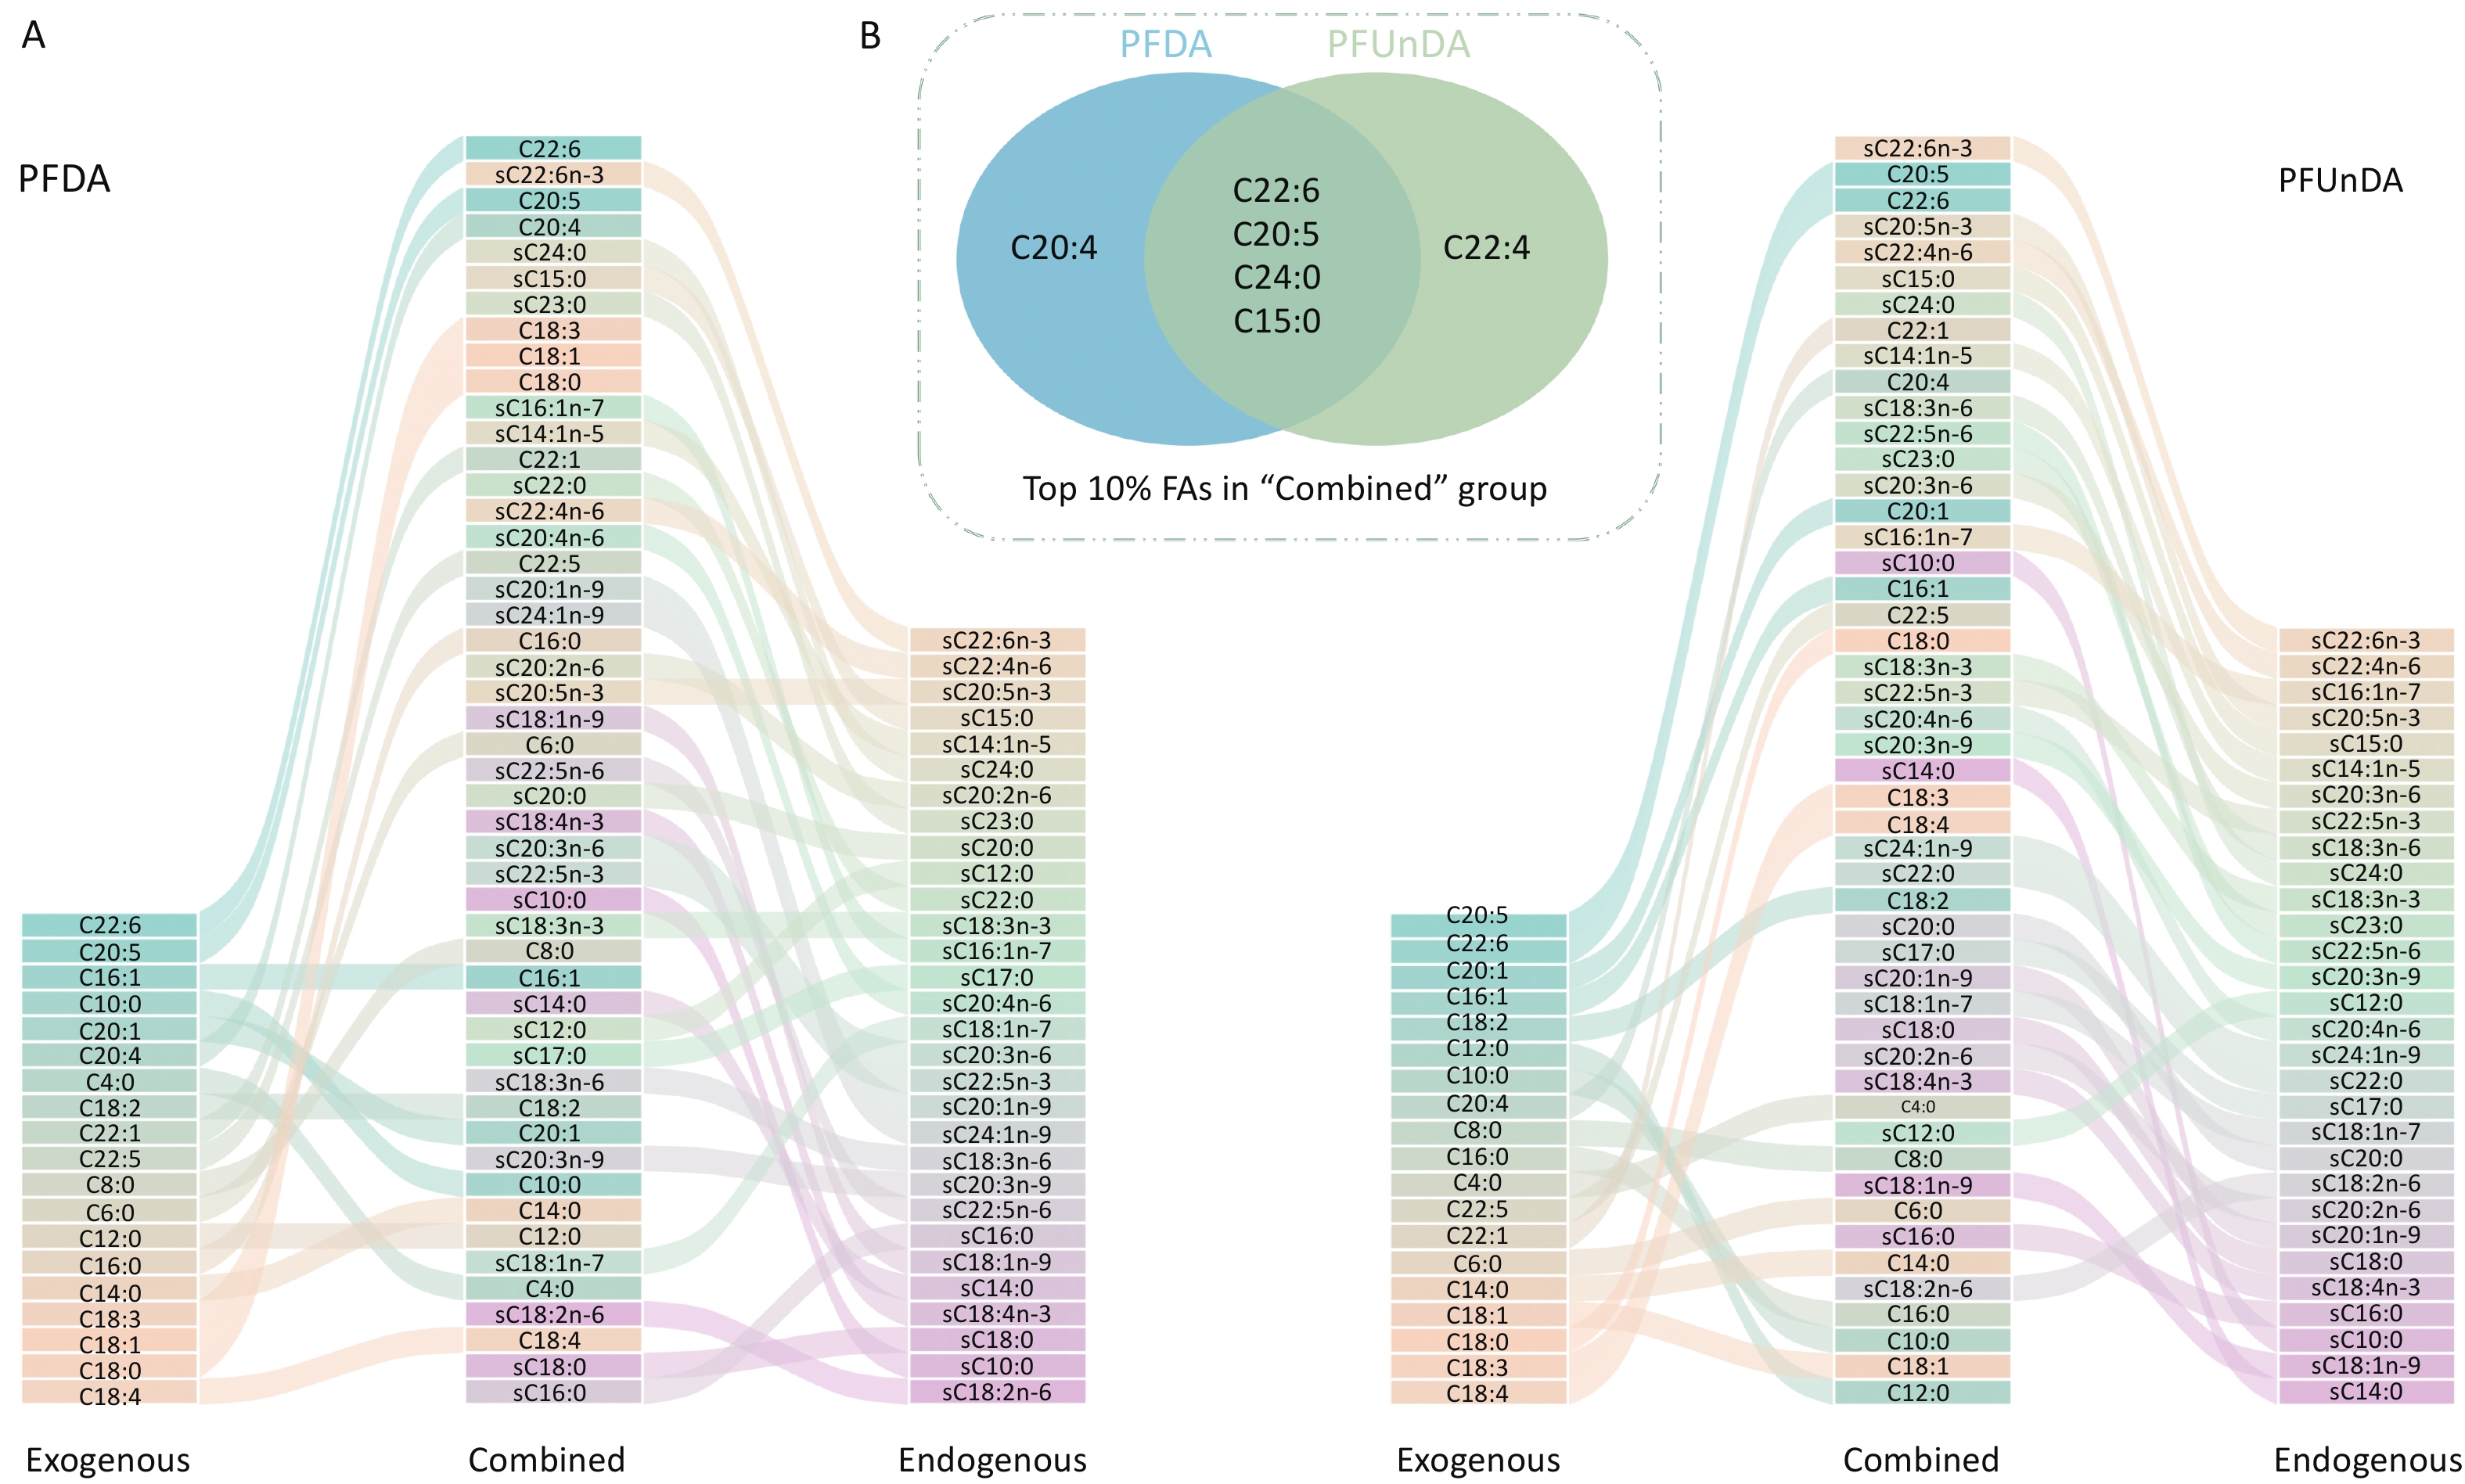
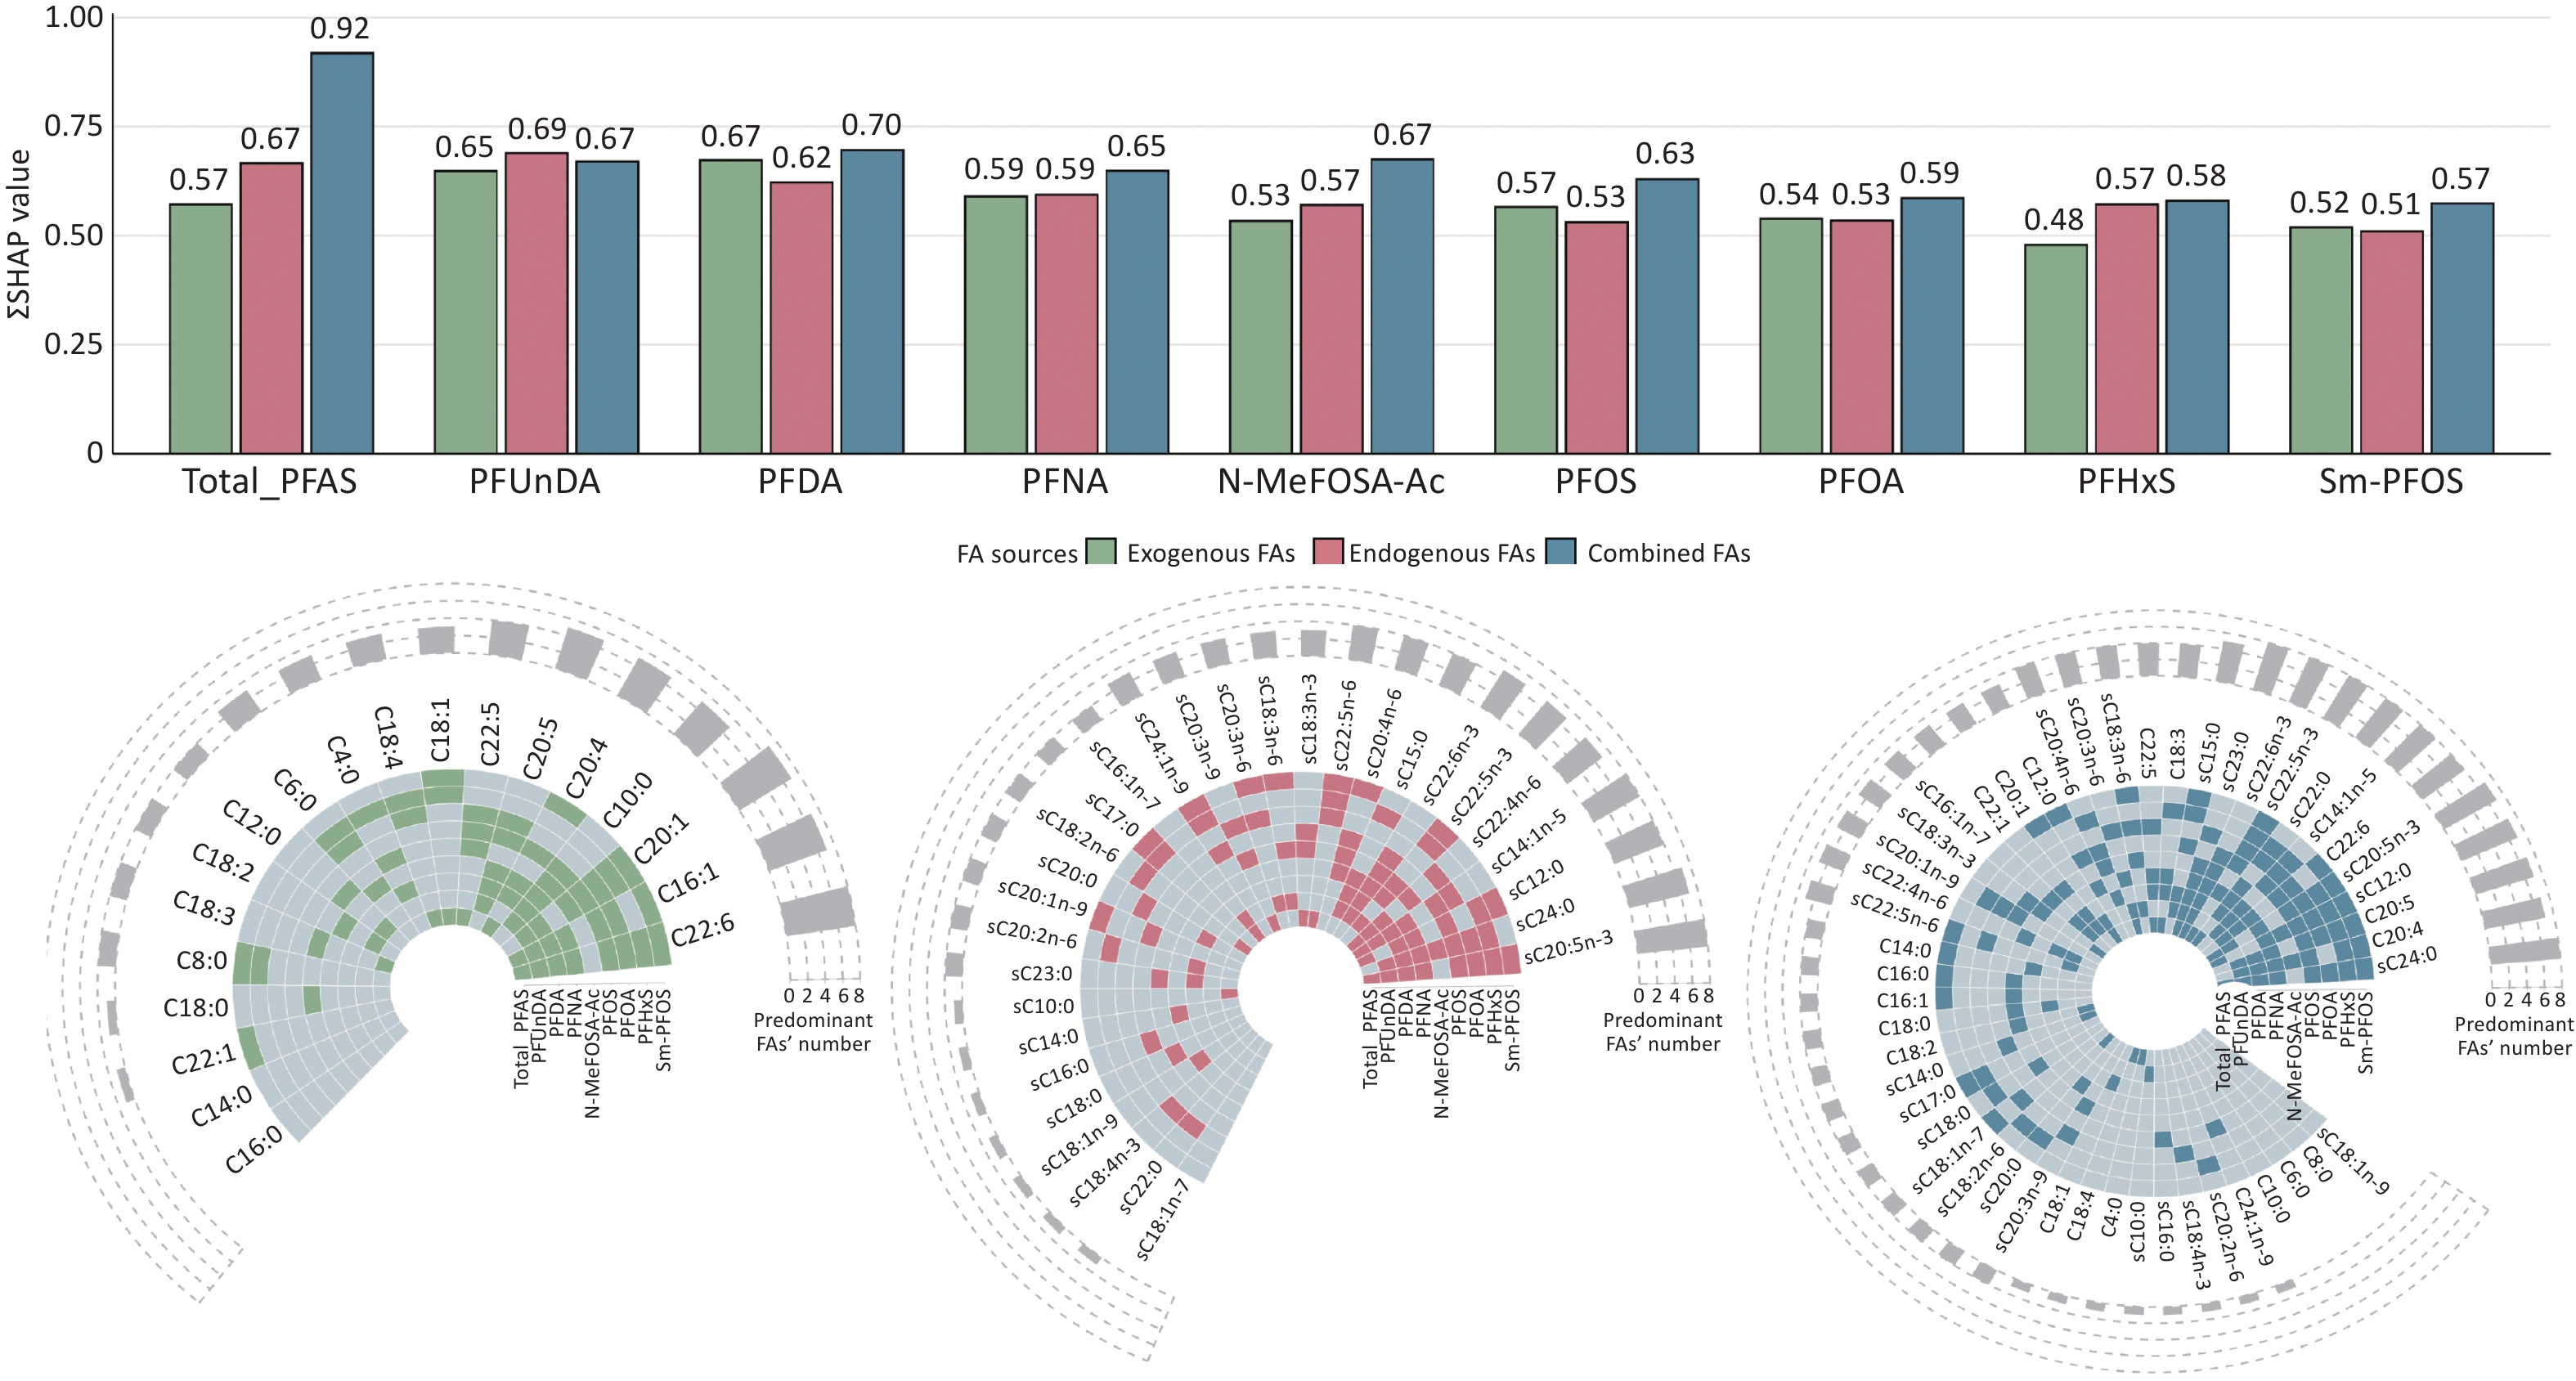
Variable importance analysis using weighted SHAP, which integrates SHAP values with model performance across RF, XGBoost, and LightGBM, consistently prioritized omega-3 FAs: dietary C22:6 and C20:5 and serum C20:5n-3, C24:0, and C22:6n-3 (Supplementary Figure S9 and Table S4). Defining predominant FAs as the top one-third per congener, C22:6 was predominant in eight of nine PFAS in the dietary group, and C20:5n-3 was predominant in the circulating group (Figure 1). Predominant FAs integrating both sources explained prediction better than a single source, best for total PFAS (ΣSHAP = 0.92 vs. 0.57 for dietary-only and 0.67 for circulating-only), indicating that jointly considering dietary and circulating FAs yields a more representative prediction. Because the three FA groups differed in sample size, period, and available predictors, these between-group differences should be interpreted as descriptive rather than formal head-to-head comparisons. For the two best-represented congeners, PFDA and PFUnDA, dietary and serum FAs contributed comparably, with serum C22:6n-3, C24:0, and C15:0, and dietary C22:6 and C20:5 as key factors (Figure 2). Detailed information regarding the other PFAS is provided in Supplementary Figures S10 and S11 demonstrate the significant positive correlations of PFDA and PFUnDA with C22:6, C20:5, and C24:0.
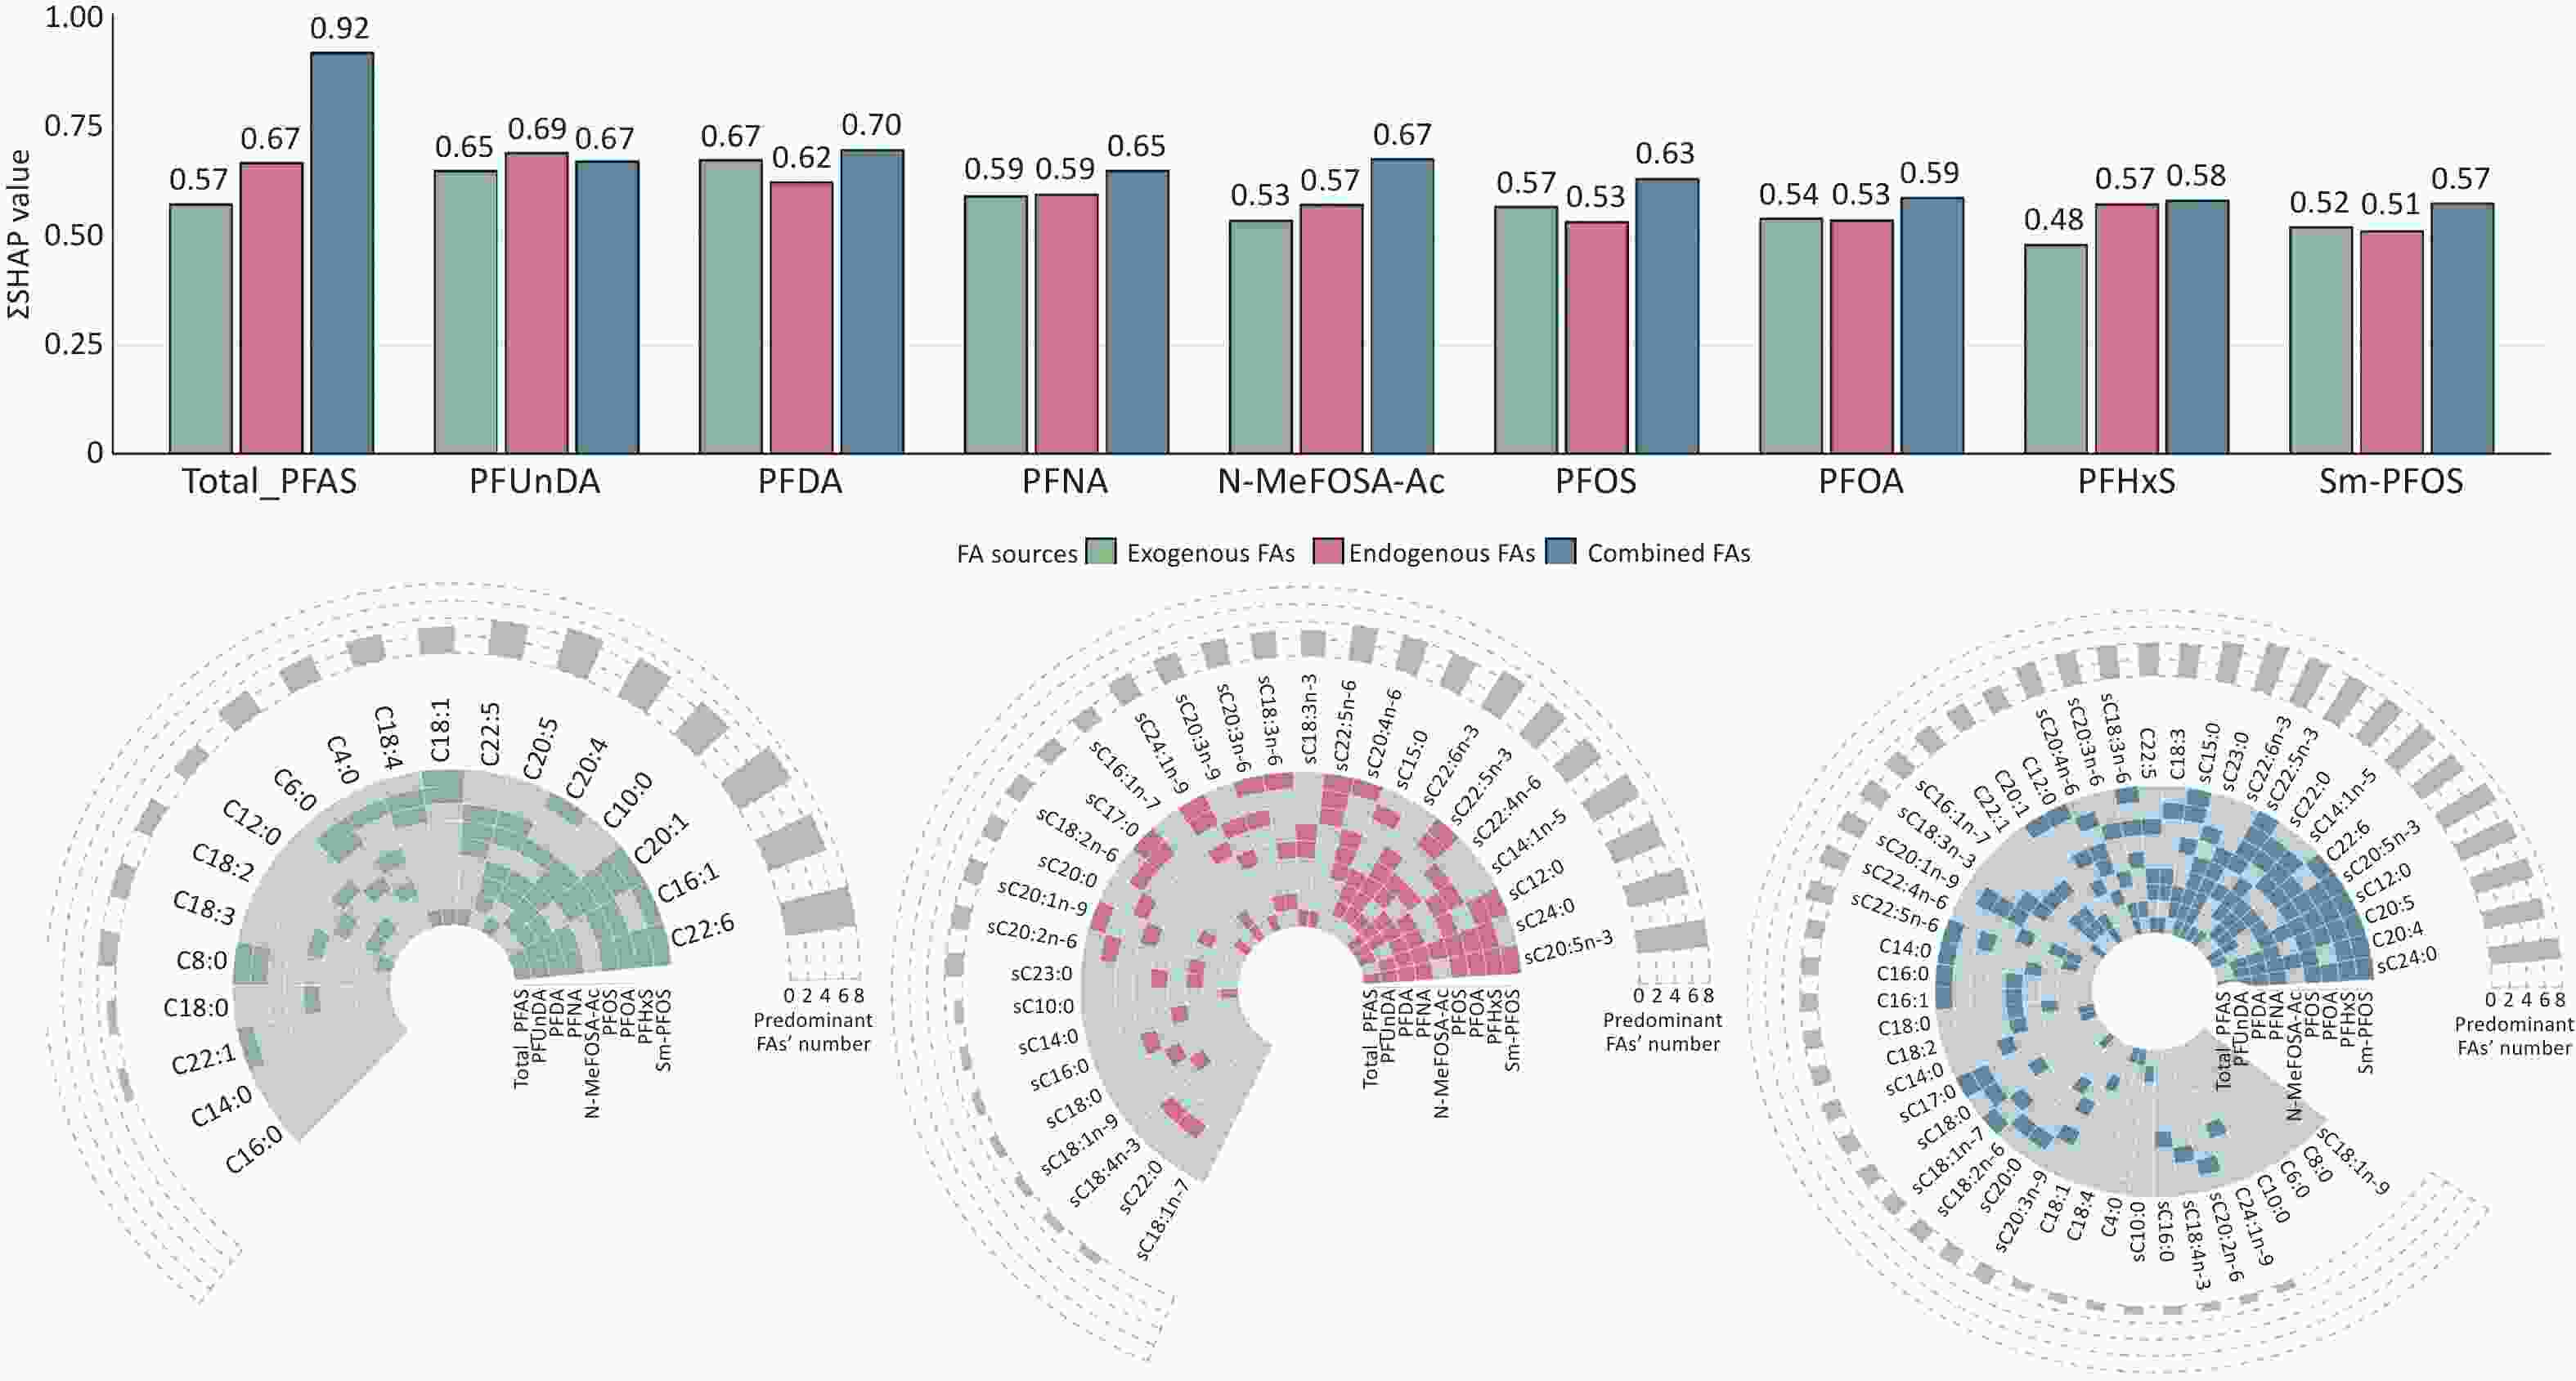
Figure 1. Contribution and overlap of predominant FAs in predicting PFAS concentrations. Predominant FAs are defined as those with weighted SHAP values ranking in the top one-third across PFAS in different groups. The top bar plot illustrates the summed weighted SHAP values of predominant FAs derived from different PFAS and FA sources (dietary, circulating, and combined). The three circular heatmaps below illustrate these predominant FAs categorized by FA source. Within each circular heatmap, the inner rings highlight the predominant FAs (indicated by darker-colored cells) associated with each PFAS. The outermost ring represents the total number of PFAS groups in which each FA was classified as predominant across all studied PFAS. FA, fatty acid; PFAS, per- and polyfluoroalkyl substances; Total_PFAS, total per- and polyfluoroalkyl substances; SHAP, SHapley Additive exPlanations; ΣSHAP, summed SHapley Additive exPlanations; PFUnDA, perfluoroundecanoic acid; PFDA, perfluorodecanoic acid; PFNA, perfluorononanoic acid; N-MeFOSA-Ac, 2-(N-methylperfluorooctanesulfonamido)acetic acid; PFOS, perfluorooctane sulfonic acid; PFOA, perfluorooctanoic acid; PFHxS, perfluorohexane sulfonic acid; Sm-PFOS, monomethyl branched isomer of perfluorooctane sulfonic acid; C4:0, butyric acid; C6:0, caproic acid; C8:0, caprylic acid; C10:0, capric acid; C12:0, lauric acid; C14:0, myristic acid; C16:0, palmitic acid; C18:0, stearic acid; C16:1, palmitoleic acid; C18:1, oleic acid; C20:1, eicosenoic acid; C22:1, erucic acid; C18:2, linoleic acid; C18:3, alpha-linolenic acid; C18:4, stearidonic acid; C20:4, arachidonic acid; C20:5, eicosapentaenoic acid; C22:5, docosapentaenoic acid; C22:6, docosahexaenoic acid; sC10:0, serum capric acid; sC12:0, serum lauric acid; sC14:0, serum myristic acid; sC15:0, serum pentadecanoic acid; sC16:0, serum palmitic acid; sC17:0, serum margaric acid; sC18:0, serum stearic acid; sC20:0, serum arachidic acid; sC22:0, serum docosanoic acid; sC23:0, serum tricosanoic acid; sC24:0, serum lignoceric acid; sC14:1n-5, serum myristoleic acid; sC16:1n-7, serum palmitoleic acid; sC18:1n-7, serum cis-vaccenic acid; sC18:1n-9, serum oleic acid; sC20:1n-9, serum eicosenoic acid; sC24:1n-9, serum nervonic acid; sC18:2n-6, serum linoleic acid; sC18:3n-3, serum alpha-linolenic acid; sC18:3n-6, serum gamma-linolenic acid; sC18:4n-3, serum stearidonic acid; sC20:2n-6, serum eicosadienoic acid; sC20:3n-6, serum homo-gamma-linolenic acid; sC20:3n-9, serum eicosatrienoic acid; sC20:4n-6, serum arachidonic acid; sC20:5n-3, serum eicosapentaenoic acid; sC22:4n-6, serum docosatetraenoic acid; sC22:5n-3, serum docosapentaenoic acid; sC22:5n-6, serum docosapentaenoic acid; sC22:6n-3, serum docosahexaenoic acid.
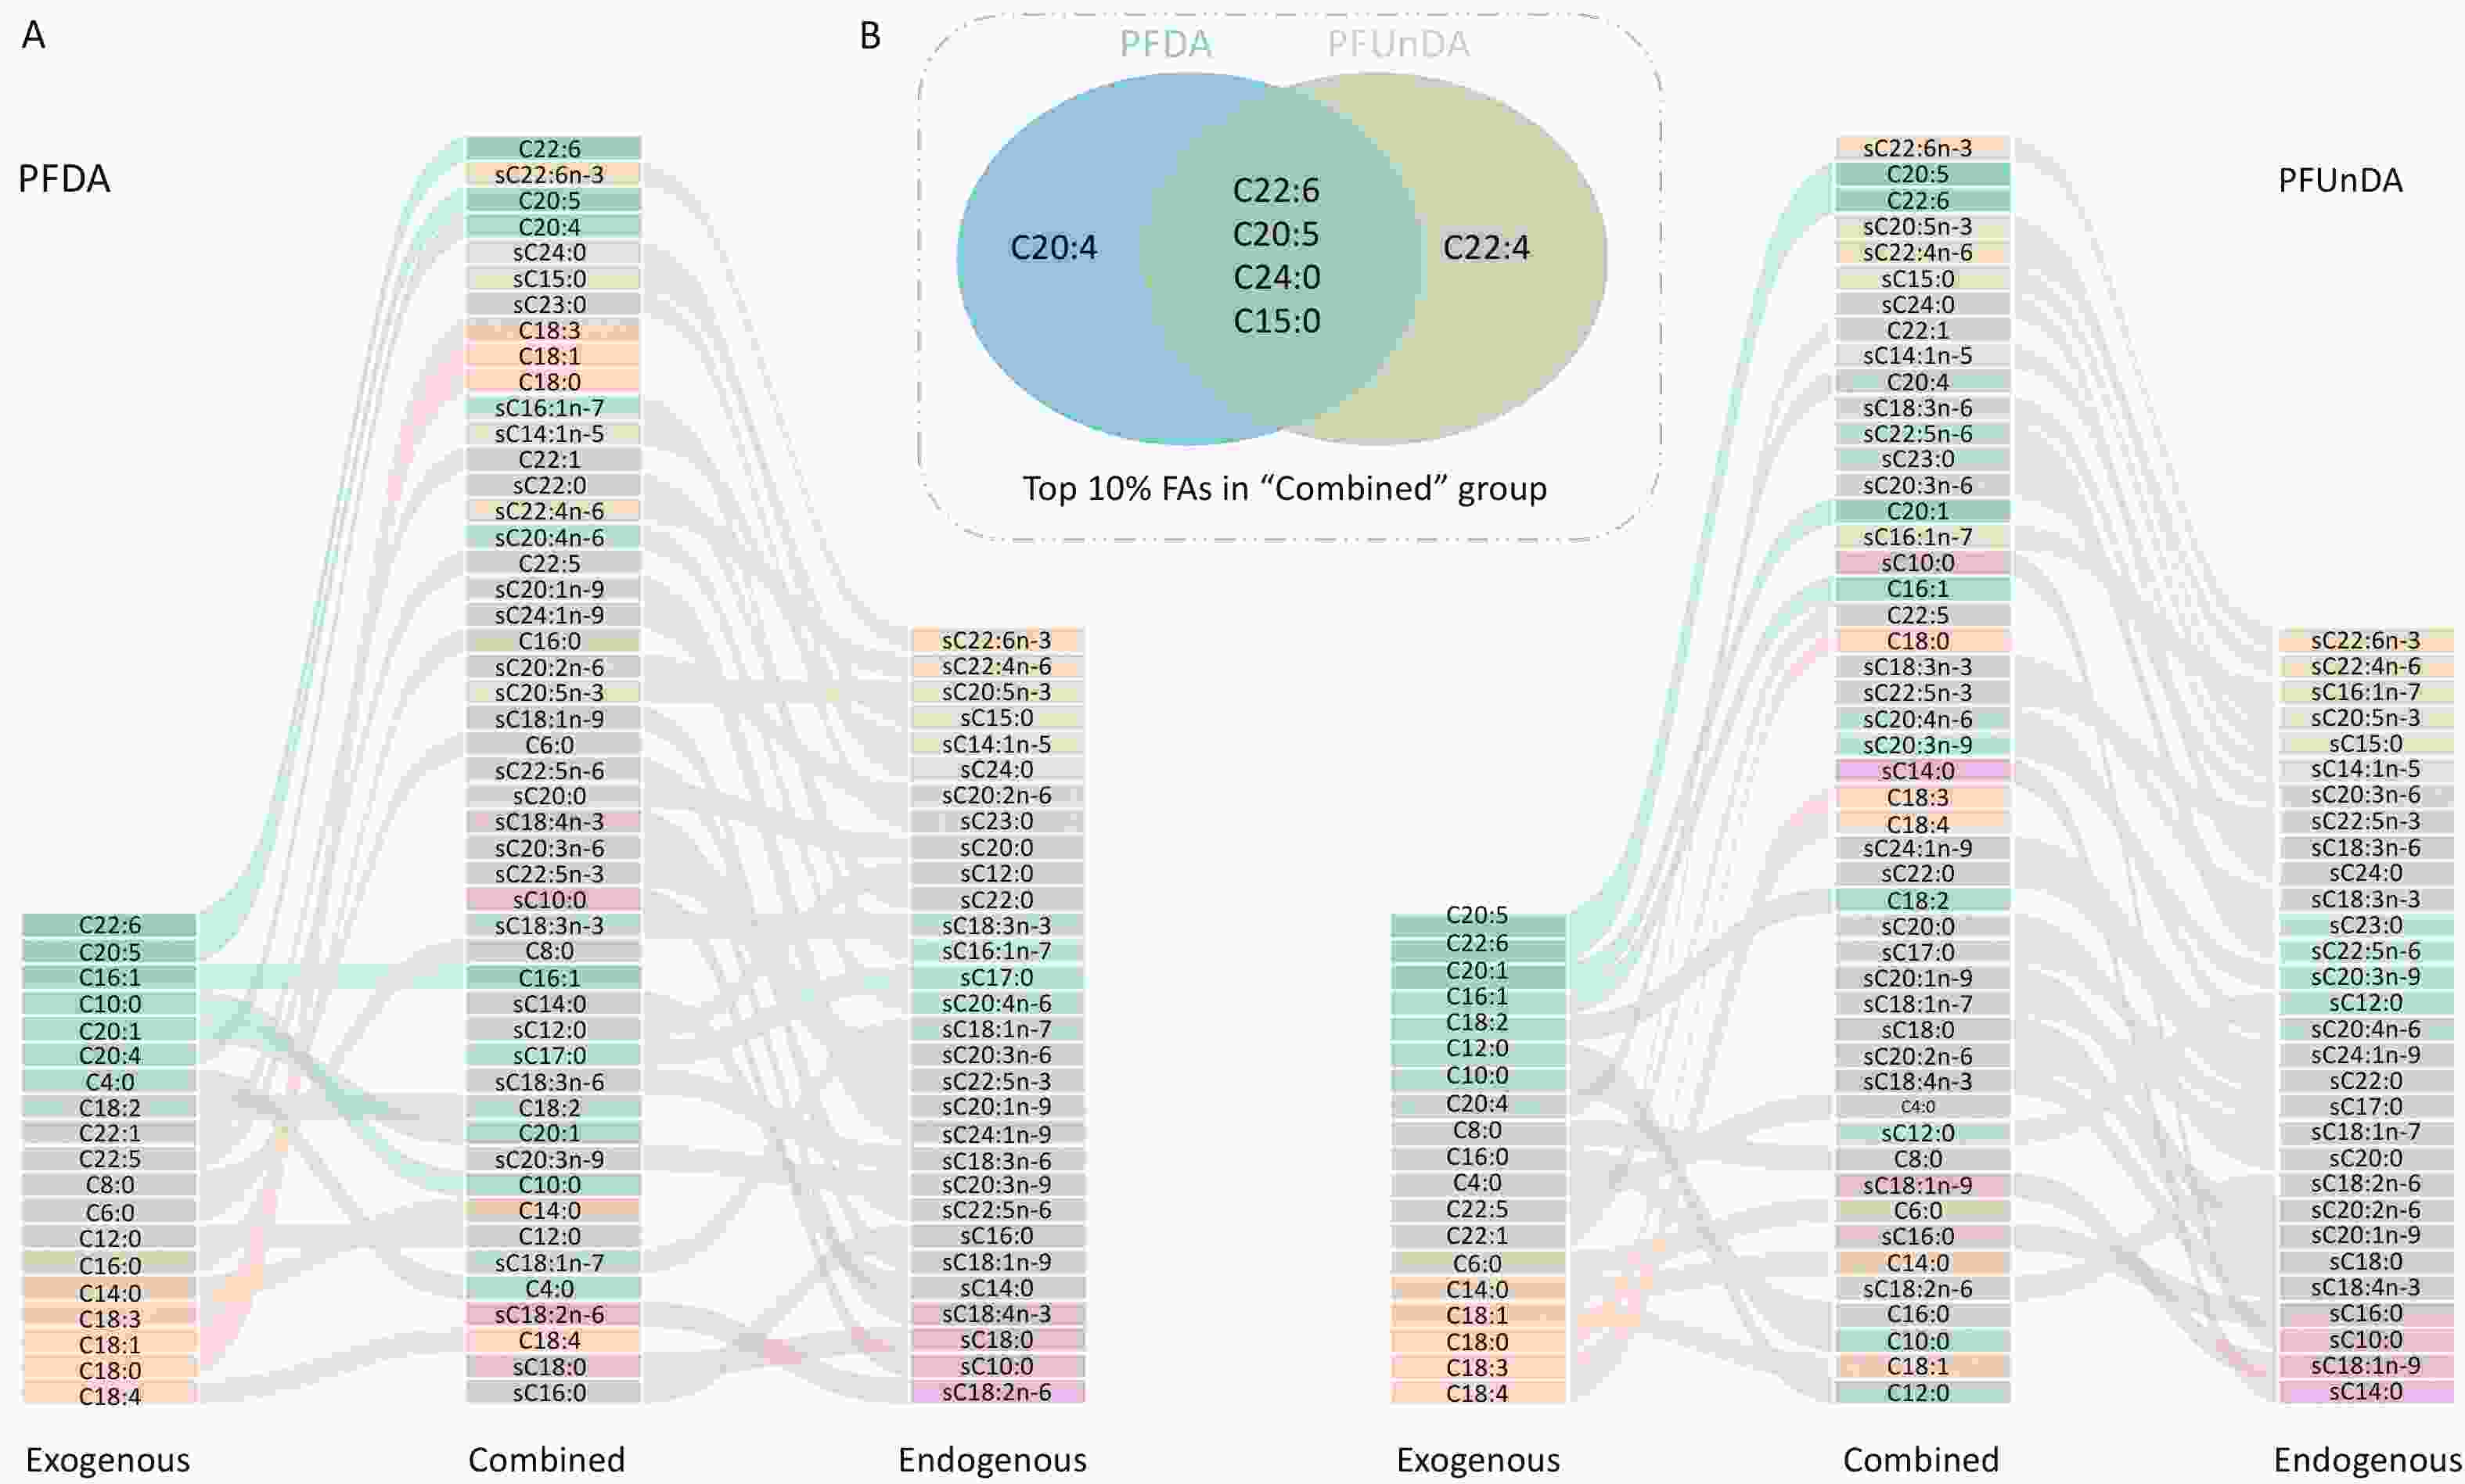
Figure 2. Results of (a) variable importance prioritization of dietary, circulating, and combined FA groups in predicting PFAS, and (b) top 10% FAs in predicting PFDA and PFUnDA within the combined FA group. Streamlines indicate changes in the FA rankings across different groups. FA, fatty acid; PFAS, per- and polyfluoroalkyl substances; PFDA, perfluorodecanoic acid; PFUnDA, perfluoroundecanoic acid; C4:0, butyric acid; C6:0, caproic acid; C8:0, caprylic acid; C10:0, capric acid; C12:0, lauric acid; C14:0, myristic acid; C15:0, pentadecanoic acid; C16:0, palmitic acid; C18:0, stearic acid; C16:1, palmitoleic acid; C18:1, oleic acid; C20:1, eicosenoic acid; C22:1, erucic acid; C18:2, linoleic acid; C18:3, alpha-linolenic acid; C18:4, stearidonic acid; C20:4, arachidonic acid; C20:5, eicosapentaenoic acid; C22:4, docosatetraenoic acid; C22:5, docosapentaenoic acid; C22:6, docosahexaenoic acid; C24:0, lignoceric acid; sC10:0, serum capric acid; sC12:0, serum lauric acid; sC14:0, serum myristic acid; sC15:0, serum pentadecanoic acid; sC16:0, serum palmitic acid; sC17:0, serum margaric acid; sC18:0, serum stearic acid; sC20:0, serum arachidic acid; sC22:0, serum docosanoic acid; sC23:0, serum tricosanoic acid; sC24:0, serum lignoceric acid; sC14:1n-5, serum myristoleic acid; sC16:1n-7, serum palmitoleic acid; sC18:1n-7, serum cis-vaccenic acid; sC18:1n-9, serum oleic acid; sC20:1n-9, serum eicosenoic acid; sC24:1n-9, serum nervonic acid; sC18:2n-6, serum linoleic acid; sC18:3n-3, serum alpha-linolenic acid; sC18:3n-6, serum gamma-linolenic acid; sC18:4n-3, serum stearidonic acid; sC20:2n-6, serum eicosadienoic acid; sC20:3n-6, serum homo-gamma-linolenic acid; sC20:3n-9, serum eicosatrienoic acid; sC20:4n-6, serum arachidonic acid; sC20:5n-3, serum eicosapentaenoic acid; sC22:4n-6, serum docosatetraenoic acid; sC22:5n-3, serum docosapentaenoic acid; sC22:5n-6, serum docosapentaenoic acid; sC22:6n-3, serum docosahexaenoic acid.
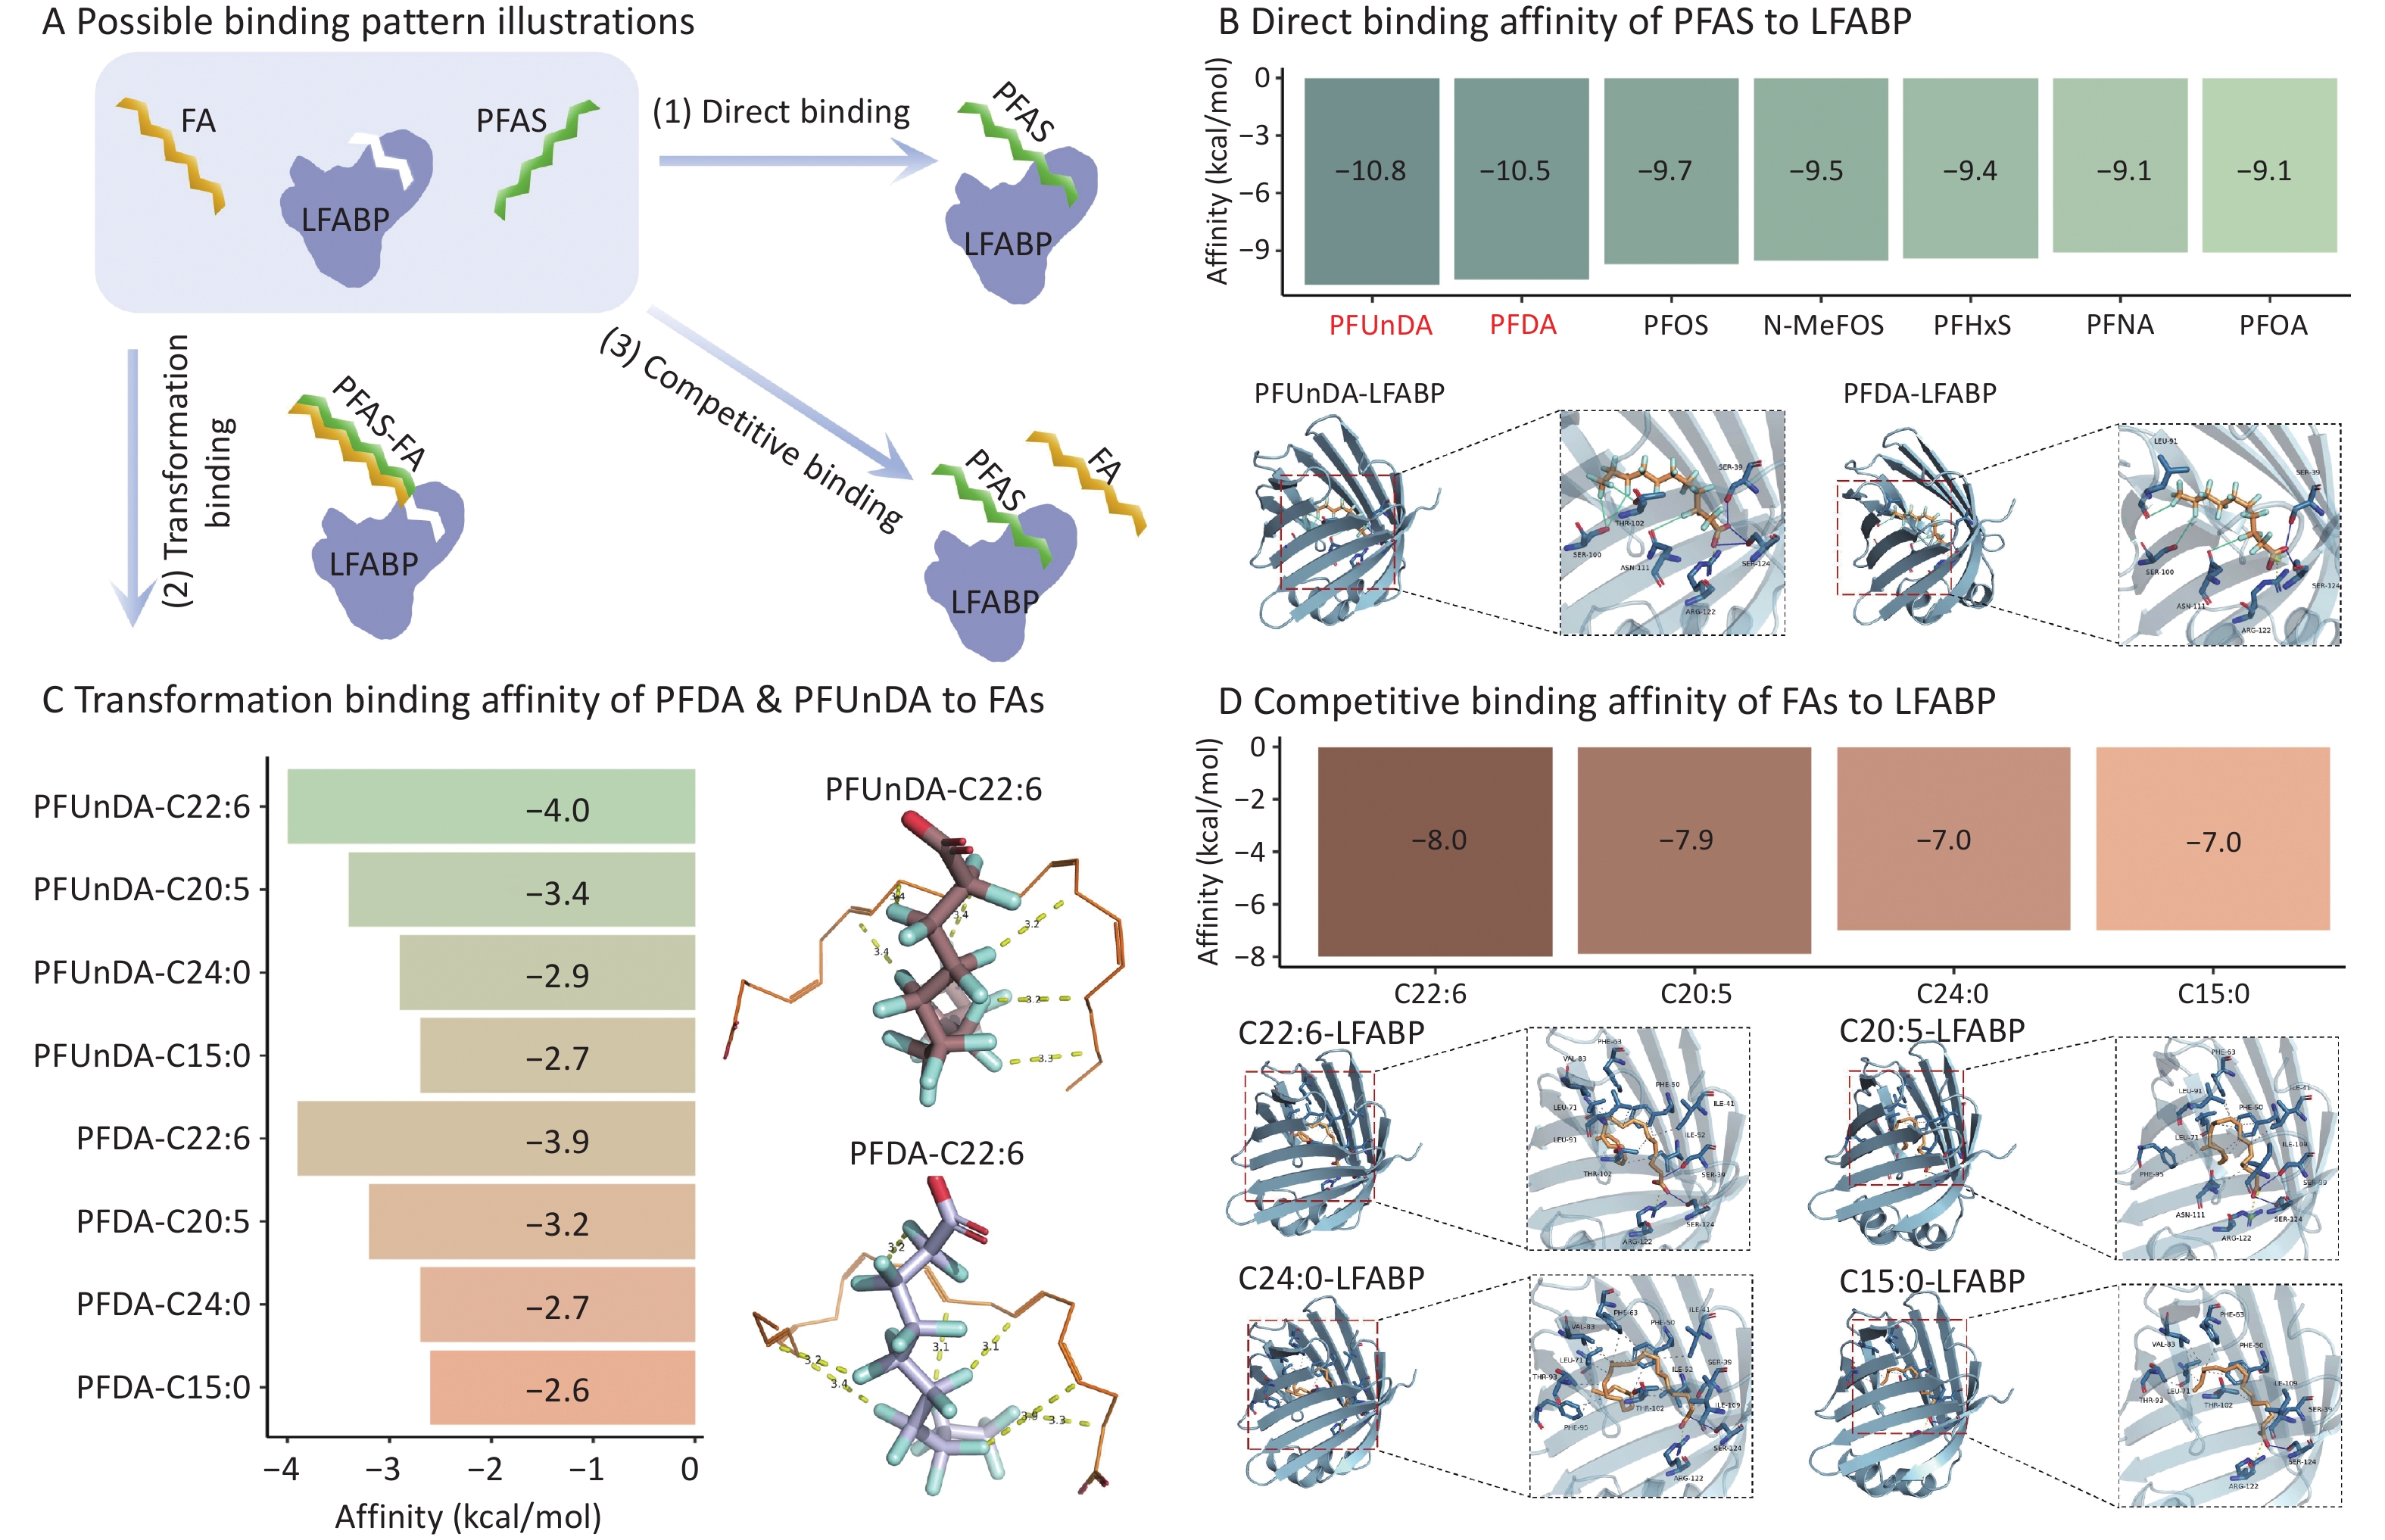
Molecular docking provided molecular-level support for the rankings. Figure 3A shows a conceptual diagram illustrating the possible binding patterns among PFAS, fatty acids, and LFABP. Among PFAS, PFUnDA (−10.8 kcal/mol) and PFDA (−10.5 kcal/mol) showed the highest direct affinity for LFABP, and among FAs, the PUFAs C22:6 (−8.0) and C20:5 (−7.9) bound LFABP most strongly (Figures 3B and 3D), mirroring the ML importance rankings. PFAS and FAs occupy the LFABP pocket through hydrophobic interactions, hydrogen bonds, and salt bridges, with FA carboxyl groups forming hydrogen bonds at residues SER-124 and SER-39, the same residues engaged by PFAS. Figure 3C shows the transformation-binding affinities of PFDA and PFUnDA to the most critical FAs (C22:6, C20:5, C24:0, and C15:0). C22:6 exhibited moderate binding affinity, with free binding energy values of −3.9 kcal/mol for PFDA and -4.0 kcal/mol for PFUnDA. Supplementary Figure S12 illustrates the 3D docking modes between the selected PFAS and the remaining fatty acids. Because FAs bind LFABP far more strongly than PFAS bind FAs, competitive binding for LFABP, rather than direct PFAS–FA modification, is the more plausible mechanism linking the FAs to serum PFAS, in agreement with reports that PFAS compete with endogenous ligands for LFABP. Competitive binding is the most parsimonious explanation for our data; however, other modes should be acknowledged because LFABP has a flexible, dual-cavity pocket that can bind two ligands. Thus, simultaneous occupancy or cooperative/ternary PFAS–FA–LFABP binding cannot be excluded. Because AutoDock Vina only evaluates static docking poses, molecular dynamics or biophysical assays are required to confirm these possibilities.
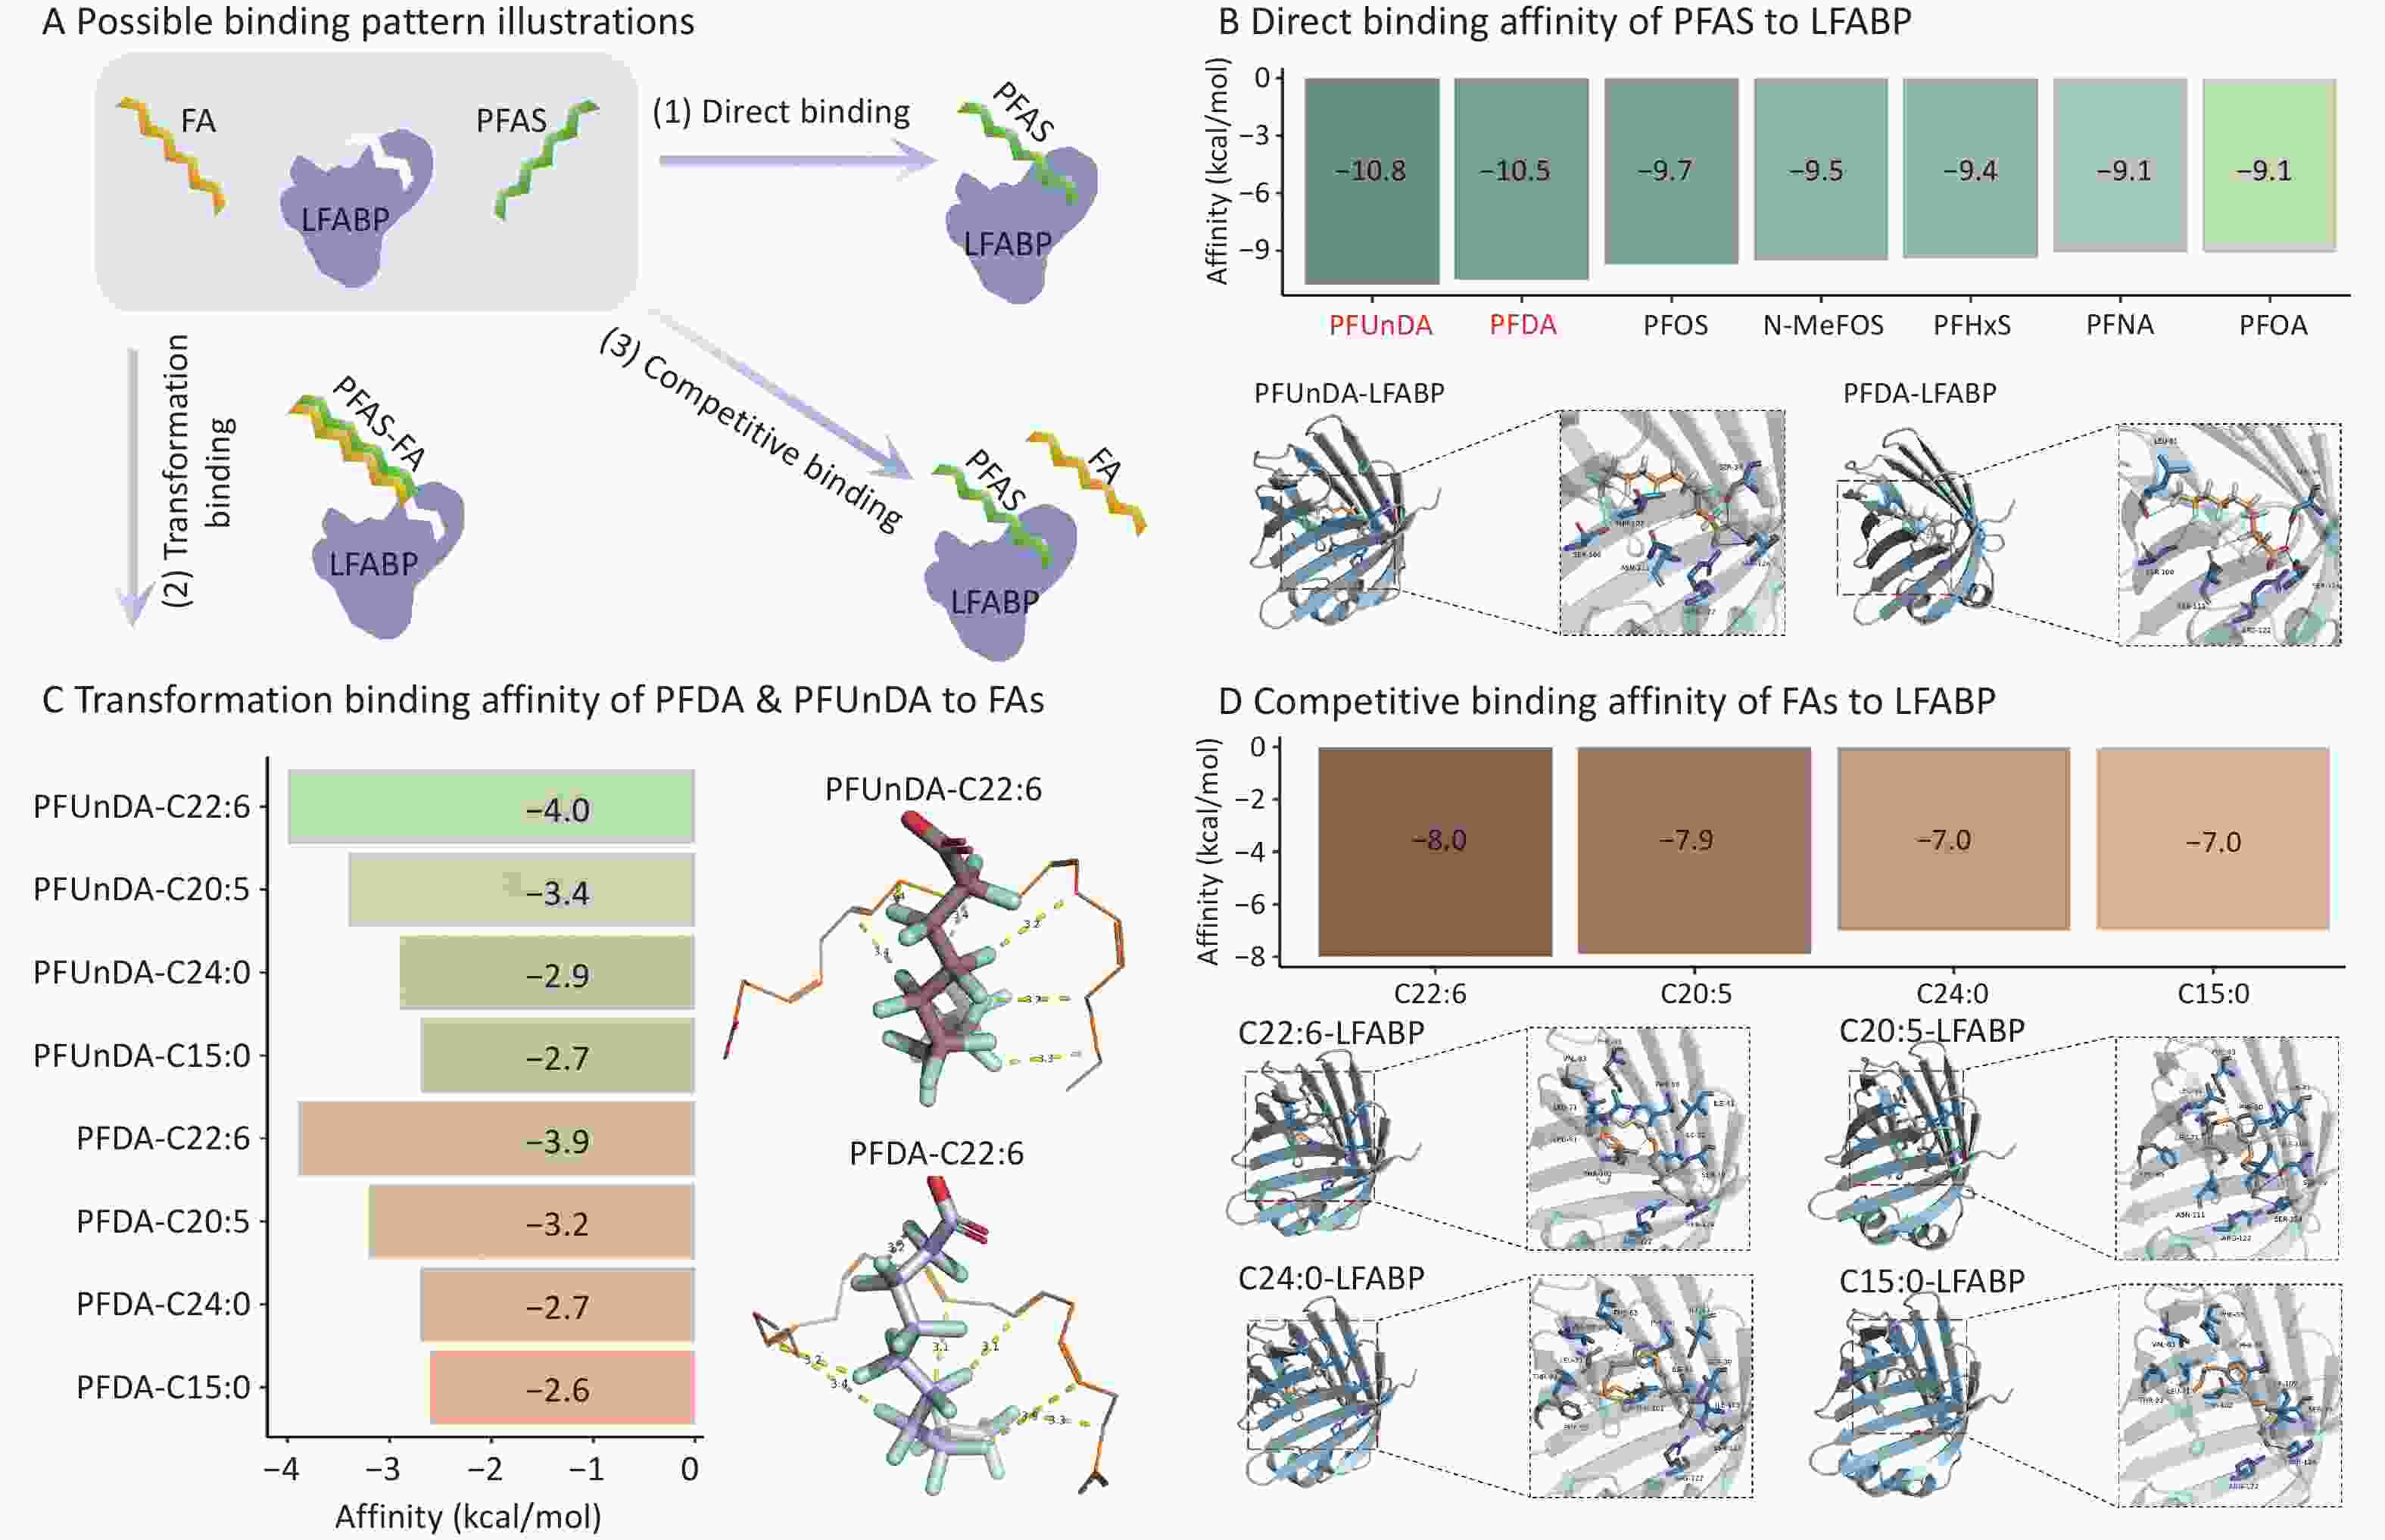
Figure 3. Results of (a) three possible binding patterns regarding PFAS, FA, and LFABP, (b) direct binding affinity of PFAS to LFABP, (c) transformation binding affinity of PFDA and PFUnDA to FAs, and (d) competitive binding affinity of FAs to LFABP. PFDA and PFUnDA with a high binding affinity to LFABP were selected for docking with FAs. Hydrogen bonds, halogen bonds, hydrophobic interactions, and salt bridges at the active site of LFABP are represented by solid blue, solid cyan, dashed grey, and dashed yellow lines, respectively. To enhance visibility, hydrophobic interactions between PFAS and FA are highlighted with dashed yellow lines, with their corresponding distances labeled (Å). FA, fatty acid; PFAS, per- and polyfluoroalkyl substances; LFABP, liver fatty acid-binding protein; PFAS–FA, per- and polyfluoroalkyl substance–fatty acid complex; PFUnDA, perfluoroundecanoic acid; PFDA, perfluorodecanoic acid; PFOS, perfluorooctane sulfonic acid; N-MeFOS, N-methyl perfluorooctanesulfonamide; PFHxS, perfluorohexane sulfonic acid; PFNA, perfluorononanoic acid; PFOA, perfluorooctanoic acid; PFUnDA–LFABP, perfluoroundecanoic acid–liver fatty acid-binding protein complex; PFDA–LFABP, perfluorodecanoic acid–liver fatty acid-binding protein complex; C22:6, docosahexaenoic acid; C20:5, eicosapentaenoic acid; C24:0, lignoceric acid; C15:0, pentadecanoic acid; C22:6–LFABP, docosahexaenoic acid–liver fatty acid-binding protein complex; C20:5–LFABP, eicosapentaenoic acid–liver fatty acid-binding protein complex; C24:0–LFABP, lignoceric acid–liver fatty acid-binding protein complex; C15:0–LFABP, pentadecanoic acid–liver fatty acid-binding protein complex; kcal/mol, kilocalories per mole; Å, angstrom; SER, serine; THR, threonine; ASN, asparagine; ARG, arginine; LEU, leucine; VAL, valine; PHE, phenylalanine; ILE, isoleucine.
To the best of our knowledge, this is the first study to validate FAs as predictors of serum PFAS levels in a nationally representative population. As a systematic extension of our earlier work on pregnant women, this study includes the simultaneous evaluation of dietary and circulating FAs, applies a novel performance-weighted SHAP framework that provides a reusable approach for prioritizing predictors in future studies, and integrates data-driven prediction with molecular docking supported by a large, rigorous quality-controlled sample. R2-Standardized SHAP aggregation should be interpreted as an exploratory, performance-informed approach, rather than a definitive replacement for unweighted SHAP summaries.
This study had several limitations. First, the cross-sectional study precluded establishing temporal or causal relationships between FA and PFAS. SHAP-based importance quantifies a variable’s contribution to predictive accuracy within the model and does not, by itself, demonstrate a dominant causal or biological role. Molecular docking provides mechanistic plausibility but does not provide direct biological proof; wet-lab assays such as co-immunoprecipitation, surface plasmon resonance, or isothermal titration calorimetry are therefore required. Second, 24-hour dietary recalls carry measurement errors, partly mitigated by averaging; residual confounding by other nutrients cannot be excluded, and our focus on selected long-chain PFAS may limit generalizability to short-chain compounds. Third, external validation using independent cohorts is required before the model can be further used for surveillance or intervention planning. However, because no publicly available dataset simultaneously includes comparable dietary FA, serum FA, serum PFAS, and covariate data, true external validation is not feasible in the present study. Further studies should therefore include a broader range of PFAS. Because the analytic groups differed in sample size, calendar period, and predictor availability, between-group differences in R2 and SHAP-based summaries should be interpreted as descriptive and model-specific rather than as a formal head-to-head comparison. Studies with harmonized sampling periods, balanced sample sizes, and resampling-based validation are needed to more rigorously evaluate the added predictive value of circulating FAs.
Because PFAS biomonitoring is costly and largely confined to well-resourced settings, modifiable dietary predictors are particularly valuable for risk surveillance. Although toxicokinetic models and prior machine-learning studies have identified predictors such as volume of distribution, region, race, sex, and BMI, these are largely non-modifiable; by focusing on dietary FAs, we instead highlight modifiable predictors that explain much of the variation in serum PFAS and offer actionable targets for intervention.
In conclusion, this study has identified FAs as promising biomarkers for predicting PFAS. Dietary FAs showed stronger predictive values for PFDA, PFOS, PFOA, and Sm-PFOS, whereas circulating FAs contributed more to total PFAS, PFUnDA, PFNA, N-MeFOSA-Ac, and PFHxS. Tree-based models performed the best, and omega-3 FAs were the key predictors of PFDA and PFUnDA. Molecular docking supported strong omega-3 FA–LFABP binding and potential competition with PFAS for LFABP. These findings offer a novel strategy for predicting PFAS exposure and may guide future dietary policies.
HTML
Competing Interests All authors declare no competing interests.
Authors’ Contributions Conceptualization, Methodology, Data-analysis & interpretation, Visualization, Writing-original draft, Writing-review & editing: Ming Yang. Conceptualization, Methodology, Data-analysis & interpretation, Visualization, Writing-original draft, Writing-review & editing: Jingtao Wu. Data Curation, Validation: Lin Tao. Data Curation, Validation: Weitian Tang. Data Curation: Weitao Su. Data Curation: Jiaxin Zhao. Visualization: Shengmei Zhang. Data Curation: Yanbing Li. Data Curation: Yaoyu Hu. Conceptualization, Funding acquisition, Writing-review & editing, Project administration, Supervision, Resources: Ang Li. Conceptualization, Funding acquisition, Project administration, Visualization, Writing-review & editing, Supervision, Resources: Yichao Huang.
Data Sharing The supplementary materials will be available in www.besjournal.com.
&These authors contributed equally to this work.
Reference

 Quick Links
 DownLoad: