
-
Preterm birth (PTB) is one of the most common adverse birth outcomes globally and is a key indicator set by the World Health Organization (WHO) to measure the quality of perinatal care and child survival. PTB is the leading cause of death among children under five years of age, accounting for 18% of all child deaths in 2015, with complications causing approximately 900,000 deaths annually[1]. Globally, approximately 13.4 million PTB cases were reported in 2020, with national rates ranging from 4% to 16%[2]. In China, the incidence of PTB has shown a slowly increasing trend, from 3.1% in 2013 to 5.2% in 2019, partly due to the widespread use of assisted reproductive technology and policy shifts toward two-child and three-child families[3]. Thus, PTB remains a critical barrier to improving population health.
The developmental origins of health and disease hypothesis, first articulated by Barker in the late 1980s, proposed that adverse environmental exposures during critical windows of early life can permanently alter physiological structure and metabolic function through "programming" effects, shaping health trajectories across the lifespan[4]. Subsequent research has confirmed that environmental exposures during pregnancy, particularly to air pollution and extreme temperatures, are associated with an increased PTB risk[5-8]. For instance, a recent hospital-based study in Xinxiang, China, identified susceptible windows of prenatal ozone exposure associated with preterm birth using distributed lag models[9]. This underscores the importance of examining trimester-specific effects of air pollutants. However, the modifying role of residential greenness, which may mitigate pollutant exposure, remains underexplored, particularly in high-greenness settings.
Green space, commonly quantified by the normalized difference vegetation index (NDVI) or enhanced vegetation index (EVI), encompasses vegetated areas, including parks, forests, grasslands, and street trees[10]. A growing body of evidence suggests that exposure to green space confers multiple health benefits[11], including reduced all-cause mortality[12], lower cardiovascular risk[13], and improved mental health[14]. In pregnant women, a physiologically vulnerable population, exposure to green space during pregnancy may directly influence fetal development[15]. Recent advances in satellite remote sensing have enabled large-scale, long-term assessments of residential greenness using NDVI or EVI within buffer zones of varying radii (e.g., 250 m–2,000 m), facilitating epidemiological investigations[16,17].
Most studies support the protective effects of pregnancy-related green space exposure against PTB. A nationwide study of 2.29 million singleton births across 30 Chinese provinces reported that a 0.1-unit increase in NDVI (250–1,000 m buffer zones) during pregnancy reduced PTB risk by 5.5%–6.1%[18]. Similarly, a 2026 study of 720,000 mother–infant pairs in Guangdong, China, found that a 0.1-unit increase in NDVI (500 m) was associated with a 5.0%–6.0% reduction in PTB risk[19]. However, these findings were not entirely consistent. Studies in Australia[20], Michigan, USA[21], and New Zealand[22] found no significant association between residential greenness and PTB or gestational age after adjusting for key confounders. Furthermore, the critical windows remain controversial; some studies identified the third trimester as the most sensitive period[19,23], whereas others pointed to the first trimester[23] or suggested trimester-specific optimal EVI ranges[24]. These discrepancies may stem from differences in study design, covariate adjustments, and regional green space characteristics, particularly the baseline greenness level and its seasonal variability.
Most previous evidence was derived from regions with low to moderate green space coverage[19,25,26], where protective effects are readily detectable. Far less is known about the health effects of residential greenness in high-greenness settings, where NDVI values are consistently high and seasonal variation is minimal. In such contexts, the exposure-response relationship may plateau or even reverse at very high NDVI levels, partly because green spaces can generate disservices, such as increased airborne pollen allergenicity[27,28], and allergenic tree species may counteract the protective effects of greenness. Although direct evidence linking green space-related allergen exposure to preterm birth is limited, a recent study found that greenness and pollen exposure during pregnancy increased the offspring wheezing risk[29], supporting the biological plausibility that high greenness may exert adverse effects via immune or inflammatory pathways. Therefore, studies in high-greenness cities are essential for characterizing the full dose-response spectrum, detecting nonlinearities or thresholds, and generating evidence applicable to cities with similar environmental profiles.
Nanning, which is located in southern China and has a subtropical monsoon climate, provides an ideal setting for such an investigation. The city has been recognized as a “China Green City” since 2007 and received the “United Nations Habitat Award”. As of early 2026, the green coverage rate of built-up areas reached 43.38%, park green space service radius coverage was 93.69%, and the per capita park green space area was 15.40 m2, ranking among the highest of Chinese provincial capitals. In 2024, the urban air quality excellent rate was 96.7%, with an annual average of PM2.5 concentration of 25.3 μg/m3. Nanning's combination of high greenness and relatively low air pollution offers a unique opportunity to examine the association between maternal residential greenness and PTB in a high-greenness context, free from the strong confounding by severe air pollution that plagues many other Chinese cities.
Therefore, using the 2016–2022 birth cohort data from Nanning, this study aimed to analyze the association between maternal residential greenness during different pregnancy periods and PTB risk and identify critical windows and thresholds using a sibling-matched design to control for unmeasured familial confounding[21], with additional adjustment for major air pollutants, temperature, and humidity. The findings are expected to provide scientific evidence for maternal and child health protection, urban ecological planning, and precision public health strategies, particularly in cities with high green space coverage, where evidence is currently lacking.
-
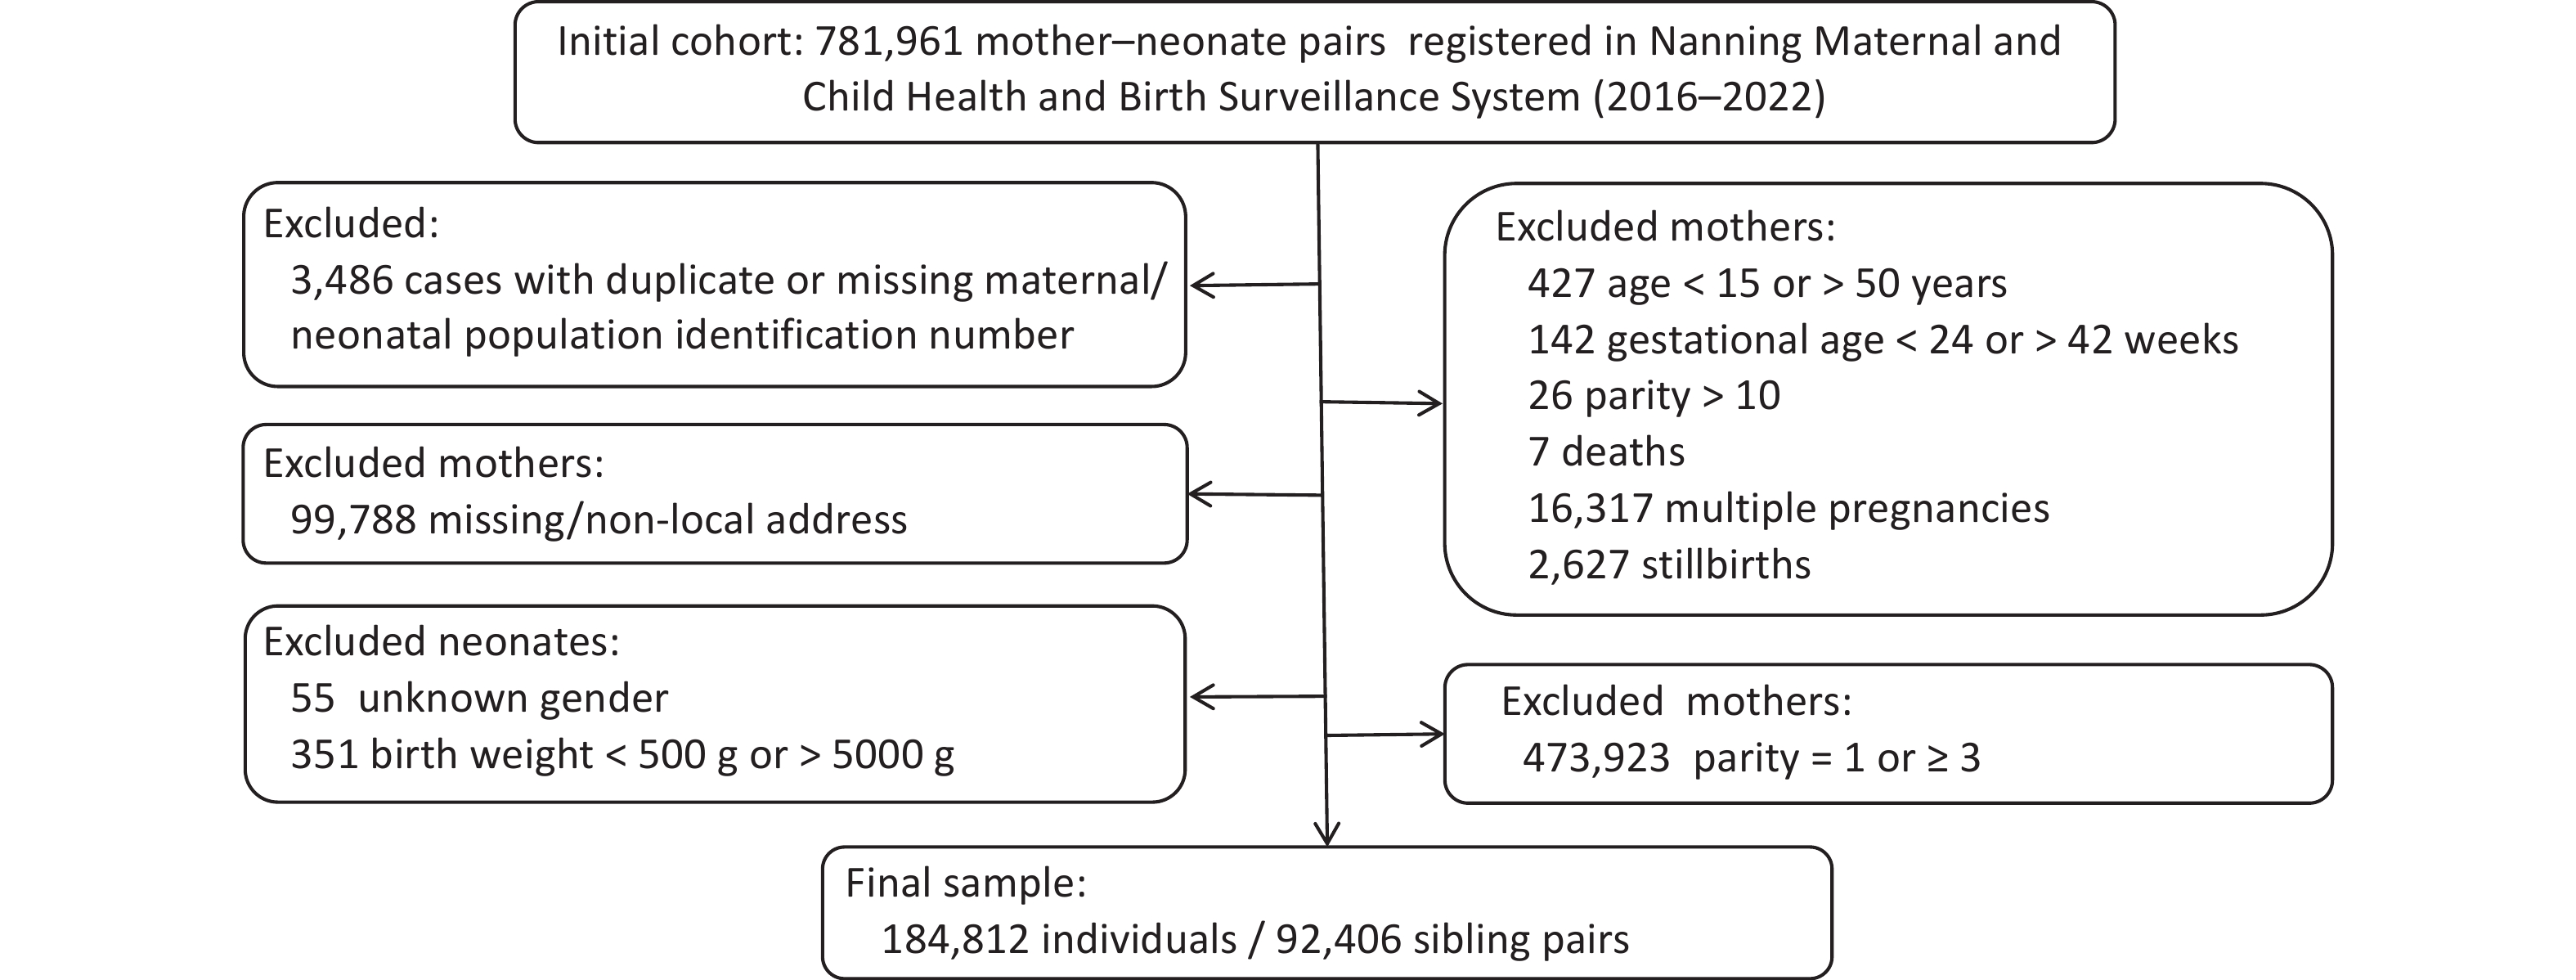
The study population comprised mothers who gave birth to two children in Nanning, Guangxi, China, between 2016 and 2022, along with their newborns. The birth cohort data were obtained from the Nanning Maternal and Child Health and Birth Surveillance System, which were de-identified, aggregated, and cleaned, and mothers with two deliveries were selected. The information collected included newborn sex, birth weight, gestational age at birth, maternal ethnicity, age at delivery, parity, number of births, and residential address during pregnancy. The exclusion criteria were as follows: (1) multiple pregnancies, (2) missing address or address outside Nanning, (3) missing newborn sex, (4) newborn birth weight < 500 g or > 5,000 g, (5) maternal age at delivery < 15 years or > 50 years, (6) gestational age < 24 weeks or > 42 weeks, (7) stillbirth, and (8) maternal death. A detailed participant selection flowchart is shown in Figure 1. According to the WHO criteria, delivery before 37 completed weeks of gestation was defined as PTB.
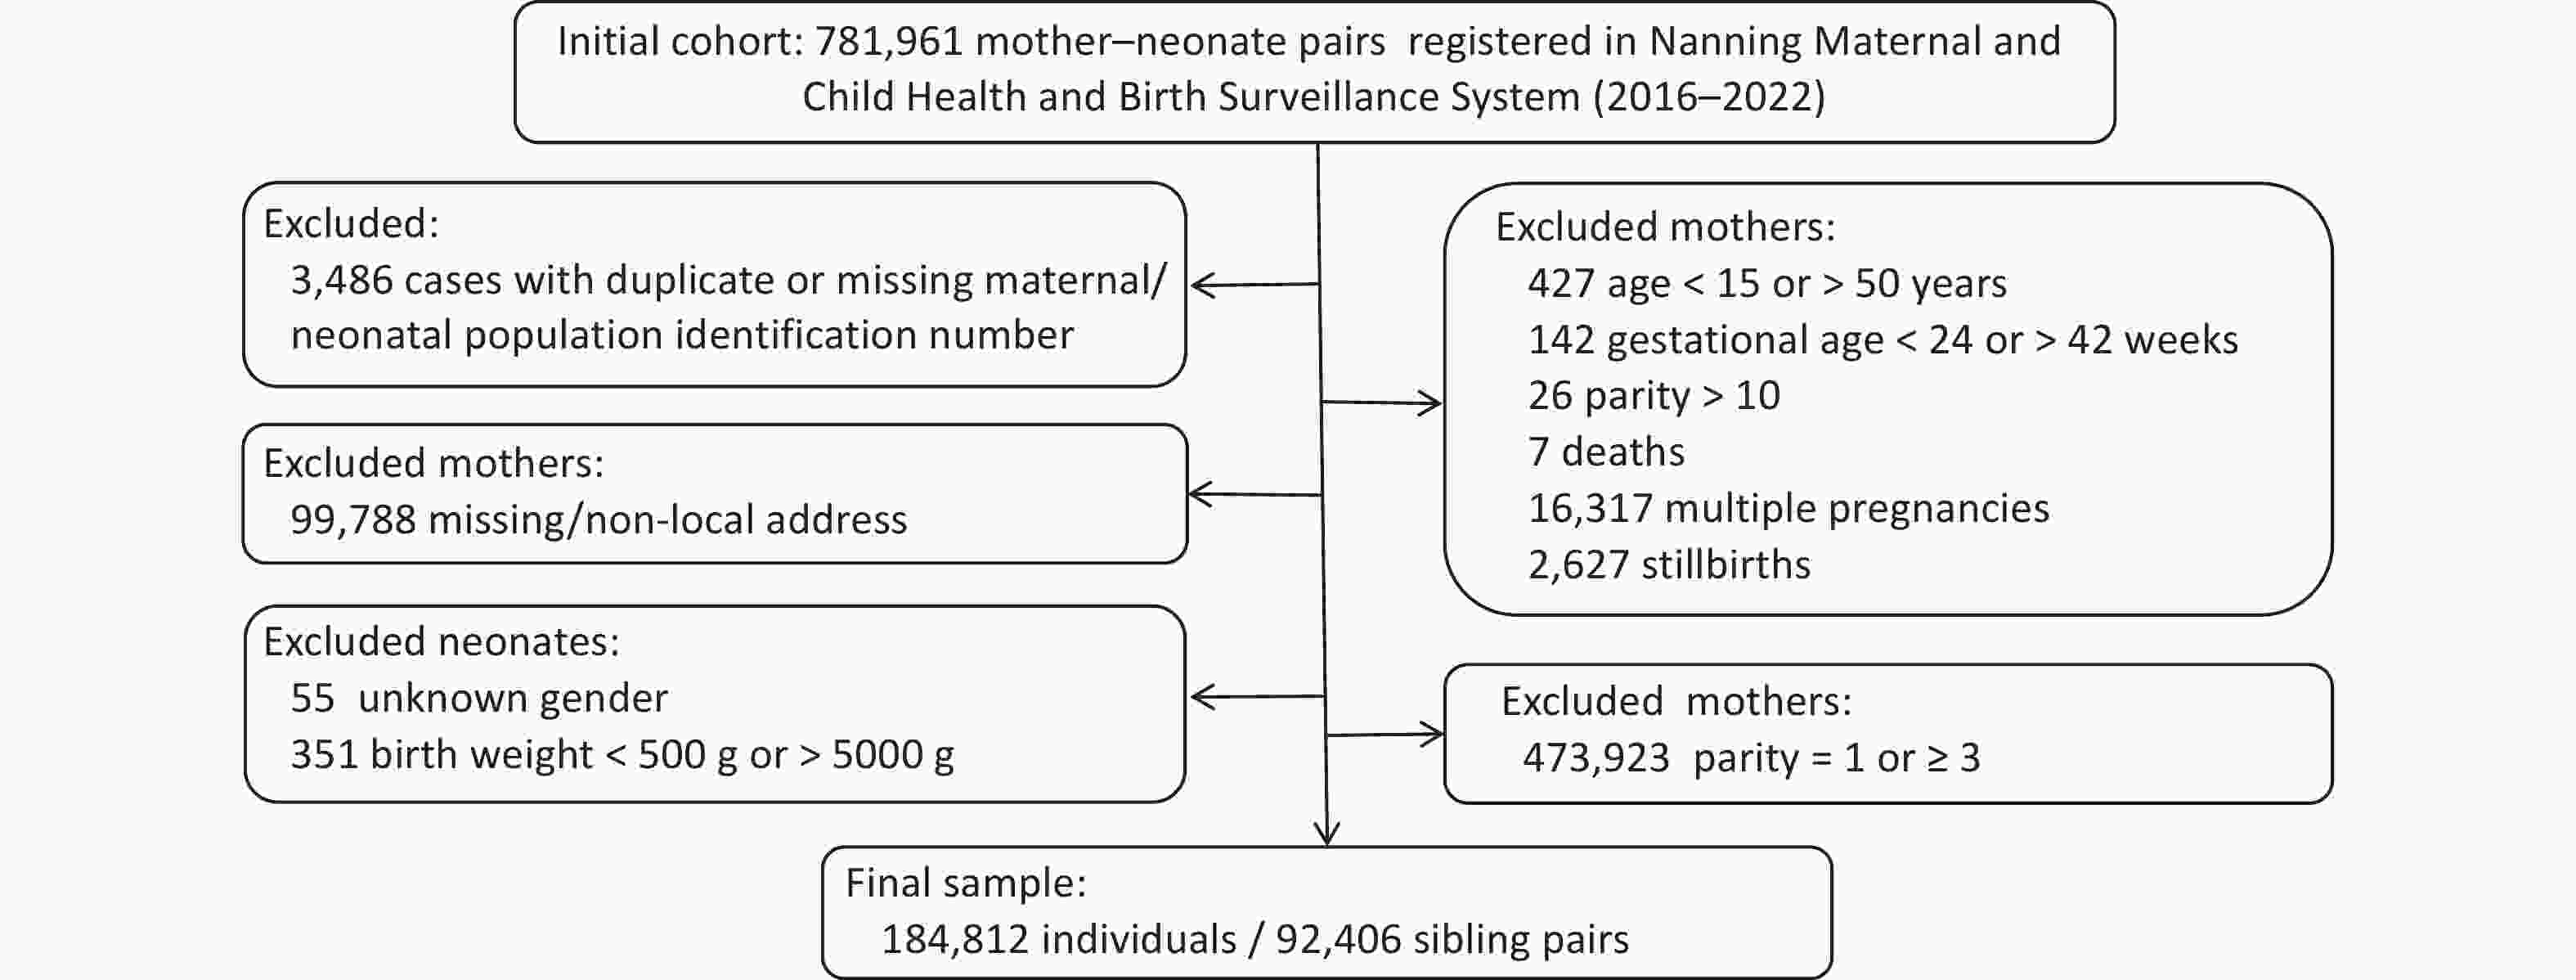
Figure 1. Flowchart of study sample selection.
Given the distinct physiological phases of pregnancy, we defined five exposure windows: pre-pregnancy (12 weeks before the last menstrual period), first trimester (weeks 1–12), second trimester (weeks 13–27), third trimester (weeks 28 to delivery), and the entire pregnancy (weeks 1 to delivery).
-
Maternal residential addresses were geocoded using the Amap (Gaode) location-based service application programming interface (https://lbs.amap.com/api/webservice/guide/api/ georegeo/). The coordinates were first transformed to the National Bureau of Surveying and Mapping (China) GCJ-02 system and then to the World Geodetic System 1984 (WGS-84, European Petroleum Survey Group: 4326) to facilitate subsequent linkage with exposure data (residential greenness, air pollution, temperature, and relative humidity).
-
Residential greenness was quantified using the NDVI derived from the MODIS MOD09GA product at a spatial resolution of 500 m and a daily temporal resolution[30,31]. The NDVI is calculated from the reflectance of visible red and near-infrared bands, theoretically ranging from -1 to 1[32], where positive values indicate vegetation cover (with higher values reflecting denser vegetation), negative values represent clouds, water, or snow, and zero corresponds to bare rock or soil. For ease of interpretation, negative NDVI values were recoded as 0, resulting in a final range of 0–1[33]. To match the imagery resolution, we defined four buffer zones around each residential address: 500 m, 1,000 m, 1,500 m, and 2,000 m.
Daily NDVI values were matched to each address 12 weeks before the last menstrual period until delivery. Given the seasonal variability of vegetation and sensitivity to cloud cover, we applied a maximum-value composite approach, using the maximum NDVI within each exposure window as the greenness level for that period. The average of the trimester-specific maximum values was used as the residential greenness level for the entire pregnancy[3].
-
Daily mean concentrations of PM2.5, PM10, NO2, SO2, CO, and O3 (8-hour daily maximum) in Nanning from January 2015 to December 2023 were obtained from the China High Air Pollutants (CHAP) dataset. This gap-free gridded dataset was constructed using machine learning methods integrating ground-based, satellite, and meteorological reanalysis data, covering mainland China at a daily temporal resolution and a 1 km × 1 km spatial resolution[17]. Spatial resolutions are 1 km for PM2.5, PM10, and O3; and 10 km (pre-2019) or 1 km (post-2019) for NO2, SO2, and CO. Concentrations are expressed in μg/m3 for PM2.5, PM10, O3, NO2, and SO2, and mg/m3 for CO.
Daily pollutant concentrations were matched to each mother's residential address. For each of the five pregnancy periods, the arithmetic mean of daily concentrations was calculated as the exposure level. For incomplete exposure periods (i.e., less than a full month or week), the averages were computed based on the available days.
-
Daily mean temperature and relative humidity data were obtained from the European Centre for Medium-Range Weather Forecasts (ECMWF). We downloaded gridded data for Nanning (2015–2022) at 0.25° × 0.25° resolution, including daily 2-m temperature and dew point temperature. Relative humidity for each grid cell was derived using a standard conversion formula. Daily mean temperature and relative humidity were assigned to each subject by extracting values from the nearest grid cell. Period-specific averages were then calculated for each pregnancy window. For incomplete periods, the averages were based on the actual exposure days.
-
Normally distributed continuous variables were presented as mean ± standard deviation (SD), and categorical variables as numbers and percentages [n (%)]. Group differences were examined using t-tests and chi-square tests, with multiple comparisons adjusted using the Bonferroni method. Residential greenness, air pollutant concentrations, temperature, and humidity during each pregnancy period were summarized as medians with interquartile ranges (IQR). Temporal trends in seasonal NDVI were evaluated using Joinpoint regression, and the average annual percent change (AAPC) was calculated to summarize the overall trends.
Conditional logistic regression, stratified by maternal ID, was used to estimate the association between residential NDVI and PTB risk for each pregnancy period and buffer zone. A three-stage stepwise adjustment strategy was used. Model 1 (crude) included only NDVI. Model 2 was additionally adjusted for neonatal parity, sex, and history of maternal birth. Model 3 (fully adjusted) further included maternal age, season of conception, and period-specific mean temperature and relative humidity. Because NDVI is bounded between 0 and 1, all odds ratios (ORs) were estimated per interquartile range (IQR) increment, defined as the difference between the 75th and 25th percentiles of the NDVI distribution for each period and buffer zone, to ensure clinically meaningful and comparable exposure contrasts. The coding of the categorical variables used in the conditional logistic regression models is presented in Table 1.
Variable Assignment Parity 1 = First sibling in pair*; 2 = Second sibling Season of conception 0= Autumn*; 1= Spring; 2= Summer; 3= Winter Birth history 0= Multiparous*; 1= Primiparous Newborn sex 0= Female*; 1= Male Preterm birth 0= No*; 1= Yes Note. *Reference group. Table 1. Variable assignment for conditional logistic regression
Restricted cubic splines (RCS) were employed within the conditional logistic regression framework to flexibly model the dose-response relationship between NDVI and PTB risk, using the “cph” function in the R package “rms.” The optimal number of knots (3–6) was selected by minimizing the Akaike Information Criterion (AIC). All models were adjusted for these covariates. The overall and non-linearity P-values were reported, and ORs with 95% CIs were calculated relative to the median NDVI as the reference.
To assess the robustness of the results, each of the six major air pollutants (PM2.5, PM10, O3, CO, SO2, and NO2) was individually added to Model 3, and the conditional logistic regression was refitted for each buffer zone. The results of the fully adjusted model were considered stable if the effect estimates and significance for NDVI did not change materially after pollutant adjustment.
All statistical analyses were performed using R version 4.2.3, with the packages “survival” (conditional logistic regression), “rms” (RCS), and “segmented” (segmented regression). A two-sided P < 0.05 was considered statistically significant.
-
Between 2015 and 2022, the median NDVI levels were 0.80 in spring, 0.87 in summer, 0.88 in autumn, and 0.77 in winter. Summer and autumn exhibited higher NDVI values; however, the overall seasonal variation was minimal. No significant temporal trends were observed across years for any season (Table 2).
Year NDVI Spring Summer Autumn Winter 2015 0.77 0.86 0.90 0.76 2016 0.80 0.88 0.89 0.76 2017 0.81 0.86 0.87 0.75 2018 0.80 0.87 0.87 0.74 2019 0.77 0.86 0.88 0.74 2020 0.80 0.87 0.84 0.76 2021 0.78 0.89 0.90 0.84 2022 0.84 0.88 0.90 0.81 Total 0.80 0.87 0.88 0.77 AAPC 0.58 0.25 −0.03 1.10 P 0.221 0.139 0.402 0.119 Note. NDVI: normalized difference vegetation index; AAPC, average annual percent change. Table 2. Green space levels by season from 2015 to 2022
-
A total of 658,735 singleton live births were recorded in Nanning between 2016 and 2022. After 1:1 sibling matching by maternal identification number, 92,406 sibling-matched pairs (184,812 newborns) were included in the final analysis. The incidence of PTB was 4.96% (9,167/184,812). The mean maternal age at delivery was 28.31 ± 4.95 years; 68,024 (36.81%) were primiparous and 116,788 (63.19%) were multiparous. Of the newborns, 94,171 (50.96%) were male and 90,641 (49.04%) were female. The mean gestational age was 38.65 ± 1.43 weeks, and the mean birth weight was 3,159.86 ± 424.62 g (Table 3).
Variable Overall PTB t /χ2 P Yes (n = 9,167) No (n = 175,645) Maternal age at delivery (years) 28.31 ± 4.95 28.98 ± 5.37 28.28 ± 4.92 −12.305 < 0.001 Gestational age (weeks) 38.65 ± 1.43 34.76 ± 1.87 38.85 ± 1.06 207.378 < 0.001 Birth weight (g) 3,159.86 ± 424.62 2,455.52 ± 519.99 3,196.62 ± 385.17 134.544 < 0.001 Sex Male 94,171 (50.96%) 5,149 (5.47%) 89,022 (94.53%) 104.700 < 0.001 Female 90,641 (49.04%) 4,018 (4.43%) 86,623 (95.57%) Season of conception Spring 45,880 (24.83%) 2,426 (5.29%) 43,454 (94.71%) 15.319 0.002 Summer 41,679 (22.55%) 2,059 (4.94%) 39,620 (95.06%) Autumn 45,663 (24.71%) 2,221 (4.86%) 43,442 (95.14%) Winter 51,590 (27.91%) 2,461 (4.77%) 49,129 (95.23%) Birth history Primiparous 68,024 (36.81%) 3,255 (4.79%) 64,769 (95.21%) 6.942 0.008 Multiparous 116,788 (63.19%) 5,912 (5.06%) 110,876 (94.94%) Note. *Continuous variables are presented as mean ± standard deviation, with group comparisons performed by t-test; categorical variables are presented as n (%), with group comparisons by chi-square test. PTB, preterm birth. Table 3. The basic characteristics of 184,812 research subjects with sibling matched*
The median maternal residential NDVI level during the entire pregnancy was 0.66 (0.43, 0.81), with period-specific NDVI levels shown in Table 4. The mean exposure levels during the entire pregnancy period were as follows: PM2.5, 30.85 (27.10, 34.76) μg/m3; PM10, 50.95 (45.03, 56.23) μg/m3; NO2, 22.26 (19.45, 28.28) μg/m3; SO2, 10.42 (9.20, 12.16) μg/m3; CO, 0.88 (0.80, 0.95) mg/m3; O3, 81.96 (76.01, 86.65) μg/m3; mean temperature, 21.58 (20.16, 23.33) °C; and mean relative humidity, 80.18% (78.40%, 81.78%) (Supplementary Table S1).
NDVIBuffer Zones pregnancy period Min P25 P50 P75 Max IQR 500 m Pre-pregnancy 0.16 0.36 0.52 0.72 1.00 0.36 First trimester 0.16 0.36 0.52 0.72 1.00 0.36 Second trimester 0.17 0.37 0.54 0.74 1.00 0.37 Third trimester < 0.01 0.36 0.52 0.72 1.00 0.36 Entire pregnancy 0.20 0.43 0.66 0.81 1.00 0.38 1,000 m Pre-pregnancy 0.18 0.35 0.51 0.70 1.00 0.35 First trimester 0.17 0.35 0.51 0.71 1.00 0.35 Second trimester 0.18 0.37 0.53 0.73 1.00 0.36 Third trimester < 0.01 0.36 0.52 0.71 1.00 0.35 Entire pregnancy 0.21 0.41 0.64 0.78 1.00 0.37 1,500 m Pre-pregnancy 0.18 0.35 0.51 0.70 1.00 0.35 First trimester 0.18 0.35 0.51 0.70 1.00 0.35 Second trimester 0.19 0.36 0.54 0.72 1.00 0.36 Third trimester < 0.01 0.36 0.52 0.71 1.00 0.35 Entire pregnancy 0.24 0.40 0.63 0.78 1.00 0.38 2,000 m Pre-pregnancy 0.19 0.35 0.52 0.70 1.00 0.35 First trimester 0.18 0.35 0.52 0.70 1.00 0.35 Second trimester 0.19 0.36 0.54 0.72 1.00 0.36 Third trimester < 0.01 0.36 0.52 0.71 1.00 0.35 Entire pregnancy 0.26 0.41 0.63 0.78 1.00 0.37 Note. IQR, interquartile range. Table 4. Maternal residential greenness in the pregnancy period
-
A total of 7,461 discordant sibling pairs (14,922 individuals) were included in the conditional logistic regression, corresponding to 7,461 matched preterm cases (out of 9,167 total preterm births in the full cohort). After adjusting for covariates, the association between NDVI and PTB risk varied by exposure window; positive associations (OR > 1) were observed during pre-pregnancy and the second trimester, whereas a negative association (OR < 1) was found in the third trimester. No statistically significant associations were detected in the first trimester or the entire pregnancy. The adjusted ORs for each model are presented in Tables 5 and 6. Subgroup analyses are presented in Supplementary Table S2.
NDVIBuffer Zones Pregnancy period Model 1 Model 2 Model 3 500 m Pre-pregnancy 1.07 (0.98–1.16) 1.10 (1.00–1.19) 1.16 (1.05–1.27) First trimester 1.05 (0.96–1.15) 1.07 (0.98–1.16) 1.05 (0.96–1.16) Second trimester 1.12 (1.03–1.23) 1.13 (1.04–1.24) 1.10 (1.01–1.21) Third trimester 0.61 (0.56–0.67) 0.62 (0.56–0.67) 0.59 (0.54–0.65) Entire pregnancy 0.94 (0.86–1.03) 0.94 (0.86–1.03) 0.91 (0.83–1.00) 1,000 m Pre-pregnancy 1.08 (0.98–1.18) 1.11 (1.01–1.22) 1.18 (1.07–1.30) First trimester 1.06 (0.97–1.17) 1.09 (0.99–1.19) 1.07 (0.97–1.18) Second trimester 1.12 (1.02–1.24) 1.13 (1.03–1.25) 1.11 (1.00–1.22) Third trimester 0.61 (0.55–0.67) 0.61 (0.56–0.68) 0.59 (0.53–0.65) Entire pregnancy 0.95 (0.86–1.05) 0.95 (0.86–1.05) 0.92 (0.83–1.02) 1,500 m Pre-pregnancy 1.08 (0.99–1.19) 1.12 (1.02–1.23) 1.20 (1.08–1.33) First trimester 1.07 (0.97–1.18) 1.10 (1.00–1.21) 1.09 (0.98–1.20) Second trimester 1.14 (1.03–1.26) 1.15 (1.04–1.27) 1.12 (1.01–1.25) Third trimester 0.60 (0.54–0.66) 0.61 (0.55–0.67) 0.58 (0.52–0.64) Entire pregnancy 0.97 (0.87–1.08) 0.97 (0.88–1.08) 0.94 (0.85–1.05) 2,000 m Pre-pregnancy 1.08 (0.98–1.19) 1.12 (1.01–1.23) 1.20 (1.07–1.33) First trimester 1.08 (0.98–1.19) 1.10 (1.00–1.22) 1.09 (0.98–1.21) Second trimester 1.13 (1.02–1.26) 1.15 (1.04–1.28) 1.12 (1.00–1.25) Third trimester 0.60 (0.54–0.66) 0.60 (0.54–0.67) 0.57 (0.51–0.64) Entire pregnancy 0.97 (0.87–1.08) 0.98 (0.88–1.09) 0.95 (0.85–1.06) Note. *Model 1 was adjusted for NDVI only. Model 2 was adjusted for neonatal parity, sex, and history of maternal birth. Model 3 was further adjusted for maternal age, season of conception, and mean temperature and relative humidity during each period. PTB, preterm birth; NDVI, normalized difference vegetation index; OR, odds ratio; CI, confidence interval. Table 5. Association between maternal residential greenness and PTB (OR [95% CI])
Variable Pre-pregnancy First trimester Second trimester Third trimester Entire pregnancy OR (95% CI) P OR (95% CI) P OR (95% CI) P OR (95% CI) P OR (95% CI) P Parity 1.50 (1.32–1.72) < 0.001 1.50 (1.31–1.71) < 0.001 1.51 (1.32–1.72) < 0.001 1.50 (1.31–1.71) < 0.001 1.49 (1.31–1.71) < 0.001 Spring 1.32 (1.14–1.53) < 0.001 1.21 (1.04–1.41) 0.012 1.22 (1.04–1.43) 0.013 1.29 (1.12–1.50) 0.001 1.40 (1.20–1.63) < 0.001 Summer 1.09 (0.99–1.20) 0.086 1.12 (0.96–1.32) 0.153 1.02 (0.92–1.13) 0.691 1.06 (0.91–1.24) 0.433 1.11 (1.00–1.22) 0.042 Winter 1.13 (0.97–1.33) 0.118 1.01 (0.92–1.12) 0.775 1.10 (0.94–1.28) 0.233 1.07 (0.97–1.17) 0.158 1.18 (1.02–1.35) 0.025 Primiparous 1.27 (1.15–1.40) < 0.001 1.26 (1.14–1.40) < 0.001 1.27 (1.15–1.40) < 0.001 1.27 (1.15–1.41) < 0.001 1.26 (1.14–1.39) < 0.001 Male 1.28 (1.20–1.36) < 0.001 1.27 (1.20–1.36) < 0.001 1.27 (1.20–1.36) < 0.001 1.25 (1.17–1.33) < 0.001 1.27 (1.19–1.35) < 0.001 Maternal age at
delivery (years)0.96 (0.92–0.99) 0.010 0.95 (0.92–0.99) 0.008 0.95 (0.92–0.99) 0.005 0.96 (0.93–1.00) 0.028 0.96 (0.92–0.99) 0.017 Mean temperature
(°C)1.01 (1.00–1.03) 0.125 0.99 (0.98–1.01) 0.360 0.99 (0.98–1.01) 0.366 1.01 (1.00–1.02) 0.199 0.95 (0.93–0.98) 0.003 Mean relative
humidity (%)1.00 (0.99–1.01) 0.747 1.00 (0.99–1.01) 0.999 0.99 (0.98–1.00) 0.090 1.01 (1.00–1.01) 0.217 1.00 (0.99–1.02) 0.687 Note. NDVI, normalized difference vegetation index; PTB, preterm birth; OR, odds ratio; CI, confidence interval. Table 6. Results of covariates in the logistic model for the association between residential NDVI and PTB during each pregnancy (only for the 500 m buffer)
-
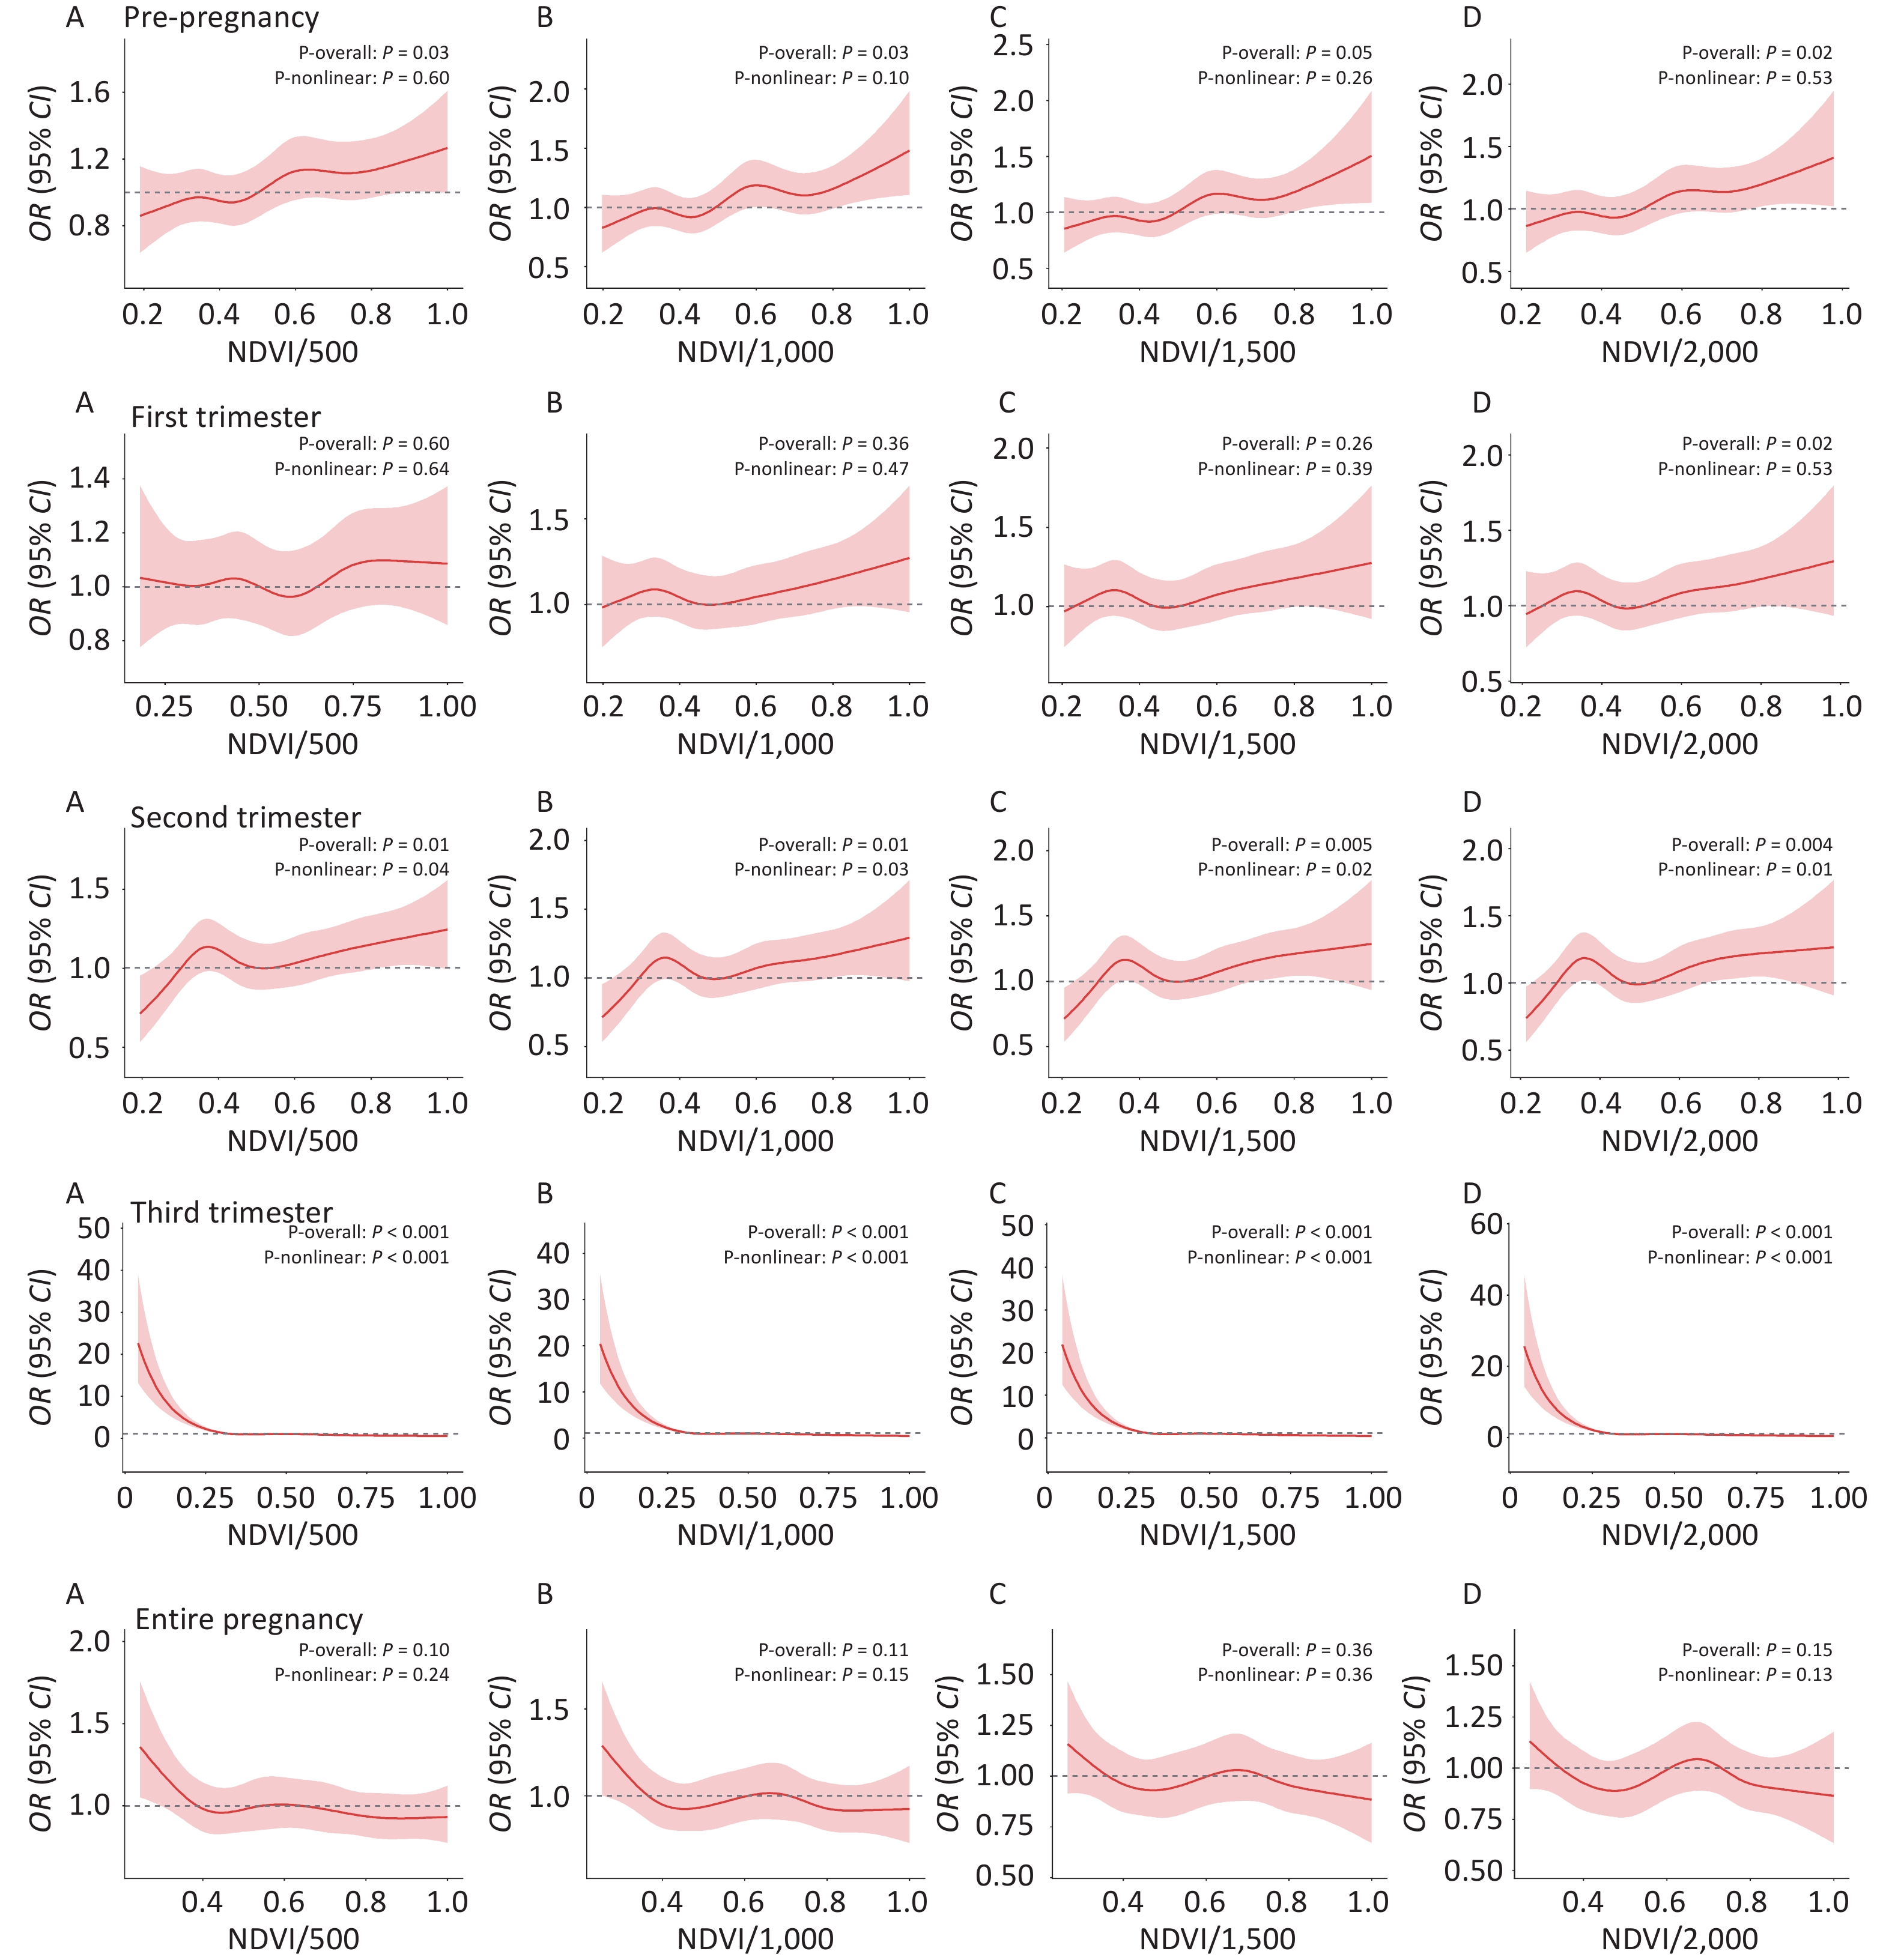
Restricted cubic spline analysis revealed significant non-linear dose-response relationships between residential NDVI and PTB risk for all pregnancy periods except the first trimester. During the pre-pregnancy period, the curve showed an upward trend, with PTB risk increasing significantly when NDVI exceeded approximately 0.80. In contrast, the third trimester exhibited an L-shaped curve, with an inflection point at NDVI around 0.30; beyond this threshold, further increases in NDVI were associated with little additional change in PTB risk. These associations were consistent across all the buffer zones (Figure 2).
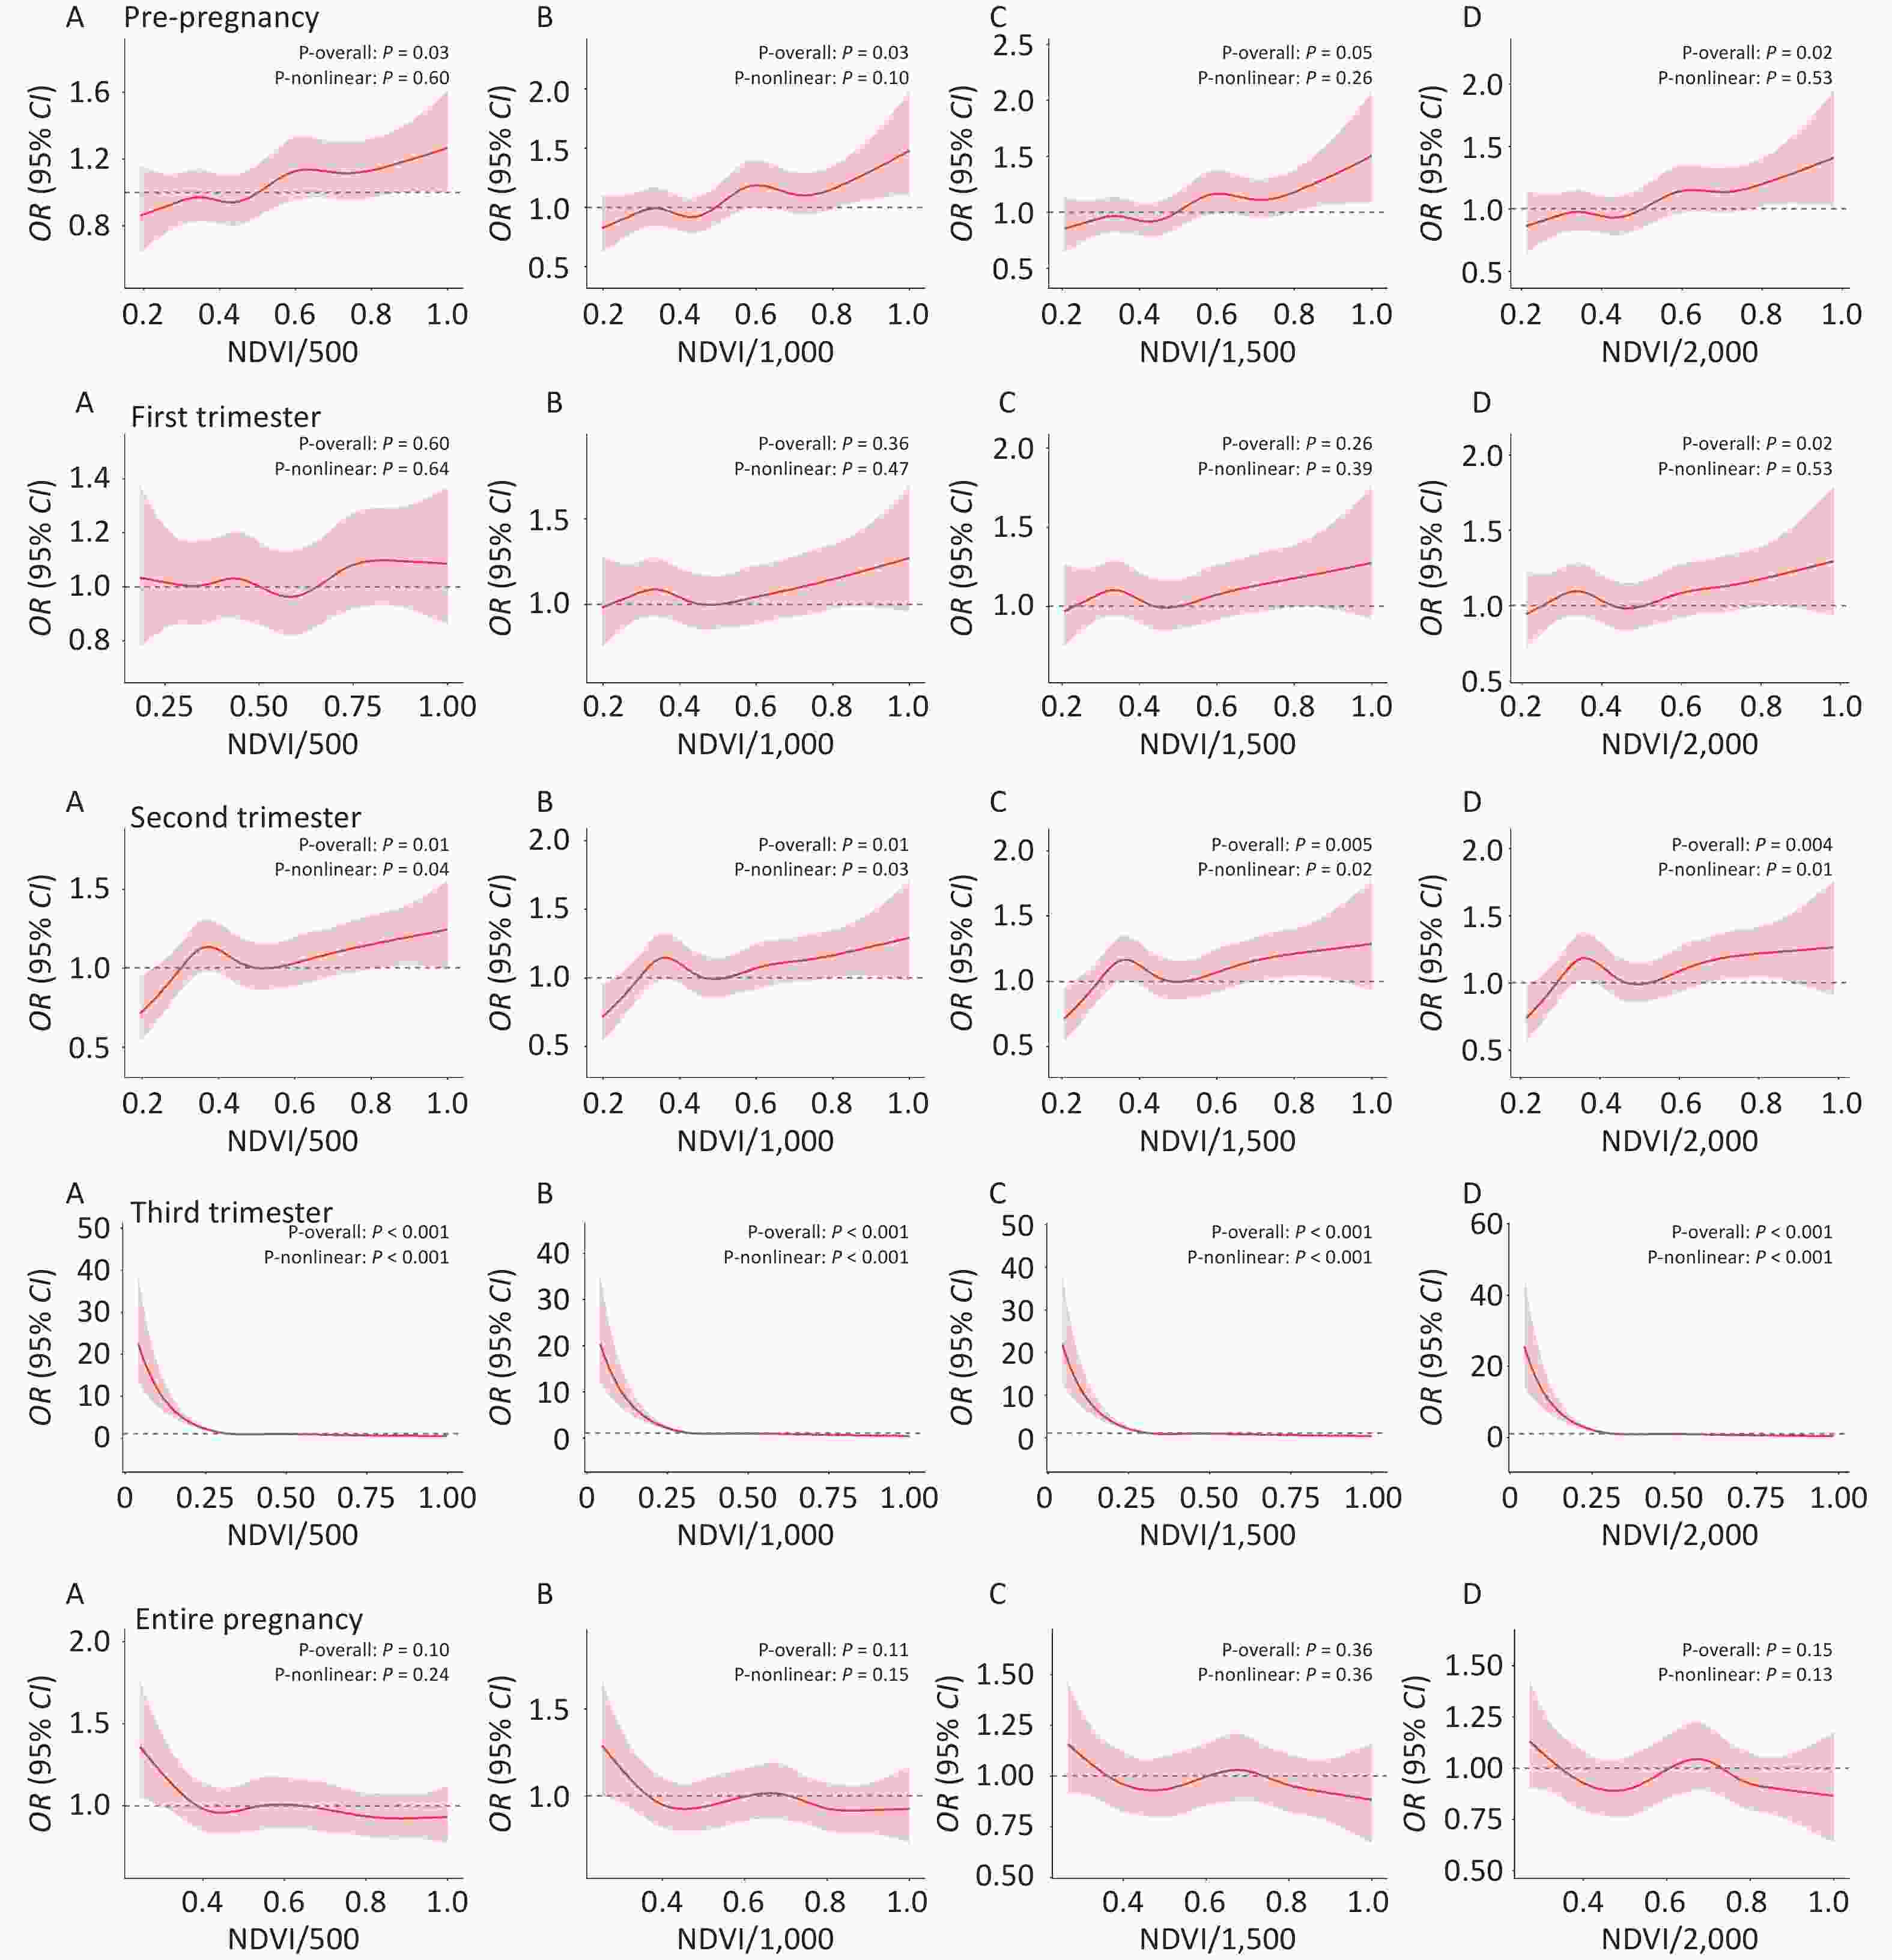
Figure 2. Non-linear dose-response relationship between NDVI and PTB risk across different pregnancy periods for buffer zones of 500 m (A), 1,000 m (B), 1,500 m (C), and 2,000 m (D). NDVI, normalized difference vegetation index; PTB, preterm birth.
The estimated ORs and 95% CIs at NDVI = 0.30 and 0.80 relative to the median reference are summarized in Supplementary Table S3.
-
After individually adjusting for each of the six air pollutants (PM2.5, PM10, O3, CO, SO2, and NO2), the positive association between pre-pregnancy residential NDVI and PTB risk and the negative association in the third-trimester remained statistically significant, with the ORs varying only slightly across all buffer zones. No consistent associations were observed for the other pregnancy periods. The detailed results are presented in Table 7.
NDVIBuffer Zones Pregnancy period Model 3 +PM2.5 +PM10 +NO2 +SO2 +CO +O3 OR(95% CI) P OR(95% CI) P OR(95% CI) P OR(95% CI) P OR(95% CI) P OR(95% CI) P OR(95% CI) P 1,500 m Pre-pregnancy 1.20
(1.08–1.33)0.001 1.20
(1.08–1.33)0.001 1.20
(1.08–1.33)0.001 1.19
(1.06–1.33)0.003 1.22
(1.10–1.36)<0.001 1.17
(1.05–1.30)0.003 1.20
(1.08–1.33)0.001 First trimester 1.09
(0.98–1.20)0.115 1.09
(0.98–1.20)0.118 1.09
(0.98–1.20)0.115 1.04
(0.93–1.17)0.465 1.12
(1.01-1.25)0.033 1.06
(0.96–1.18)0.241 1.09
(0.98–1.20)0.117 Second trimester 1.12
(1.01–1.25)0.033 1.12
(1.01–1.25)0.033 1.12
(1.01–1.25)0.033 1.11
(0.99–1.25)0.081 1.17
(1.05–1.31)0.004 1.10
(0.99–1.22)0.089 1.12
(1.01–1.25)0.034 Third trimester 0.58
(0.52–0.64)<0.001 0.58
(0.52–0.64)<0.001 0.58
(0.52–0.64)<0.001 0.52
(0.46–0.58)<0.001 0.58
(0.52–0.65)<0.001 0.56
(0.51–0.63)<0.001 0.58
(0.52–0.64)<0.001 Entire pregnancy 0.94
(0.85–1.05)0.278 0.94
(0.85–1.05)0.279 0.94
(0.85–1.05)0.284 0.87
(0.76–0.99)0.030 0.97
(0.87–1.08)0.540 0.90
(0.81–1.01)0.073 0.94
(0.85–1.05)0.276 2,000 m Pre-pregnancy 1.20
(1.07–1.33)0.001 1.20
(1.07–1.33)0.001 1.20
(1.08–1.34)0.001 1.19
(1.06–1.34)0.004 1.22
(1.09–1.37)<0.001 1.17
(1.05–1.31)0.005 1.20
(1.07–1.33)0.001 First trimester 1.09
(0.98–1.21)0.096 1.09
(0.98–1.21)0.099 1.09
(0.98–1.21)0.097 1.05
(0.93–1.18)0.427 1.13
(1.02–1.26)0.025 1.07
(0.96–1.19)0.213 1.09
(0.98–1.21)0.098 Second trimester 1.12
(1.00–1.25)0.044 1.12
(1.00–1.25)0.044 1.12
(1.00–1.25)0.043 1.10
(0.98–1.25)0.107 1.17
(1.05–1.31)0.005 1.09
(0.98–1.22)0.117 1.12
(1.00–1.25)0.044 Third trimester 0.57
(0.51–0.64)<0.001 0.57
(0.51–0.64)<0.001 0.57
(0.51–0.64)<0.001 0.51
(0.45–0.57)<0.001 0.57
(0.51–0.64)<0.001 0.56
(0.50–0.62)<0.001 0.57
(0.51–0.64)<0.001 Entire pregnancy 0.95
(0.85–1.06)0.337 0.95
(0.85–1.06)0.338 0.95
(0.85–1.06)0.345 0.86
(0.76–0.99)0.035 0.97
(0.87–1.09)0.640 0.90
(0.81–1.02)0.088 0.95
(0.85–1.06)0.333 Note. NDVI, normalized difference vegetation index; PTB, preterm birth; OR, odds ratio; CI, confidence interval. Table 7. Sensitivity analysis: association between residential NDVI and PTB in each pregnancy period and buffer zone after adjusting for air pollutants
NDVIBuffer Zones Pregnancy period Model 3 +PM2.5 +PM10 +NO2 +SO2 +CO +O3 OR(95% CI) P OR(95% CI) P OR(95% CI) P OR(95% CI) P OR(95% CI) P OR(95% CI) P OR(95% CI) P 1,500 m Pre-pregnancy 1.20
(1.08–1.33)0.001 1.20
(1.08–1.33)0.001 1.20
(1.08–1.33)0.001 1.19
(1.06–1.33)0.003 1.22
(1.10–1.36)<0.001 1.17
(1.05–1.30)0.003 1.20
(1.08–1.33)0.001 First trimester 1.09
(0.98–1.20)0.115 1.09
(0.98–1.20)0.118 1.09
(0.98–1.20)0.115 1.04
(0.93–1.17)0.465 1.12
(1.01−1.25)0.033 1.06
(0.96–1.18)0.241 1.09
(0.98–1.20)0.117 Second trimester 1.12
(1.01–1.25)0.033 1.12
(1.01–1.25)0.033 1.12
(1.01–1.25)0.033 1.11
(0.99–1.25)0.081 1.17
(1.05–1.31)0.004 1.10
(0.99–1.22)0.089 1.12
(1.01–1.25)0.034 Third trimester 0.58
(0.52–0.64)<0.001 0.58
(0.52–0.64)<0.001 0.58
(0.52–0.64)<0.001 0.52
(0.46–0.58)<0.001 0.58
(0.52–0.65)<0.001 0.56
(0.51–0.63)<0.001 0.58
(0.52–0.64)<0.001 Entire pregnancy 0.94
(0.85–1.05)0.278 0.94
(0.85–1.05)0.279 0.94
(0.85–1.05)0.284 0.87
(0.76–0.99)0.030 0.97
(0.87–1.08)0.540 0.90
(0.81–1.01)0.073 0.94
(0.85–1.05)0.276 2,000 m Pre-pregnancy 1.20
(1.07–1.33)0.001 1.20
(1.07–1.33)0.001 1.20
(1.08–1.34)0.001 1.19
(1.06–1.34)0.004 1.22
(1.09–1.37)<0.001 1.17
(1.05–1.31)0.005 1.20
(1.07–1.33)0.001 First trimester 1.09
(0.98–1.21)0.096 1.09
(0.98–1.21)0.099 1.09
(0.98–1.21)0.097 1.05
(0.93–1.18)0.427 1.13
(1.02–1.26)0.025 1.07
(0.96–1.19)0.213 1.09
(0.98–1.21)0.098 Second trimester 1.12
(1.00–1.25)0.044 1.12
(1.00–1.25)0.044 1.12
(1.00–1.25)0.043 1.10
(0.98–1.25)0.107 1.17
(1.05–1.31)0.005 1.09
(0.98–1.22)0.117 1.12
(1.00–1.25)0.044 Third trimester 0.57
(0.51–0.64)<0.001 0.57
(0.51–0.64)<0.001 0.57
(0.51–0.64)<0.001 0.51
(0.45–0.57)<0.001 0.57
(0.51–0.64)<0.001 0.56
(0.50–0.62)<0.001 0.57
(0.51–0.64)<0.001 Entire pregnancy 0.95
(0.85–1.06)0.337 0.95
(0.85–1.06)0.338 0.95
(0.85–1.06)0.345 0.86
(0.76–0.99)0.035 0.97
(0.87–1.09)0.640 0.90
(0.81–1.02)0.088 0.95
(0.85–1.06)0.333 Note. NDVI, normalized difference vegetation index; PTB, preterm birth; OR, odds ratio; CI, confidence interval. Table 8. (Continued). Sensitivity analysis: association between residential NDVI and PTB in each pregnancy period and buffer zone after adjusting for air pollutants
-
Using a large sibling-matched sample, this study found that maternal residential pre-pregnancy NDVI was associated with increased PTB risk, whereas third-trimester NDVI was associated with decreased PTB risk. The thresholds were identified for multiple pregnancy periods. These findings provide a theoretical basis for maternal and infant health policies and urban green space planning.
-
Our finding that third-trimester maternal residential NDVI has a protective effect against PTB is consistent with that of several large-scale studies. A nationwide study of 2.29 million singleton births across 30 Chinese provinces reported that 0.1-unit increase in residential NDVI (250 m, 500 m, and 1,000 m buffer zones) during pregnancy was associated with reductions in PTB risk of 5.5% to 6.1%[18]. Similarly, a longitudinal study of 3.75 million singleton births found that each 0.1-unit increment in residential NDVI (500 m buffer) reduced PTB risk by 7%[3]. A retrospective study of 5.24 million pregnancies in Guangdong Province observed that NDVI within 500 m and 1,000 m buffer zones in the first trimester was associated with 20% and 19% reductions in PTB risk, respectively, with the strongest protective effect occurring in the third trimester when high NDVI was combined with low particulate matter concentrations[23]. Most recently, a 2026 study of 720,000 mother-infant pairs in Guangdong reported that a 0.1-unit increase in NDVI (500 m buffer zone) during pregnancy was associated with a 5.0%–6.0% decrease in PTB risk[19].
In addition, we found that high pre-pregnancy NDVI was associated with increased PTB risk, a finding that differs from those of previous studies. This discrepancy may be attributed to regional differences in green space characteristics. Nanning has exceptionally high green space coverage, where the exposure-response relationship appeared nonlinear: low NDVI levels were associated with reduced risk, while high levels were associated with increased risk, suggesting the presence of an optimal exposure threshold.
One plausible explanation for this elevated risk at high greenness levels is the potential adverse effects of green space disservices, particularly increased exposure to airborne pollen allergens[18]. Urban green spaces, while providing ecosystem services, may also generate disservices, such as elevated pollen allergenicity[27,28]. The presence of allergenic tree species near residences can counteract the protective effects of green space[34], and exposure to green space may only mitigate allergy symptoms when the density of allergenic trees is low[35]. Although direct evidence linking allergen exposure during the pre-pregnancy period to preterm birth is limited, a recent study found that greenness and pollen exposure during pregnancy increased offspring wheezing risk[29], supporting the biological plausibility that high greenness may exert adverse effects via immune or inflammatory pathways.
-
Our study identified the third trimester as a critical window for the protective effects of NDVI against PTB. This finding aligns with fetal growth physiology; the third trimester is characterized by rapid weight gain and organ maturation, when placental function peaks and is highly sensitive to external stimuli (e.g., oxidative stress and inflammation). A recent study of 720,000 mother-infant pairs in Guangdong also identified the third trimester as the critical period for vegetation exposure affecting PTB[19]. The L-shaped dose-response relationship observed in our study, where PTB risk dropped sharply as NDVI increased from low to moderate levels (< 0.30) but plateaued beyond, is consistent with previous findings suggesting that the health benefits of increasing greenness are greater at lower baseline levels[32]. This non-linear pattern has important policy implications. In areas lacking green space, moderate greening can yield significant health benefits, whereas in already highly vegetated areas, further greening may offer limited marginal gains. Thus, greening policies should prioritize "green deserts" to maximize health equity.
Pre-pregnancy also emerged as a critical window but was associated with increased risk rather than protection. At low NDVI levels, pre-pregnancy NDVI was protective; however, as NDVI exceeded approximately 0.80, PTB risk increased. This finding contrasts with that of a recent longitudinal study reporting that pre-pregnancy green space exposure was positively correlated with gestational age[25], highlighting the need for further investigation across diverse settings.
Collectively, our results suggest a potential favorable NDVI range of approximately 0.30–0.80. A machine-learning study in Wuhan also identified trimester-specific optimal EVI ranges associated with the lowest PTB risk[24], supporting the existence of an optimal exposure range rather than a monotonic relationship.
-
Consistent with previous literature, PTB risk factors included maternal socioeconomic status[36], maternal age, pre-pregnancy health status, newborn sex, season of conception, and ambient temperature[7,24]. By employing a sibling-matched design and adjusting for the season of conception, mean temperature, relative humidity, newborn sex, and air pollutants, our study minimized residual confounding and enhanced the robustness of the findings. Taking the 500 m buffer zone as an example, the covariate analysis revealed that second-born siblings, spring conception (relative to autumn), primiparity, male newborns, and younger maternal age were significantly associated the high PTB risk, corroborating earlier reports.
-
After individually adjusting for each of the six air pollutants (PM2.5, PM10, O3, CO, SO2, and NO2), the protective effect of third-trimester NDVI against PTB remained consistent across all buffer zones, with little change in effect estimates. This finding suggests that the protective effects of green space are at least partially independent of air pollution mitigation. In addition to pollutant reduction, green space may influence PTB through direct pathways, including psychophysiological stress relief, noise reduction, and enhanced microbial exposure.
Oxidative stress and inflammation are recognized as core mechanisms linking environmental exposures to pregnancy outcomes, and pregnancy itself is a state of increased oxidative stress[37]. Vegetation may reduce PM2.5, PM10, NO2, and other pollutants through leaf absorption and stomatal uptake[38], thereby indirectly alleviating oxidative stress and inflammation. Furthermore, green space exposure mitigates the adverse effects of heatwaves on fetal health, including PTB and abnormal birth weight[39], and improves pregnancy outcomes by reducing psychological stress[40]. Notably, the benefits of green space appear more pronounced among lower-educated populations, possibly due to greater stress relief[41]. Emerging evidence suggests that residential green space may attenuate the DNA methylation-mediated effects of fine particulate matter on congenital heart disease[42]. Furthermore, higher plant species richness is associated with reduced PTB risk[43], indicating that green space quality, particularly biodiversity, may be as important as overall greenness in shaping health outcomes.
Future well-designed cohort studies incorporating metabolomics, detailed vegetation data, and immune biomarkers are needed to disentangle the complex pathways linking green space exposure to PTB and clarify the role of green space composition in shaping pregnancy outcomes.
-
This study had several strengths. It is among the few investigations that identify critical windows and thresholds for maternal residential greenness in a high-greenness setting, offering novel evidence for cities with similar environmental profiles. Methodologically, using a large-scale birth cohort (92,406 sibling-matched pairs) and the sibling-matched design enabled effective control for stable familial confounders, including genetic background, maternal baseline characteristics, and long-term lifestyle factors, thereby reducing the influence of unmeasured individual-level covariates. Additionally, we comprehensively adjusted for major air pollutants, temperature, and humidity to enhance the robustness of our effect estimates.
This study had several limitations. First, residential greenness was assessed solely based on the residential address during pregnancy, without accounting for daily mobility patterns (e.g., workplace and commuting routes). This may have led to exposure misclassification and potentially biased the effect estimates toward the null. Second, although the sibling-matched design mitigated confounding by stable familial factors, residual confounding may still exist. Important individual-level covariates, including parental socioeconomic status, maternal education, smoking or passive smoking, pre-pregnancy BMI, obstetric complications, prenatal care, and assisted reproductive technology, were not available in our dataset, and their absence may have biased the effect estimates. Third, our findings are derived from a single city (Nanning), characterized by high green space coverage and relatively low air pollution levels. Whether these results are generalizable to regions with low greenness or high pollution remains unclear. Future studies carried out in diverse geographic and pollution contexts are required to validate our conclusions. In addition, refined exposure assessments that incorporate individual mobility and detailed vegetation species data, along with a prospective collection of key confounders, are essential to further elucidate the associations observed in this study.
HTML
Study Population
Address Geocoding
Residential Greenness
Air Pollution Exposure
Meteorological Exposure
Statistical Analysis
Green Space Distribution in Nanning
Basic Characteristics of the Study Population
Non-linear Association Characteristics
Non-linear Dose-response Relationship
Sensitivity Analysis
Association between Residential Greenness during Pregnancy and the Risk of PTB
Critical Windows and Thresholds
Other Influencing Factors
Potential Biological Mechanisms
Strengths and Limitations
Competing Interests The authors declare that there are no conflicts of interest.
Ethics This study was approved by the Ethics Committee of the Guangxi Medical University (approval no. KY20250421).
Authors’ contributions Conceptualization: Meimeng Huang, Liangqin Mao, Xiaomin Wang, and Shun Liu. Writing – original draft, Visualization, Methodology, and Formal analysis: Meimeng Huang, Liangqin Mao, and Xiaomin Wang. Validation: Yujun Xiong, Mingxiao Wei, and Shun Liu. Data curation: Yujun Xiong, Liangqin Mao, Mingxiao Wei, and Mingzhen Liang. Supervision: Mingzhen Liang, Shun Liu, and Xianyan Tang. Writing, review, and editing: Mingzhen Liang, Shun Liu, and Xianyan Tang. Project administration: Liangqin Mao, Mingzhen Liang, and Shun Liu. Funding acquisition: Shun Liu.
Data Sharing The green space, air pollution, and meteorological exposure data are openly accessible from the MODIS MOD09GA product, China High Air Pollutants (CHAP) dataset, and European Centre for Medium-Range Weather Forecasts (ECMWF), respectively. The other data cannot be shared. The supplementary materials will be available in www.besjournal.com.
&These authors contributed equally to this work.

 Quick Links
 DownLoad: