





-
Chronic non-communicable diseases (NCDs), such as hypertension and cardiovascular diseases, represent a major global public health burden. Therefore, an accurate assessment of dietary sodium and potassium intake at the population level is essential for understanding their roles in disease etiology, evaluating intervention strategies, and informing national nutrition policies. The measurement of 24-hour urinary sodium and potassium excretion serves as the gold-standard biomarker for estimating individual intake, providing critical data for epidemiological studies, clinical guidelines, and public health monitoring[1,2].
However, the reliability and comparability of urinary electrolyte measurements depend heavily on the analytical performance of participating laboratories. Variations in measurement procedures, calibration, and quality control practices can introduce significant analytical bias. A systematic bias of approximately ± 5.7 mmol/L (130 mg/L) in urinary sodium determination would translate into an estimated relative error of about ±0.5 g in calculated daily salt intake (assuming a standardized 24-hour urine volume of 1.5 L)—a margin representing 10% of the World Health Organization's recommended daily upper limit of < 5 g. Biases of this magnitude can directly lead to the misinterpretation of population intake levels and subsequently result in misinformed public health policy decisions. Therefore, it is essential to ensure the accuracy, precision, and consistency of laboratory test results across different laboratories, time periods, and environmental conditions[3,4].
In China, more than 100 laboratories are involved in testing urine samples for national nutrition-and chronic-disease-related surveillance; however, a standardized quality management infrastructure across these sites remains inadequate. To address this gap, we implemented a nationwide longitudinal Sampling-Recheck-Feedback-Correction (SRFC) quality supervision framework, utilizing split-sample retesting and feedback-correction protocol, across 101 surveillance laboratories from 2023 to 2025. This protocol allowed us to track annual changes in pass rates, identify performance differences between public and third-party institutions, and demonstrate the practical value of a structured quality supervision framework in a real-world multi-center surveillance system. These findings provide actionable insights to improve chronic disease monitoring in China and other similar settings.
To assess the inter-laboratory agreement of urinary sodium and potassium test results, a split-sample re-testing protocol was implemented across all 101 surveillance laboratories, in which each laboratory selected the sample designated as sample No. 2 from the routine testing series. The sample was thoroughly mixed and divided into two aliquots. The first aliquot was tested locally by the participating laboratory using a routine method, and the results were submitted via email. The second aliquot (15 mL) was sealed in a storage tube, transported under controlled low-temperature conditions (approximately 4 °C, non-frozen) using insulated foam containers with ice packs, and sent to a central reference laboratory accredited by the China National Accreditation Service for Conformity Assessment (CNAS) for verification testing.
In the reference laboratory, urinary analytes were measured using a Beckman AU2700 automated biochemical analyzer (Beckman Coulter, Brea, CA, USA) with the indirect ion-selective electrode (ISE) method, with operators blinded to the submitted results, and the personnel receiving the email-submitted results were blinded to the verification data.
The allowable total error (TEa) from the National Health Commission’s external quality assessment program was adopted as the evaluation criterion, set at ± 20% for both analytes. Relative error (RE) was calculated as follows:
RE (%) = [(Test result - Verification result) / Verification result] × 100%
Under this framework (Supplementary Figure S1), each surveillance laboratory submitted the sample No. 2 to the reference laboratory for verification. The reference laboratory calculated the RE and compared it with the TEa criteria. Laboratories with results within ± 20% were classified as compliant (initial pass). Laboratories that exceeded the limit received feedback, performed a root-cause analysis, implemented corrective actions, re-analyzed sample No. 2, and resubmitted the results. If the re-analysis results fell within the acceptable range, the laboratory was classified as requiring improvement (initial failure, passed after re-analysis). Laboratories that remained noncompliant after re-analysis underwent comprehensive rectification and submitted a new urine sample for re-testing; these were classified as requiring major intervention (initial and re-analysis failed, passed after re-testing). Ultimately, all 101 surveillance laboratories completed verification.
Categorical variables were compared using the chi-square (χ2) test. For repeated measurements of non-normally distributed continuous variables, the Friedman test was applied, followed by pairwise Bonferroni correction. Between-group differences used the Mann–Whitney U test. The 95% CIs were calculated using the Clopper–Pearson exact binomial method. All analyses were performed using IBM SPSS Statistics version 21.0 (IBM Corp., Armonk, NY, USA). A two-sided P < 0.05 was considered statistically significant.
The longitudinal performance of 101 surveillance laboratories in 24-hour urinary sodium and potassium testing from 2023 to 2025 is summarized in Table 1. For urinary sodium measurements, the proportion of laboratories achieving an initial pass increased from 71.3% (72/101) in 2023 to 80.2% (81/101) in 2025. Concurrently, the percentage of laboratories requiring major interventions decreased markedly from 10.9% (11/101) to 2.0% (2/101) over the same period. The distribution of sodium compliance categories differed significantly across the three study years in the distribution of sodium compliance categories was observed (P = 0.027). Across the three years, the overall pass rate for sodium was 76.9% (95% CI: 71.9%–81.5%). Regarding urinary potassium testing, the distribution of potassium across all performance categories also showed a statistically significant change throughout the study period (P = 0.021). The overall pass rate for potassium was 80.5% (95% CI: 75.7%–84.8%). The corresponding trends in pass rates and measurement errors are shown in Supplementary Figure S2.
Year Compliant
(Passed)Requiring improvement
(Passed after re-analysis)Requiring major intervention
(Passed after re-test)P-value Na+ 2023 72 (71.3) 18 (17.8) 11 (10.9) 0.027 2024 80 (79.2) 9 (8.9) 12 (11.9) 2025 81 (80.2) 18 (17.8) 2 (2.0) K+ 2023 82 (81.2) 15 (14.9) 4 (4.0) 0.021 2024 79 (78.2) 10 (9.9) 12 (11.9) 2025 83 (82.2) 16 (15.8) 2 (2.0) Note. Data were represented as n (%). Table 1. Results of urinary sodium and potassium verification test in 101 surveillance laboratories (2023–2025)
Following reanalysis and retesting, all surveillance laboratories passed the verification test. The AREs for the urinary sodium and potassium measurements are presented in Table 2. For urinary sodium, the median ARE remained relatively stable across the three years: 2.8% (interquartile range [IQR]: 1.3–5.6) in 2023, 2.3% (IQR: 1.0–4.7) in 2024, and 3.7% (IQR: 1.4–7.2) in 2025. In contrast, urinary potassium errors decreased after 2023, with median ARE decreasing from 7.9% (IQR: 4.5–10.3) in 2023 to 3.2% (IQR: 1.7–7.2) in 2024, and remaining low at 3.3% (IQR: 1.5–5.7) in 2025. Narrower IQR ranges in 2024–2025 indicate higher interlaboratory consistency for potassium measurements.
Year Urinary sodium (%) Urinary potassium (%) M (P25, P75) P-value M (P25, P75) P-value 2023 2.8 (1.3, 5.6) > 0.05 7.9 (4.5, 10.3) 0.000 2024 2.3 (1.0, 4.7) 3.2 (1.7, 7.2) * 2025 3.7 (1.4, 7.2) 3.3 (1.5, 5.7) * Note. *P < 0.05 vs. 2023; AREs: Absolute Relative Errors. Table 2. AREs of urinary sodium and potassium (2023–2025)
To assess the practical implications of urinary sodium measurement errors for dietary salt intake estimation, we converted absolute differences (mmol/L) into estimated errors in daily salt intake (g/day) (Supplementary Table S1). The converted errors suggest that, while the median estimated error per individual is modest (≤ 0.6 g/day), the upper interquartile limit exceeded 1.0 g/day in certain years.
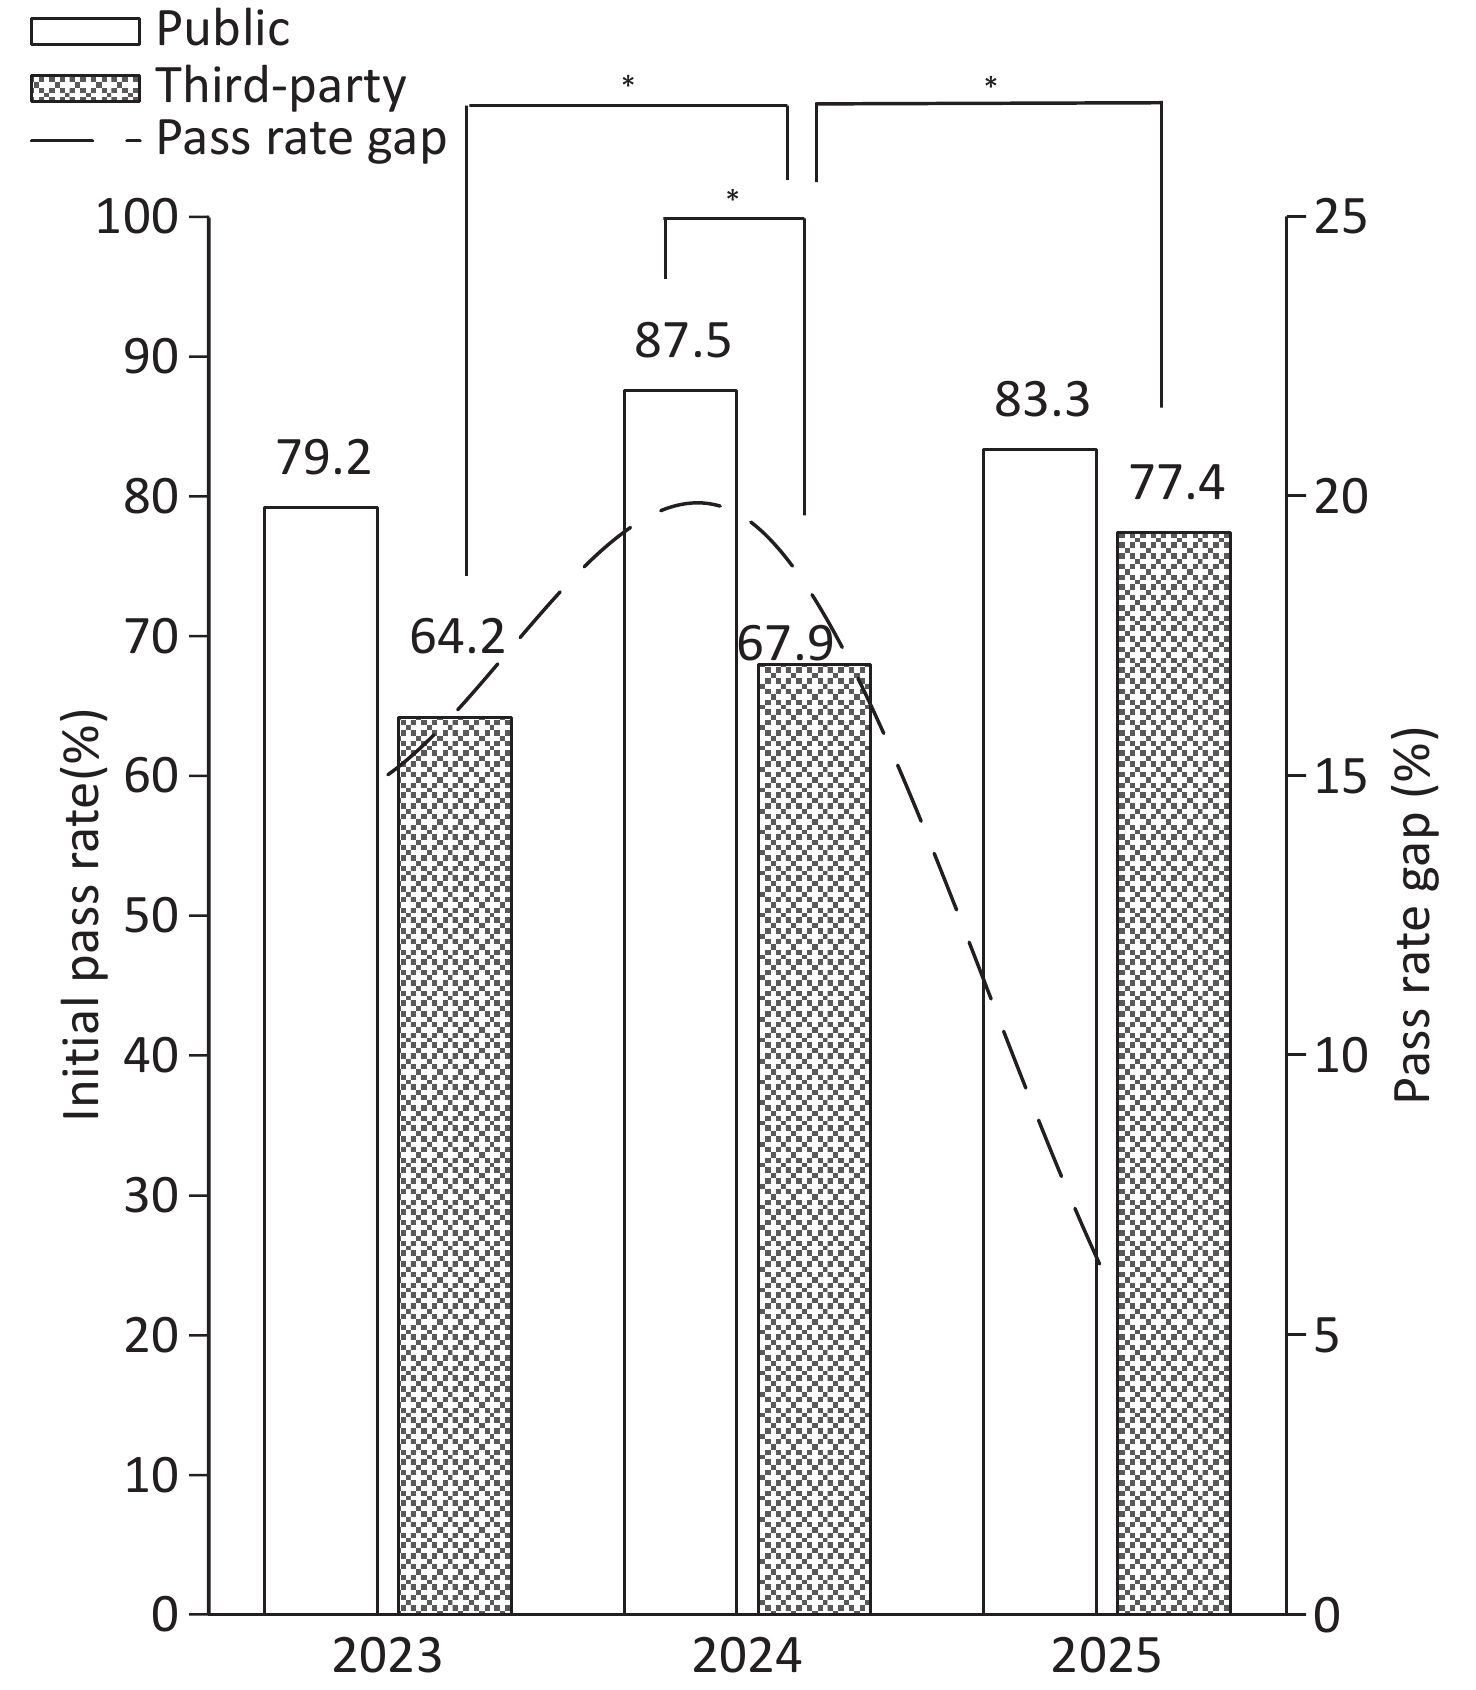
In addition to measurement errors, the composition of laboratories merits attention. Supplementary Table S2 and Figure 1 compare the performance of 48 public institutions and 53 third-party institutions from 2023 to 2025. Public laboratories consistently achieved higher compliance rates than third-party laboratories. In 2023, public laboratories recorded an initial pass rate of 79.2% (38/48), which increased to 87.5% (42/48) in 2024 and then modestly declined to 83.3% (40/48) in 2025. Conversely, the compliance rates for third-party institutions were 64.2% (34/53) in 2023, 67.9% (36/53) in 2024, and 77.4% (41/53) in 2025 (Supplementary Table S2). Although third-party initial pass rates remained lower than those of public institutions each year, the performance gap narrowed considerably over the study period, decreasing from 15.0 to 5.9 percentage points by 2025 (Figure 1). Supplementary Figure S3 illustrates trends in the measurement accuracy of urinary sodium and potassium.
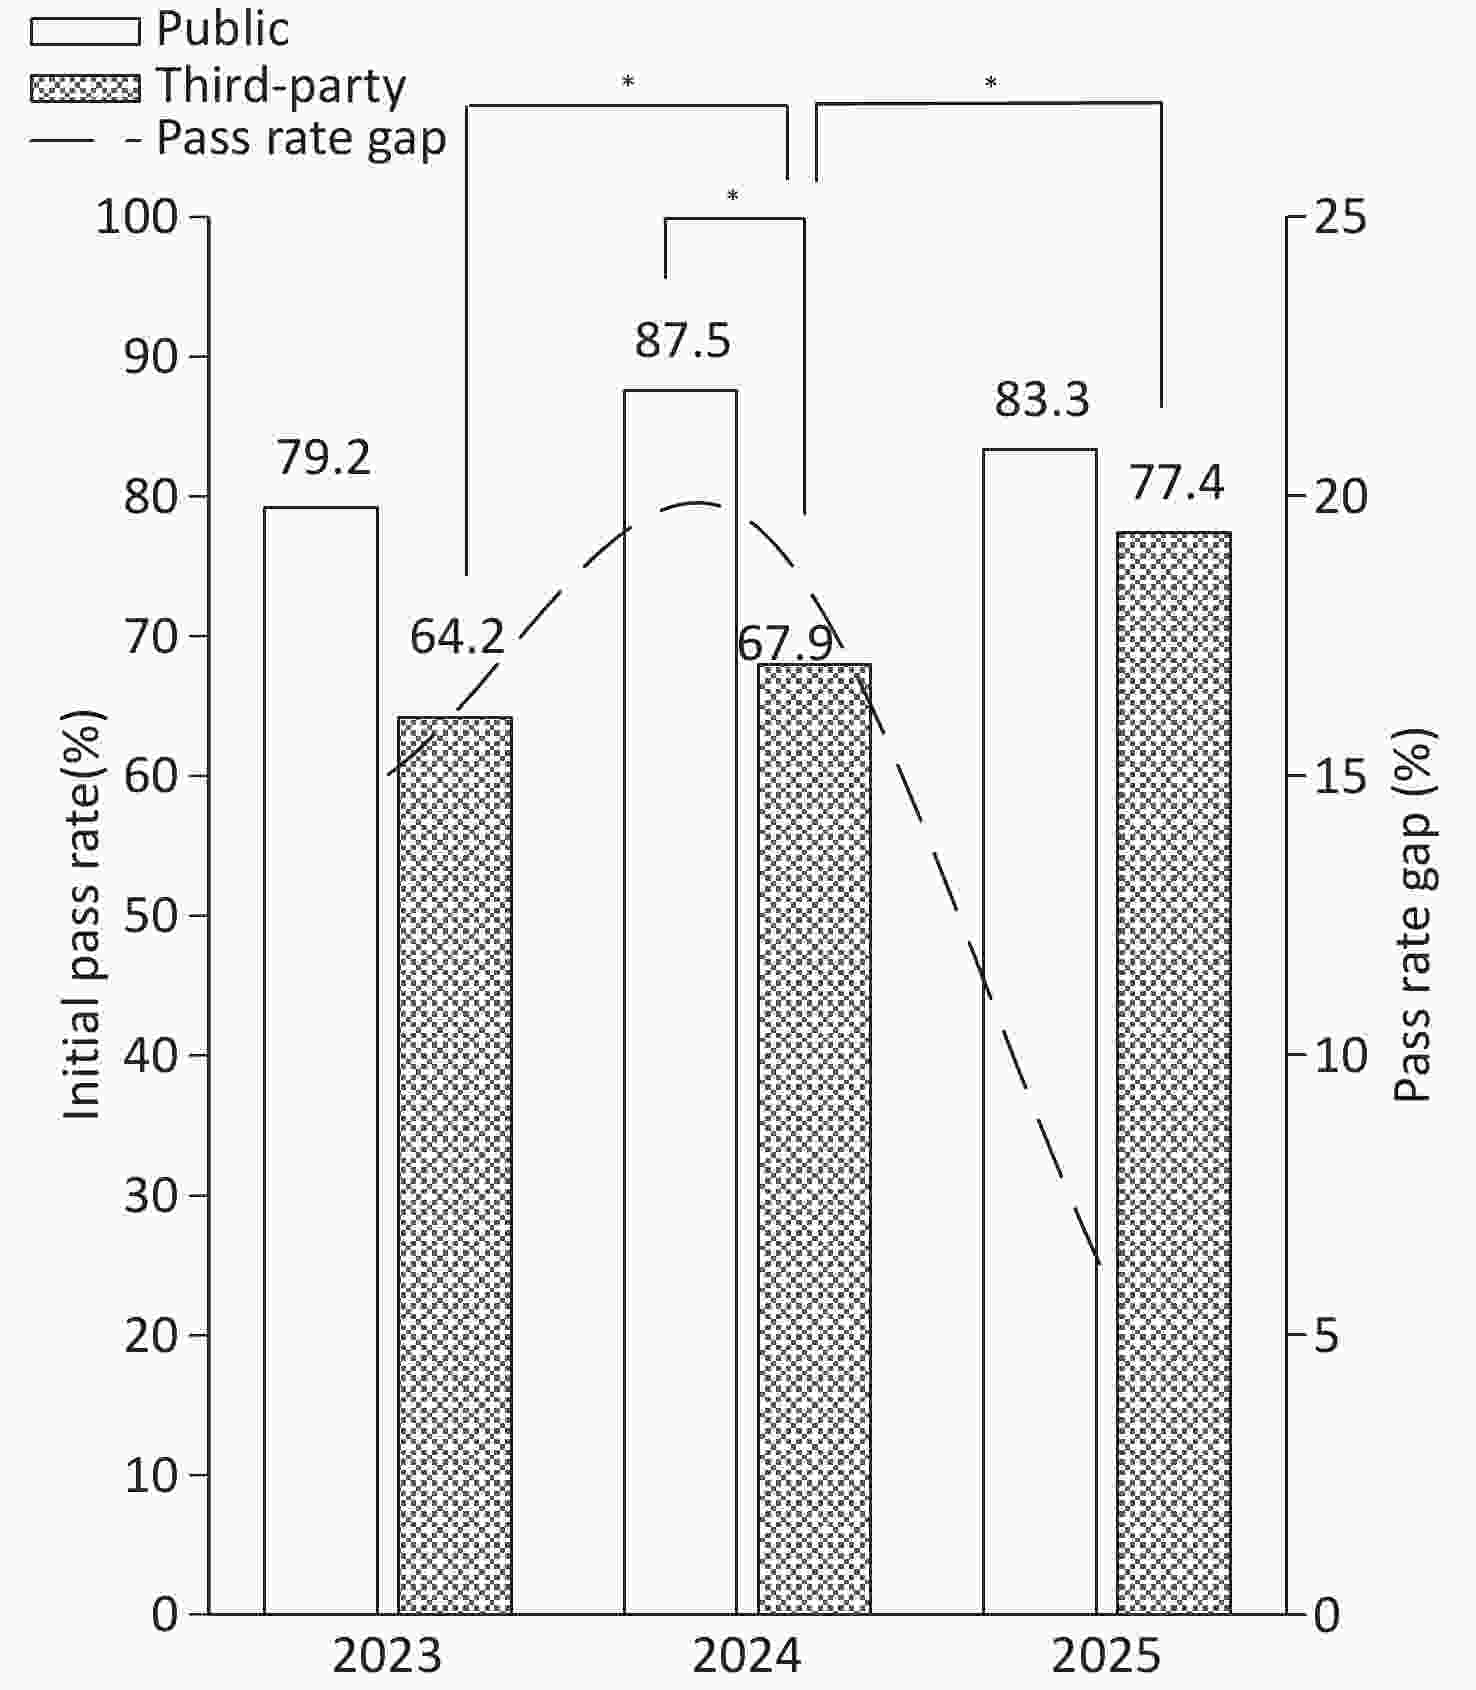
Figure 1. 补充
The established SRFC quality supervision framework effectively ensures the comparability of multi-center testing data. Interviews with the surveillance laboratories indicated that the ‘correction’ process can be approached from the following aspects:
1. Limitations of Sample Homogeneity. Due to the large volume of 24-hour urine collections, uneven distribution or settling of analytes, such as potassium and sodium, may lead to variations in concentration across different sample portions[5], thereby affecting measurement accuracy. To ensure reliable sampling, it may be necessary to increase the number of aliquots collected from the homogenized samples.
2. Relative errors may also arise when the designated ISE method is not used and laboratories instead employ other techniques such as enzymatic assays, flame atomic absorption spectroscopy[6] , or mass spectrometry[7]. Furthermore, portable ISE devices systematically underestimate 24-hour urinary sodium and potassium excretion, with reported biases of approximately 12% for sodium intake and 15% for potassium intake, compared to standard laboratory methods[8], underscoring the influence of device type and analytical platform on measurement outcomes.
3. Inadequate Calibration Frequency. For electrolyte assays involving sodium and potassium, which are highly susceptible to electrode drift, calibration prior to each analytical run is ideally required to ensure accurate results[9].
4. Potential for Cross-Contamination. Carryover contamination can arise during electrolyte testing because of residual potassium or sodium ions present in many biochemical reagents. To mitigate this, increasing the number of automated washing steps between samples is recommended to ensure thorough cleaning of the probe, cuvette, and fluidic pathways. Additionally, blank samples within each analytical batch served as controls to monitor and assess the extent of carryover contamination.
The SRFC quality supervision framework developed and validated in this study merits standardization and incorporation into the technical guidelines of relevant national surveillance programs. By strengthening the metrological foundation of dietary sodium assessment, this framework contributes to more accurate surveillance data, more precisely targeted interventions, and a more robust evaluation of population-level salt reduction efforts.
However, this study had several limitations. First, it employed a longitudinal observational design without a control group; therefore, causal inferences cannot be drawn from the observed improvements. Second, the quality control mechanism established in this study may face challenges in resource-limited settings. Requirements such as frequent calibration and split-sample testing can increase operational costs, and the long-term sustainability of this approach warrants further validation for real-world applications.
Future studies should explore standardized pre-analytical procedures and develop structured questionnaires covering aspects such as sample preparation protocols, instrument performance verification, reagent lot validation, calibration records, operator competency assessments, and environmental controls[10]. Such tools can assist technical staff in identifying specific directions for quality improvement.
HTML
Competing Interests The authors have no relevant financial or nonfinancial interests to disclose.
Ethics This study observed the “Measures for the Ethical Review of Biomedical Research Involving Human Subjects” and “Measures for the Ethical Review of Life Sciences and Medical Research Involving Human Subjects” regulations. The study protocol was approved by the Medical Ethics Committee of the Chinese Center for Disease Control and Prevention (approval number: 2022J01).
Authors’ Contributions Xiaozhe Tang and Kuke Ding conceived the study; Jinping Zhao, Huan Luo, Fanghong Zhao, and Xiaoyan Chang performed the experiments; Jing Liang and Huan Luo performed the data analysis; Jing Liang wrote the manuscript; Xin Xin and Xiaozhe Tang reviewed and edited the manuscript. All authors contributed to and approved the submitted manuscript.
Data Sharing The Supplementary materials are available at www.besjournal.com.
&These authors contributed equally to this work.
Reference

 Quick Links
 DownLoad: