
-
Chronic hepatitis B virus (HBV) infection is a major global public health concern. An estimated 296 million individuals are infected worldwide, with 1.5 million new cases each year[1] and approximately 786,000 annual deaths attributed to HBV-related complications[2]. Chronic hepatitis B (CHB) management typically involves reverse transcriptase inhibitors (nucleoside or nucleotide analogs [NAs]) and interferon (IFN) therapy[3]; however, achieving a clinical cure remains challenging. CHB is characterized by the persistence of covalently closed circular DNA (cccDNA), a stable minichromosomal form of the HBV genome, within the nuclei of infected hepatocytes[4]. Following treatment discontinuation or immune suppression, HBV cccDNA can replicate within hepatocytes, potentially reactivating viral replication and producing intact virions[3].
Currently, hepatitis B core-related antigen (HBcrAg) and pregenomic RNA (pgRNA) are serum markers that reflect cccDNA activity[5,6], providing an indirect method to study cccDNA dynamics. Previous studies have established the distinct roles of serum HBcrAg and pgRNA levels. HBcrAg serves as an indicator of a high viral load and HBV reactivation in immunosuppressed patients[7,8]. Additionally, HBcrAg levels have been shown to predict hepatitis B e-antigen (HBeAg) seroconversion[9]. Furthermore, multiple studies have linked serum HBcrAg levels with the risk of hepatocellular carcinoma (HCC) recurrence and HBV reactivation[10-12]. Elevated HBcrAg levels in HBV carriers increase the risk of cirrhosis progression, highlighting their potential as predictors of cirrhosis development[13]. Recent studies have emphasized the significance of pgRNA levels in monitoring nucleoside analog therapy and predicting relapse following treatment discontinuation[5,14]. Whether serum pgRNA and HBcrAg levels are associated with antiviral outcomes of Peg-IFN-α therapy and virologic relapse following treatment discontinuation in patients with chronic HBV infection requires further investigation.
In this study, we evaluated serum pgRNA and HBcrAg levels, along with Peg-IFN-α antiviral outcomes, in 327 treatment-naïve patients with chronic HBV infection (initially, 371 patients were recruited from March 2020 to August 2023, with 44 lost to follow-up). Furthermore, we analyzed the relationship between serum pgRNA and HBcrAg levels and Peg-IFN-α antiviral outcomes to determine their potential utility as biomarkers for predicting virologic relapse following treatment discontinuation and guiding clinical management in patients with chronic HBV infection.
-
The minimum sample size calculated under the guidance of hospital statisticians was 322. The specific parameters for sample size calculation were as follows: expected effect size (Cohen’s d) = 0.3 (small-to-moderate effect, consistent with previous studies on HBV biomarker-related clinical trials), alpha level (α) = 0.05 (two-sided), statistical power (1 - β) = 0.80, assumed virologic response rate in the overall cohort = 30% (based on prior Peg-IFN-α therapy studies in CHB patients), and assumed virologic relapse rate among responders = 15% (based on relevant literature on post-IFN-α relapse in CHB). A total of 371 treatment-naïve patients with chronic HBV infection were enrolled in this study from March 2020 to August 2023 at the Beijing Ditan Hospital, Beijing, China. During the 48-week Peg-IFN-α treatment and subsequent follow-up, 44 patients were lost to follow-up (due to non-compliance with treatment, failure to complete regular re-examinations, or voluntary withdrawal of consent). Therefore, the final analysis of treatment response and post-treatment relapse was based on 327 patients who completed the full follow-up period, which was consistent with the population described in the Results section. All patients tested positive for hepatitis B surface antigen (HBsAg) for more than six months with detectable HBV DNA > 2,000 IU/mL in HBeAg-positive patients or > 200 IU/mL in HBeAg-negative patients. Biochemical, serological, and virological parameters were assessed at baseline. All patients were treatment-naïve and underwent Peg-IFN-α therapy (subcutaneous injection, 180 μg/week) for 48 weeks, according to the Chinese guidelines for the prevention and treatment of chronic hepatitis B (version 2022). Subsequently, all enrolled patients were followed up every 3 months during peg-IFN-α treatment and after its discontinuation to evaluate antiviral efficacy and monitor for virologic relapse. Virologic relapse was defined as HBV DNA > 2 × 10³ IU/mL in both tests conducted one month apart after treatment discontinuation in patients who had achieved a virologic response. Exclusion criteria included: (i) coinfection with hepatitis C virus (HCV), hepatitis D virus (HDV), or human immunodeficiency virus (HIV); (ii) diagnosis of HCC confirmed by ultrasound or CT within 6 months prior to enrollment; and (iii) prior or current IFN-α or nucleoside analog therapy. The Institutional Review Board of Beijing Ditan Hospital approved this study (reference number: 2020-013-02), and written informed consent was obtained from all participants. Peripheral blood samples from the enrolled patients were stored at the Biobank of Clinical Resources of Beijing Ditan Hospital, Capital Medical University. During treatment and subsequent follow-ups, relevant indicators were regularly monitored to evaluate antiviral efficacy and treatment safety. Antiviral response assessment: The virologic response was assessed at week 24 in HBeAg-positive patients and at week 12 in HBeAg-negative patients, which was defined as a serum HBV DNA level less than 200 IU/mL without severe adverse events requiring treatment cessation. Liver function monitoring: Serum ALT and AST were detected at baseline and at 3, 6, and 12 months of treatment and during post-treatment follow-up to observe dynamic changes and evaluate treatment safety. All related findings are presented in the Results section.
-
Biochemical, serological, and virologic parameters were analyzed using standard laboratory procedures. HBV serology tests included HBsAg, anti-HBs, HBeAg, anti-HBe, and anti-HBc tests. Serum HBsAg levels were measured using a commercially available kit (Abbott Architect HBsAg QT assay; Abbott Laboratories, Lake Bluff, IL, USA). Serum HBV DNA levels were quantified using real-time polymerase chain reaction (COBAS TaqMan HBV Test v2.0; Roche Diagnostics, Basel, Switzerland). Upper normal limits were defined as 40 IU/mL for serum alanine aminotransferase (ALT) and 35 IU/mL for serum aspartate aminotransferase (AST), according to local laboratory standards. The threshold for HBV DNA positivity was set at 20 IU/mL.
-
Serum HBcrAg levels were quantified using the Human HBcrAg ELISA Kit (Jianglai Industrial Limited by Share Ltd., Shanghai, China) employing a double-antibody, one-step sandwich enzyme-linked immunosorbent assay (ELISA) method. Testing was performed according to the manufacturer's instructions. Briefly, microtiter wells pre-coated with anti-HBcrAg monoclonal antibodies were treated with specimens or standard samples. Horseradish peroxidase (HRP)-conjugated antibodies were added to each well. After incubation at 37 °C for 60 min and washing, a tetramethylbenzidine (TMB) chromogen solution was added. Following a 15-minute incubation at 37 °C in the dark, a stop solution was added. The optical density (OD) was measured at 450 nm within 15 min using a microtiter plate reader (Varioskan Flash, Thermo Scientific, USA). All serum samples were aliquoted and stored at −80°C until testing. Results are reported in log10 U/mL for consistency with major studies.
-
Serum pgRNA levels were quantified using an HBV RNA assay kit (Hotgen Biotech, Beijing, China) employing a PCR-fluorescence probe method. This assay utilizes magnetic beads for HBV RNA extraction from serum and targets conserved HBV RNA regions. The detection reagent contained a reverse transcription primer, specific amplification primers, a fluorescent probe, reverse transcription polymerase chain reaction (RT-PCR) buffer, Taq enzyme, and reverse transcriptase. One-step RT-PCR was performed using a real-time fluorescence quantitative PCR instrument (Roche LightCycler 480 II). The assay was performed according to the manufacturer’s instructions. All serum samples were aliquoted and stored at -80°C until analysis. The detection limit was 50 copies/mL.
-
Statistical analyses were conducted using GraphPad Prism (version 8.2.0; La Jolla, CA, USA), SPSS (version 22.0; SPSS, Inc., Chicago, IL, USA), and MedCalc version 19.2.0 (MedCalc Software, Ostend, Belgium). Data are presented as follows: normally distributed data as mean ± standard deviation (SD); non-normally distributed continuous data as median (interquartile range); and categorical variables as numbers (percentages). The t-test, χ2 test, or Mann-Whitney U test was used to determine significance between groups. Logistic regression analysis was used to assess the correlations among age, sex, pgRNA, HBcrAg, HBsAg, HBeAg, HBV DNA, ALT, AST, total bilirubin (TBIL), albumin (ALB), prothrombin activity (PTA), white blood cell (WBC) count, red blood cell (RBC) count, hemoglobin (HGB), platelet (PLT) count, and antiviral outcomes. Areas under the reciever operating characteristic (ROC) curves with 95% confidence intervals (CIs) were calculated using SPSS version 22.0 and MedCalc version 19.2.0. Statistical significance was accepted for P-values < 0.05. Asterisks denote significance levels: *P < 0.05, **P < 0.01.
-
Table 1 summarizes the baseline characteristics of the 327 patients. The cohort comprised 209 (63.91%) male and 118 (36.09%) female patients (median age: 42 years [IQR, 35–52]). Eighty-five patients (26.0%) were HBeAg positive [median HBV DNA: 6.8 log10 IU/mL (IQR, 6.2–7.5)], and 242 (74.0%) were HBeAg negative [median HBV DNA: 3.5 log10 IU/mL (IQR, 2.9–4.1)]. All patients received Peg-IFN-α therapy according to the 2022 Chinese guidelines.
Characteristics Baseline 3 months
treatment6 months
treatment12 months
treatment3 months drug
withdrawal6 months drug
withdrawal12 months drug
withdrawalWBC count (×109/L) 5.23 ± 1.70 3.18 ± 0.91 2.61 ± 0.62 2.43 ± 0.54 4.61 ± 1.07 5.43 ± 1.56 5.56 ± 1.38 RBC count (×1012/L) 4.50 ± 0.62 4.44 ± 0.64 4.37 ± 0.59 4.56 ± 0.66 4.68 ± 0.65 4.62 ± 0.55 4.64 ± 0.73 HGB (g/L) 147.27 ± 21.64 134.91 ± 21.28 134.40 ± 23.63 137.32 ± 21.44 141.38 ± 18.20 145.57 ± 19.23 148.52 ± 19.13 PLT count (×109/L) 204.43 ± 80.68 125.23 ± 41.32 127.03 ± 45.91 120.78 ± 42.47 198.76 ± 73.37 221.54 ± 79.14 211.62 ± 81.12 ALT, U/L (median) 26.05
(20.13–46.25)51.10
(27.15–74.45)**63.70
(37.50–90.00)**43.37
(29.26–60.80)*36.35
(23.33–58.30)31.24
(20.18–41.27)25.46
(18.69–37.97)AST, U/L (median) 24.65
(18.75–37.43)40.90
(26.50–58.75)**44.40
(31.80–66.30)**36.46
(25.54–56.32)*29.23
(21.04–43.26)25.20
(21.77–30.05)22.55
(19.41–31.14)TBIL (µmol/L, Mean ± SD) 13.21 ± 5.23 11.73 ± 3.49 10.87 ± 3.40 10.75 ± 3.16 11.17 ± 3.76 13.36 ± 4.18 13.25 ± 4.14 DBIL(µmol/L, Mean ± SD) 4.51 ± 2.19 4.31 ± 1.39 3.78 ± 1.34 3.63 ± 1.06 4.22 ± 1.85 4.65 ± 1.47 4.33 ± 2.06 ALB (g/L, Mean ± SD) 47.13 ± 2.92 45.34 ± 2.88 46.10 ± 3.14 45.61 ± 2.61 47.29 ± 4.68 46.78 ± 3.99 46.42 ± 5.15 PTA (Mean ± SD) 95.15 ± 11.52 99.14 ± 6.60 97.65 ± 5.28 95.24 ± 7.34 98.60 ± 7.81 96.21 ± 5.66 97.88 ± 8.77 HBsAg (log10) (median) 2.63
(1.33–3.48)2.90
(1.08–3.46)2.68
(1.27–2.28)1.84
(0.78–2.27)1.96
(0.85–2.43)2.38
(1.15–2.85)2.59
(1.24–3.56)HBeAg positive/negative 85/242 80/247 76/251 69/258 62/265 57/270 53/274 pgRNA(log10) (median) 2.90
(1.99–4.38)2.43
(1.57–2.81)2.13
(1.66–3.04)1.92
(1.30–2.78)1.49
(1.30–1.96)1.79
(1.30–2.53)1.94
(1.3–2.68)HBcrAg,log U/mL (median) 31.36
(14.24–55.80)27.78
(11.14–77.38)38.94
(10.55–130.19)15.16
(6.05–26.62)12.51
(4.85–20.92)12.84
(4.29–22.67)22.15
(9.26–53.43)HBV-DNA (log10) (median) 3.86
(2.69–6.35)3.14
(1.93–5.68)2.82
(1.72–3.57)1.72
(1.35–2.45)1.68
(1.36–2.23)1.76
(1.43–2.56)2.35
(1.51-3.27)Note. HBV, hepatitis B virus; WBC, white blood cell; RBC, red blood cell; HGB, hemoglobin; PLT, platelet; ALT, alanine aminotransferase; AST, aspartate aminotransferase; TBIL, total bilirubin; DBIL, direct bilirubin; ALB, albumin; PTA, prothrombin activity; HBsAg, hepatitis B surface antigen; HBeAg, hepatitis B e-antigen; pgRNA, pregenomic RNA; HBcrAg, hepatitis B core-related antigen. *P < 0.05, **P < 0.01. Statistical comparisons utilized the Mann–Whitney U test for continuous variables and χ² test for categorical variables. Table 1. Baseline characteristics of treatment-naïve patients with chronic hepatitis B virus infection
-
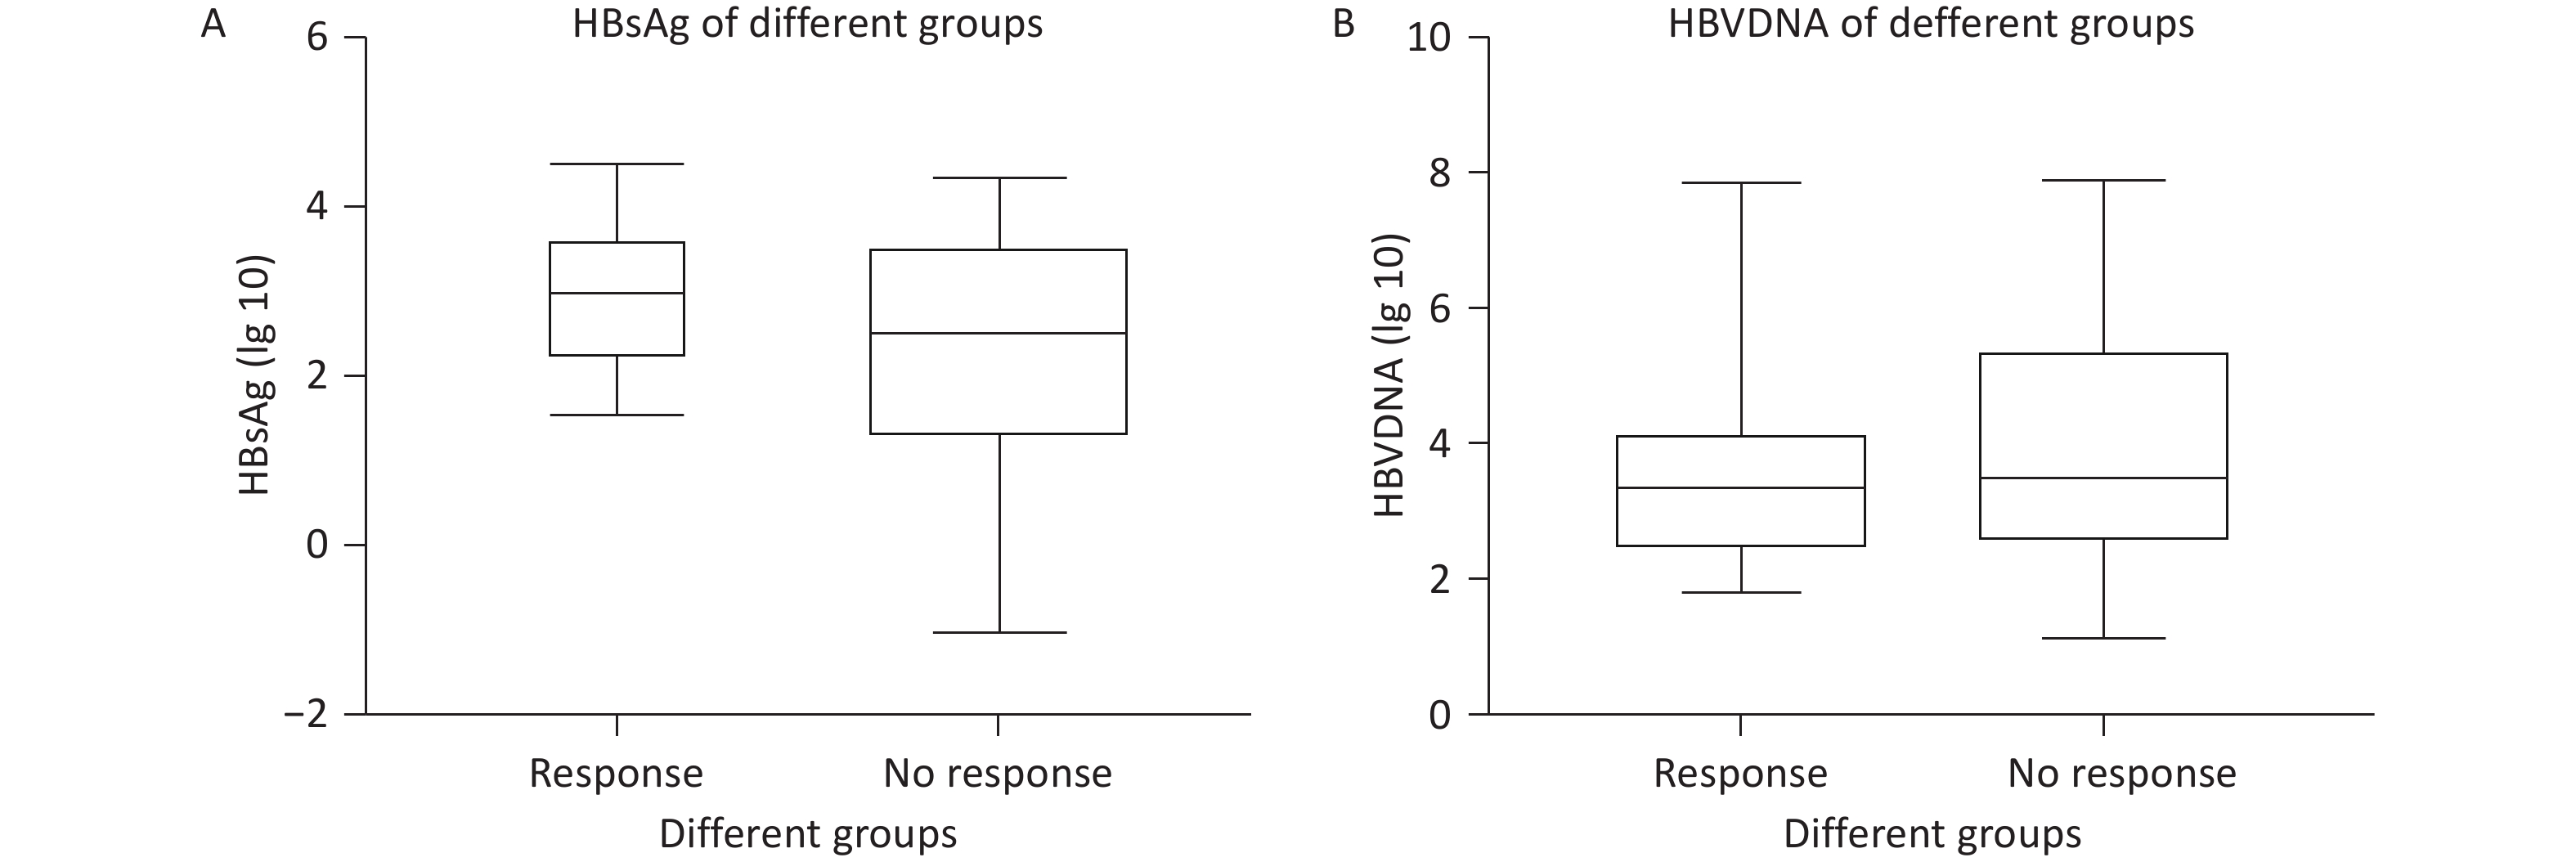
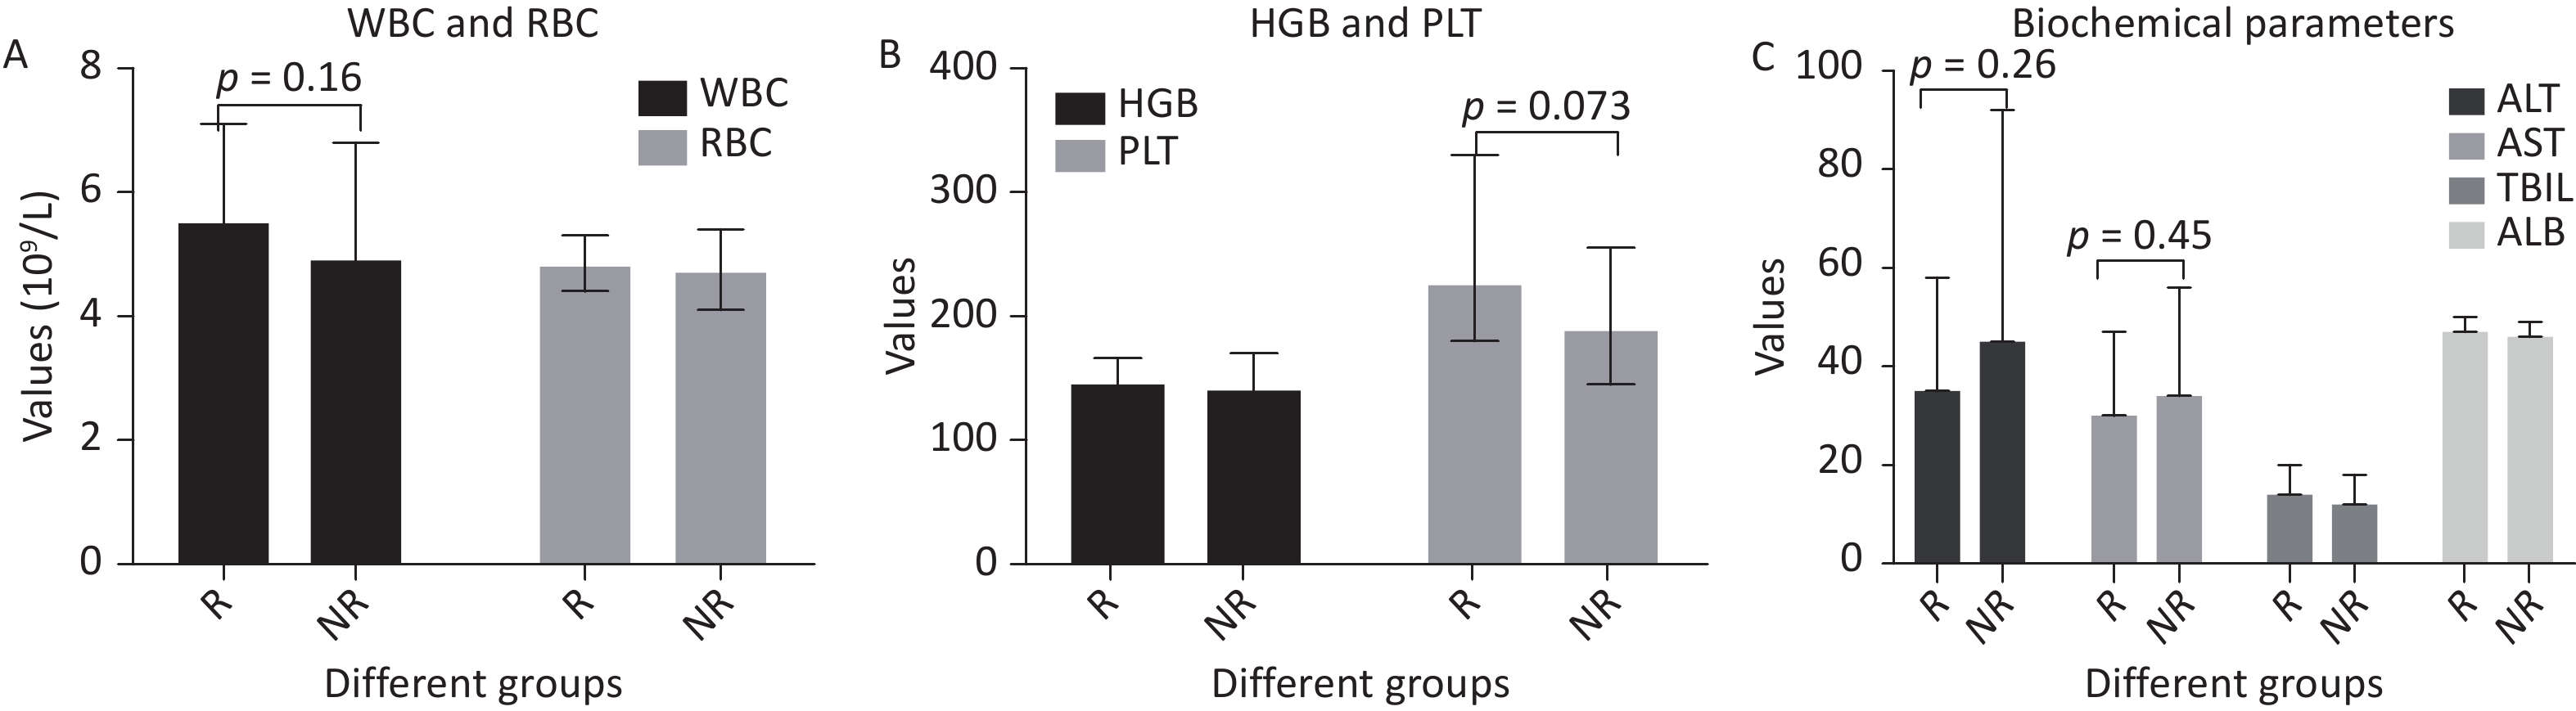
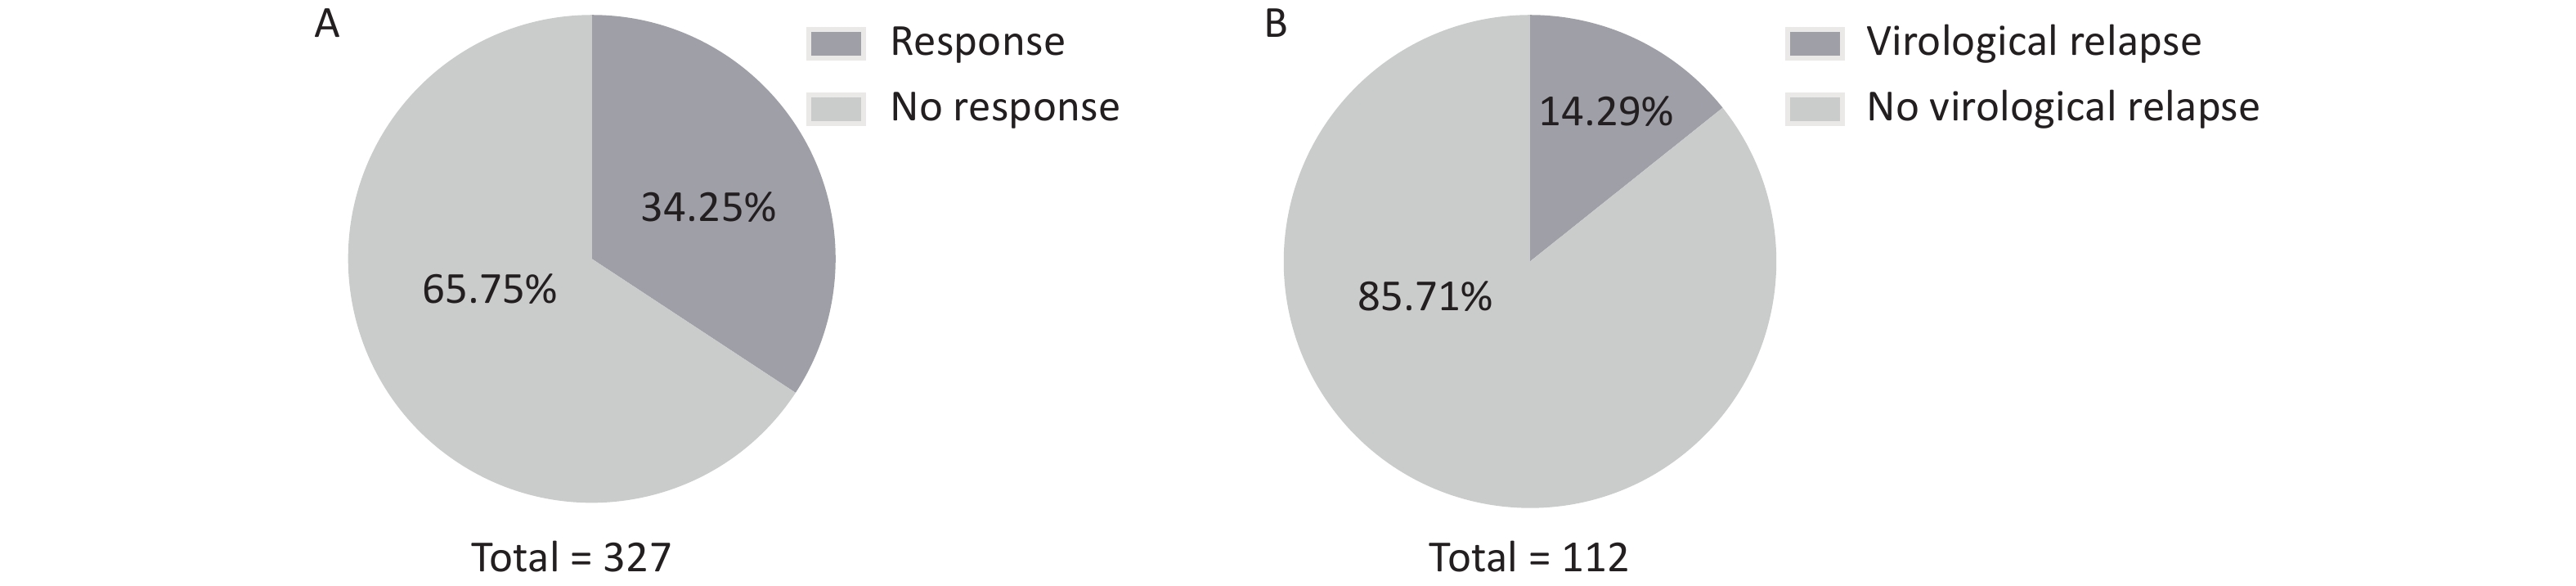
A total of 327 patients underwent regular follow-up. Virologic response was assessed at week 24 for HBeAg-positive patients and at week 12 for HBeAg-negative patients, uniformly defined as a serum HBV DNA level < 200 IU/mL without severe adverse events requiring treatment cessation. Among them, 112 patients (34.25%) achieved a virologic response (Figure 1A), which was consistent with previous real-world studies. During a median follow-up of 12 months after treatment discontinuation, virologic relapse occurred in 16 of the 112 responders, with a relapse rate of 14.29% (16/112) (Figure 1B). Virologic relapse was defined as HBV DNA > 2,000 IU/mL in two consecutive tests with a one-month interval after treatment cessation. No significant differences were observed in baseline HBsAg and HBV DNA levels (Figure 2), liver biochemical parameters, or routine blood cell counts (WBC, RBC, HGB, and PLT) (Figure 3) between the virological response and non-response groups.
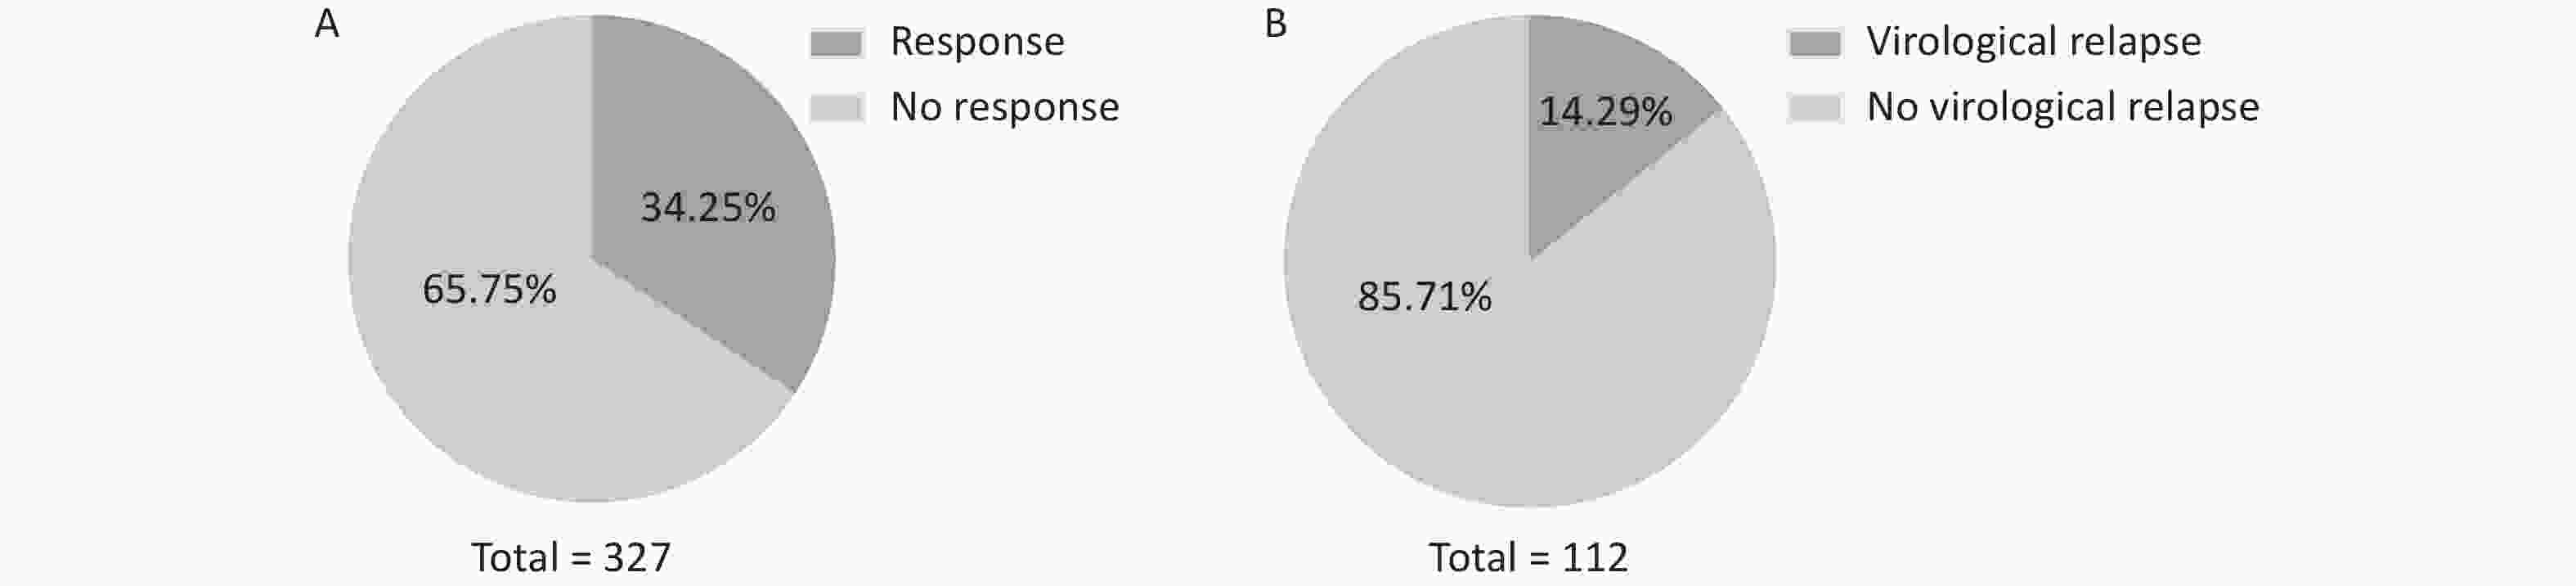
Figure 1. Virologic response and post-treatment virologic relapse following Peg-IFN-α therapy in patients with CHB. (A) Among 327 patients with chronic hepatitis B (CHB), 112 (34.25%) achieved a virologic response to pegylated interferon-alpha (Peg-IFN-α) therapy. (B) Post-Peg-IFN-α virologic relapse occurred in 16 of 112 responders (14.29%).
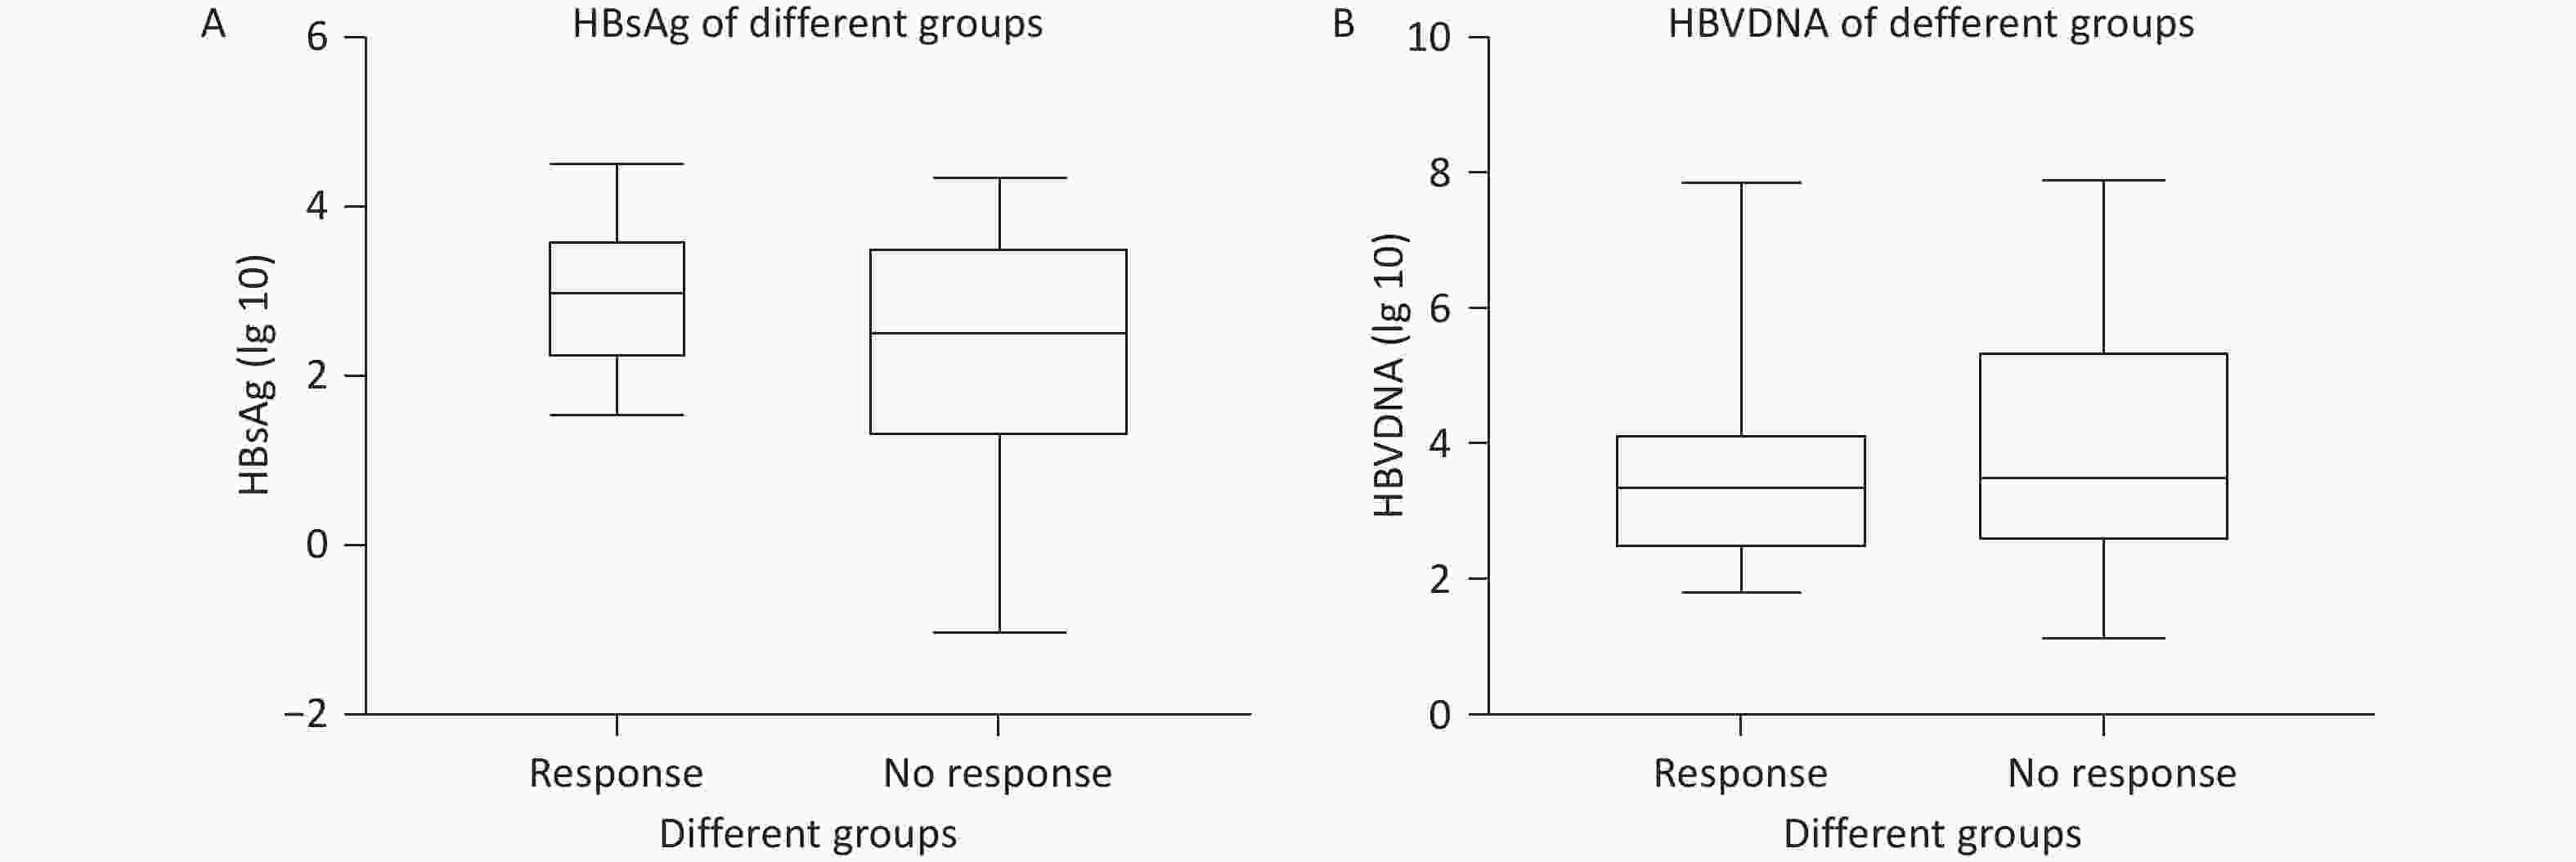
Figure 2. Comparable baseline HBsAg and HBV DNA levels between response groups. (A) Baseline HBsAg levels were similar between virologic responders and non-responders. (B) Baseline HBV DNA levels were not significantly different between the groups. HBsAg, hepatitis B surface antigen.
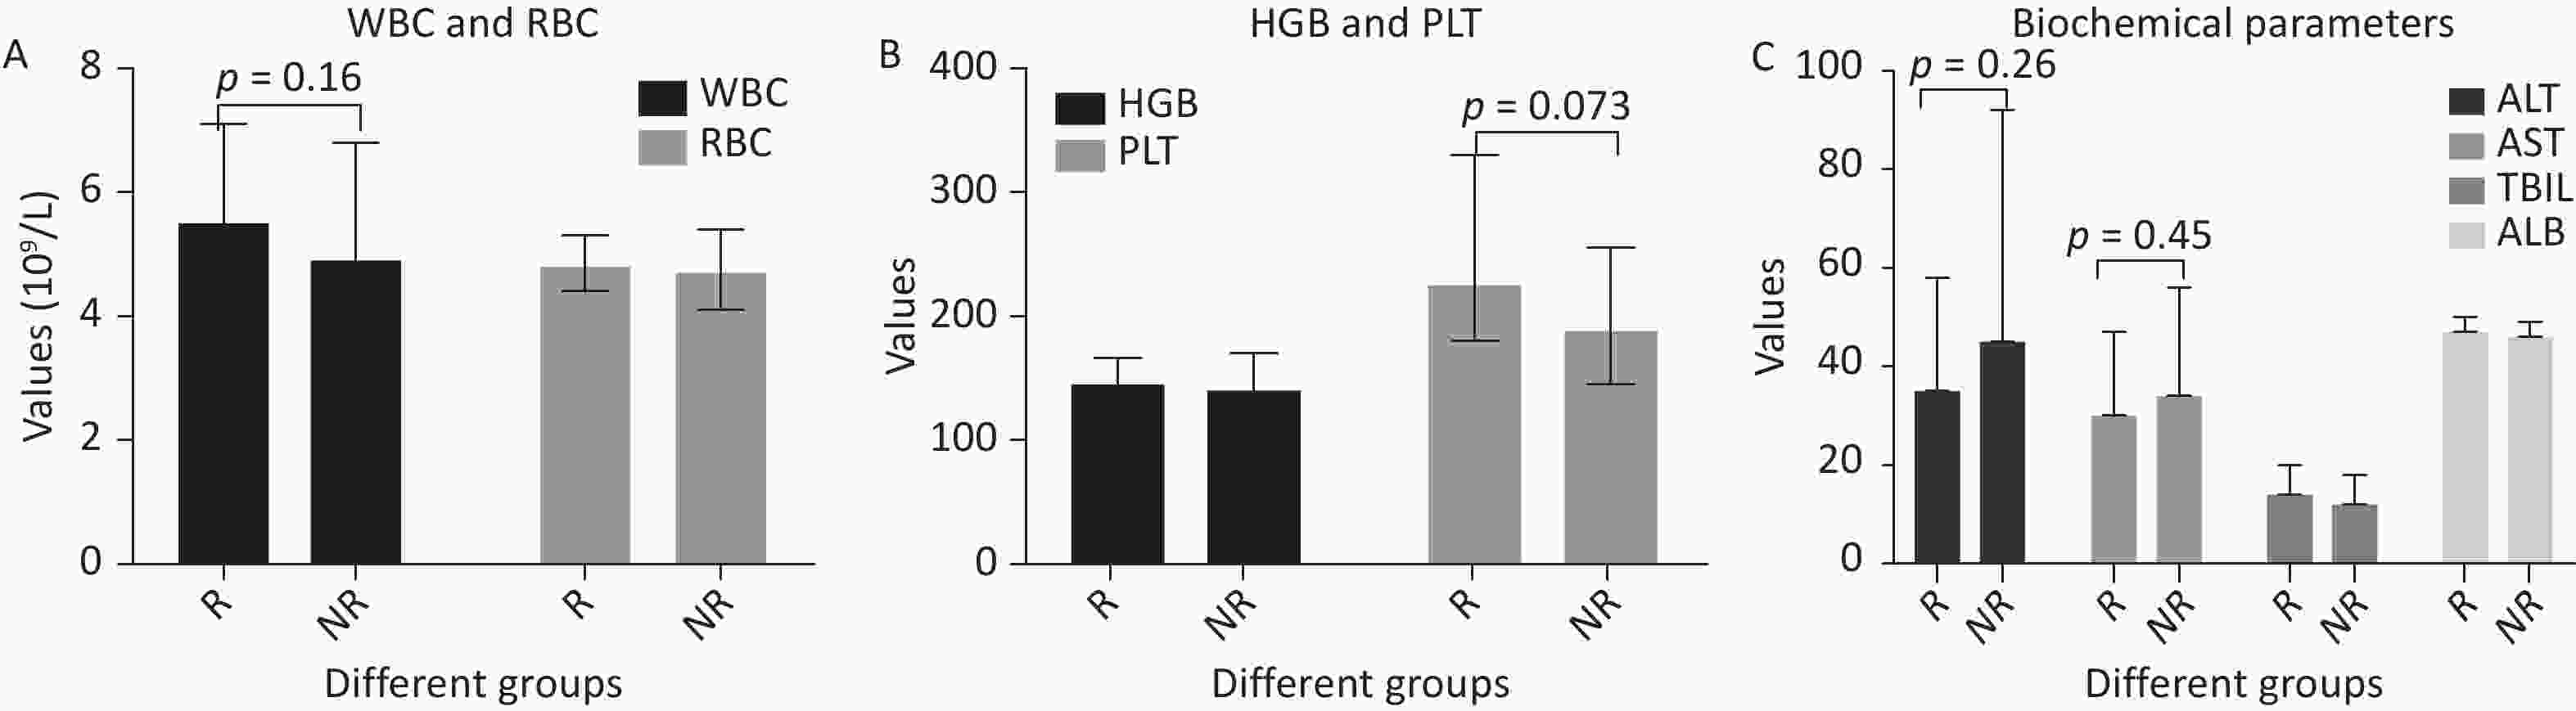
Figure 3. Equivalent baseline hematological and biochemical parameters across response groups. (A) White blood cell (WBC) and red blood cell (RBC) counts were comparable between groups. (B) Hemoglobin (HGB) levels did not differ significantly. (C) Liver biochemical markers (alanine aminotransferase [ALT], aspartate aminotransferase [AST], total bilirubin [TBIL], and albumin [ALB]) did not differ significantly between the groups. R, response group; NR, non-response group.
-
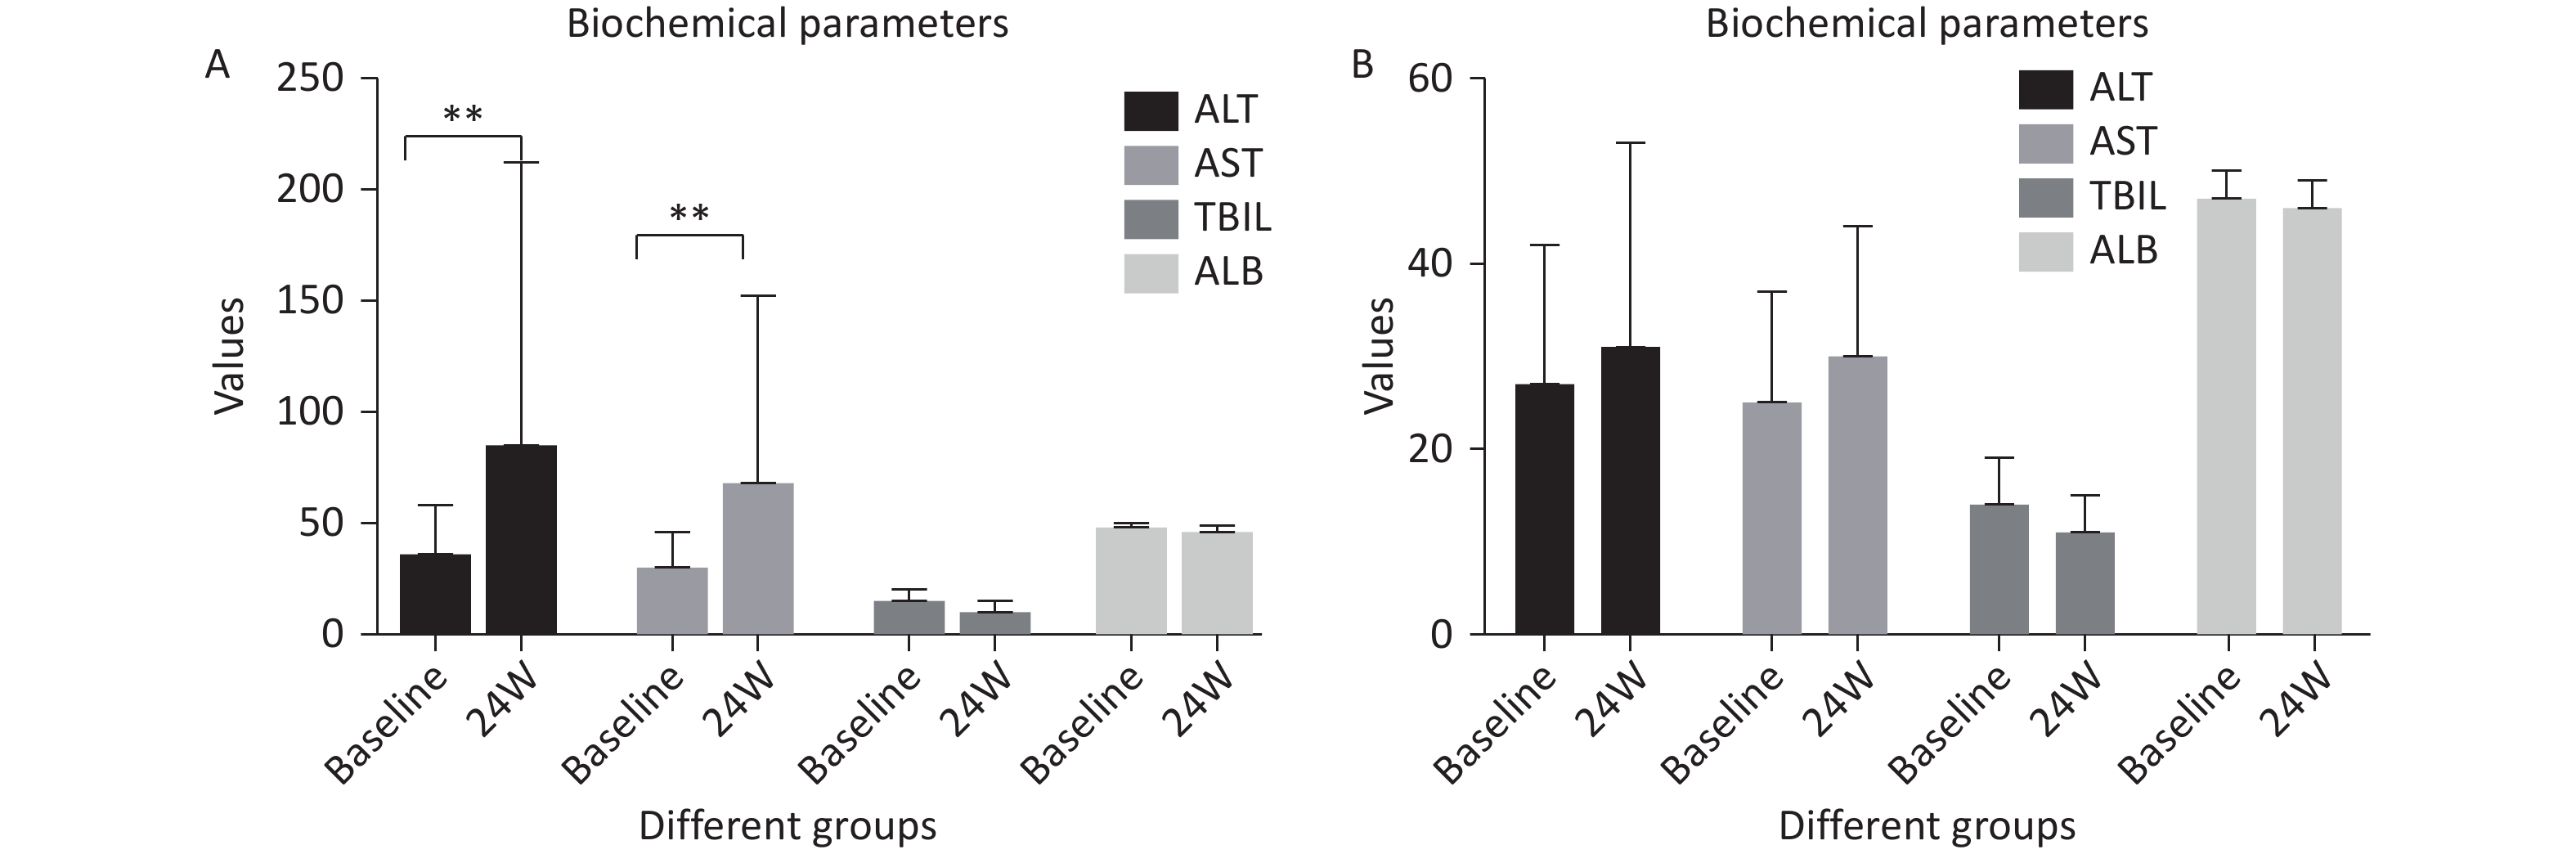
Regular monitoring of the 327 patients revealed significantly elevated ALT and AST levels during Peg-IFN-α therapy, particularly at 6 months after treatment initiation (Table 1). Subgroup analysis indicated that in the response group (n = 112), ALT and AST levels were significantly elevated at week 24 compared with baseline (P < 0.01) (Figure 4). The non-responder group also exhibited an increasing trend, although the difference was not statistically significant (Figure 4). These findings suggest that elevated transaminase levels might be associated with the response to Peg-IFN-α antiviral therapy. Most elevations were grade 1–2 (CTCAE v5.0).
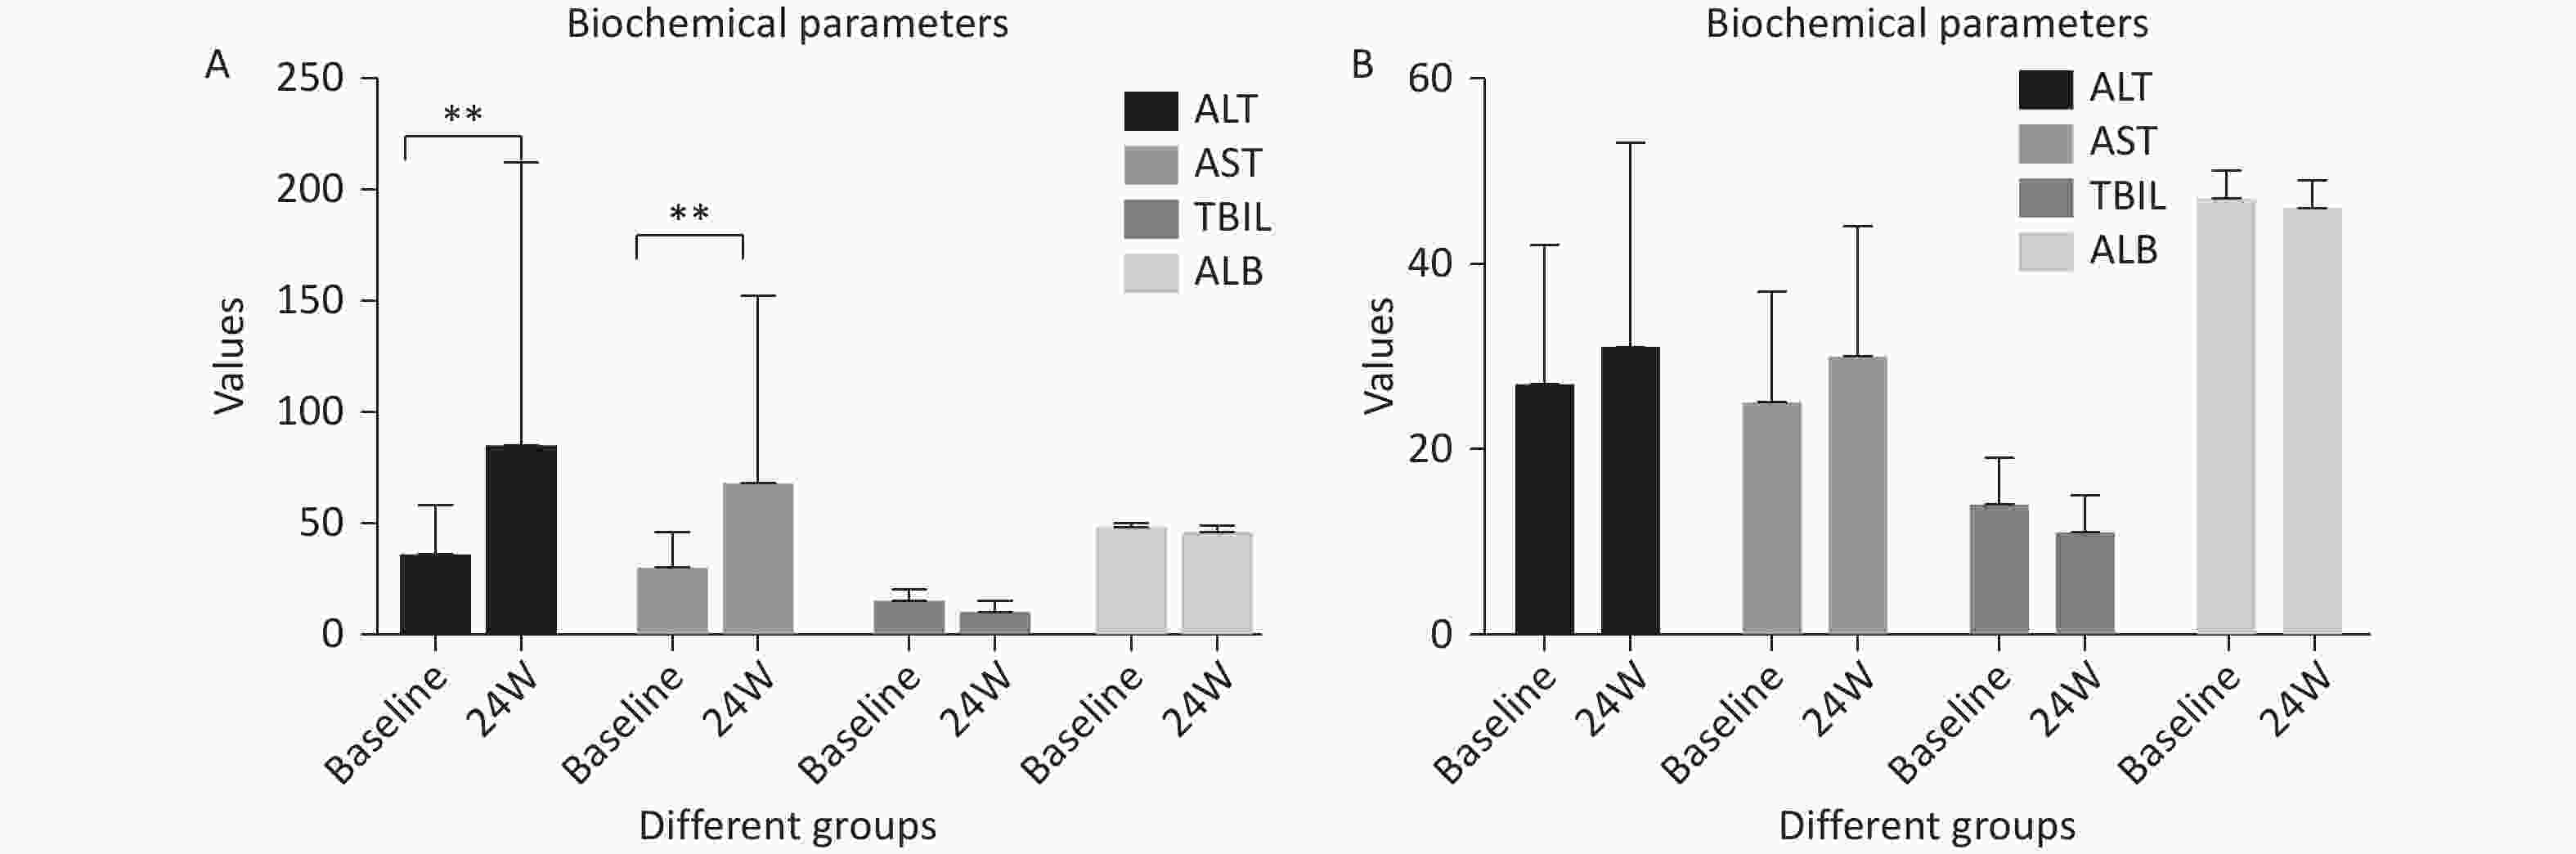
Figure 4. Transaminase dynamics during Peg-IFN-α therapy. (A) ALT and AST levels were significantly elevated compared with baseline in the response group at week 24 (P < 0.01). (B) No significant differences in transaminase activity were observed between the response and non-response groups at week 24. R, response group; NR, non-response group. ALT, alanine aminotransferase; AST, aspartate aminotransferase; TBIL, total bilirubin; ALB, albumin; Peg-IFN-α, pegylated interferon-alpha. ** P < 0.01.
-
Logistic regression analysis assessed the associations between Peg-IFN-α treatment outcomes and age, sex, HBsAg, HBeAg, pgRNA, HBcrAg, HBV DNA, ALT, AST, TBIL, ALB, PTA, WBC, RBC, HGB, and PLT. This analysis revealed inverse associations between serum pgRNA (OR, 0.571; 95% CI, 0.388–0.838), HBcrAg (OR, 0.539; 95% CI, 0.348–0.835), and HBsAg (OR, 0.356; 95% CI, 0.223–0.567) levels and Peg-IFN-α treatment outcomes (Table 2). These three markers emerged as significant risk factors associated with therapeutic outcomes, whereas age, sex, HBeAg, HBV DNA, ALT, AST, TBIL, DBIL, WBC, RBC, and HGB levels showed no significant associations.
Characteristics OR 95% CI P value Age 0.836 0.574–1.218 0.352 Gender 0.357 0.103–1.233 0.103 ALT 0.696 0.346–1.400 0.309 AST 1.880 0.945–3.743 0.072 TBIL 0.870 0.593–1.276 0.477 ALB 0.848 0.567–1.266 0.419 PTA 0.776 0.531–1.135 0.191 HBsAg 0.356 0.223–0.567 <0.001 HBV DNA 1.435 0.915–2.251 0.115 HBeAg 0.450 0.191–1.060 0.068 pgRNA 0.571 0.388–0.838 0.004 ** HBcrAg 0.539 0.348–0.835 0.006 ** WBC 0.938 0.638–1.378 0.743 RBC 0.781 0.404–1.509 0.461 HGB 0.941 0.470–1.883 0.863 PLT 1.194 0.799–1.784 0.388 Note. OR, odds ratio; CI, confidence interval; ALT, alanine aminotransferase; AST, aspartate aminotransferase; TBIL, total bilirubin; PTA, prothrombin activity; HBsAg, hepatitis B surface antigen; HBV, hepatitis B virus; HBeAg, hepatitis B e-antigen; pgRNA, pregenomic RNA; HBcrAg, hepatitis B core-related antigen; WBC, white blood cell; RBC, red blood cell; HGB, hemoglobin; PLT, platelet; **, P < 0.01. Table 2. Logistic regression analysis of factors associated with Peg-IFN-α antiviral outcomes in treatment-naïve patients with chronic hepatitis B
-
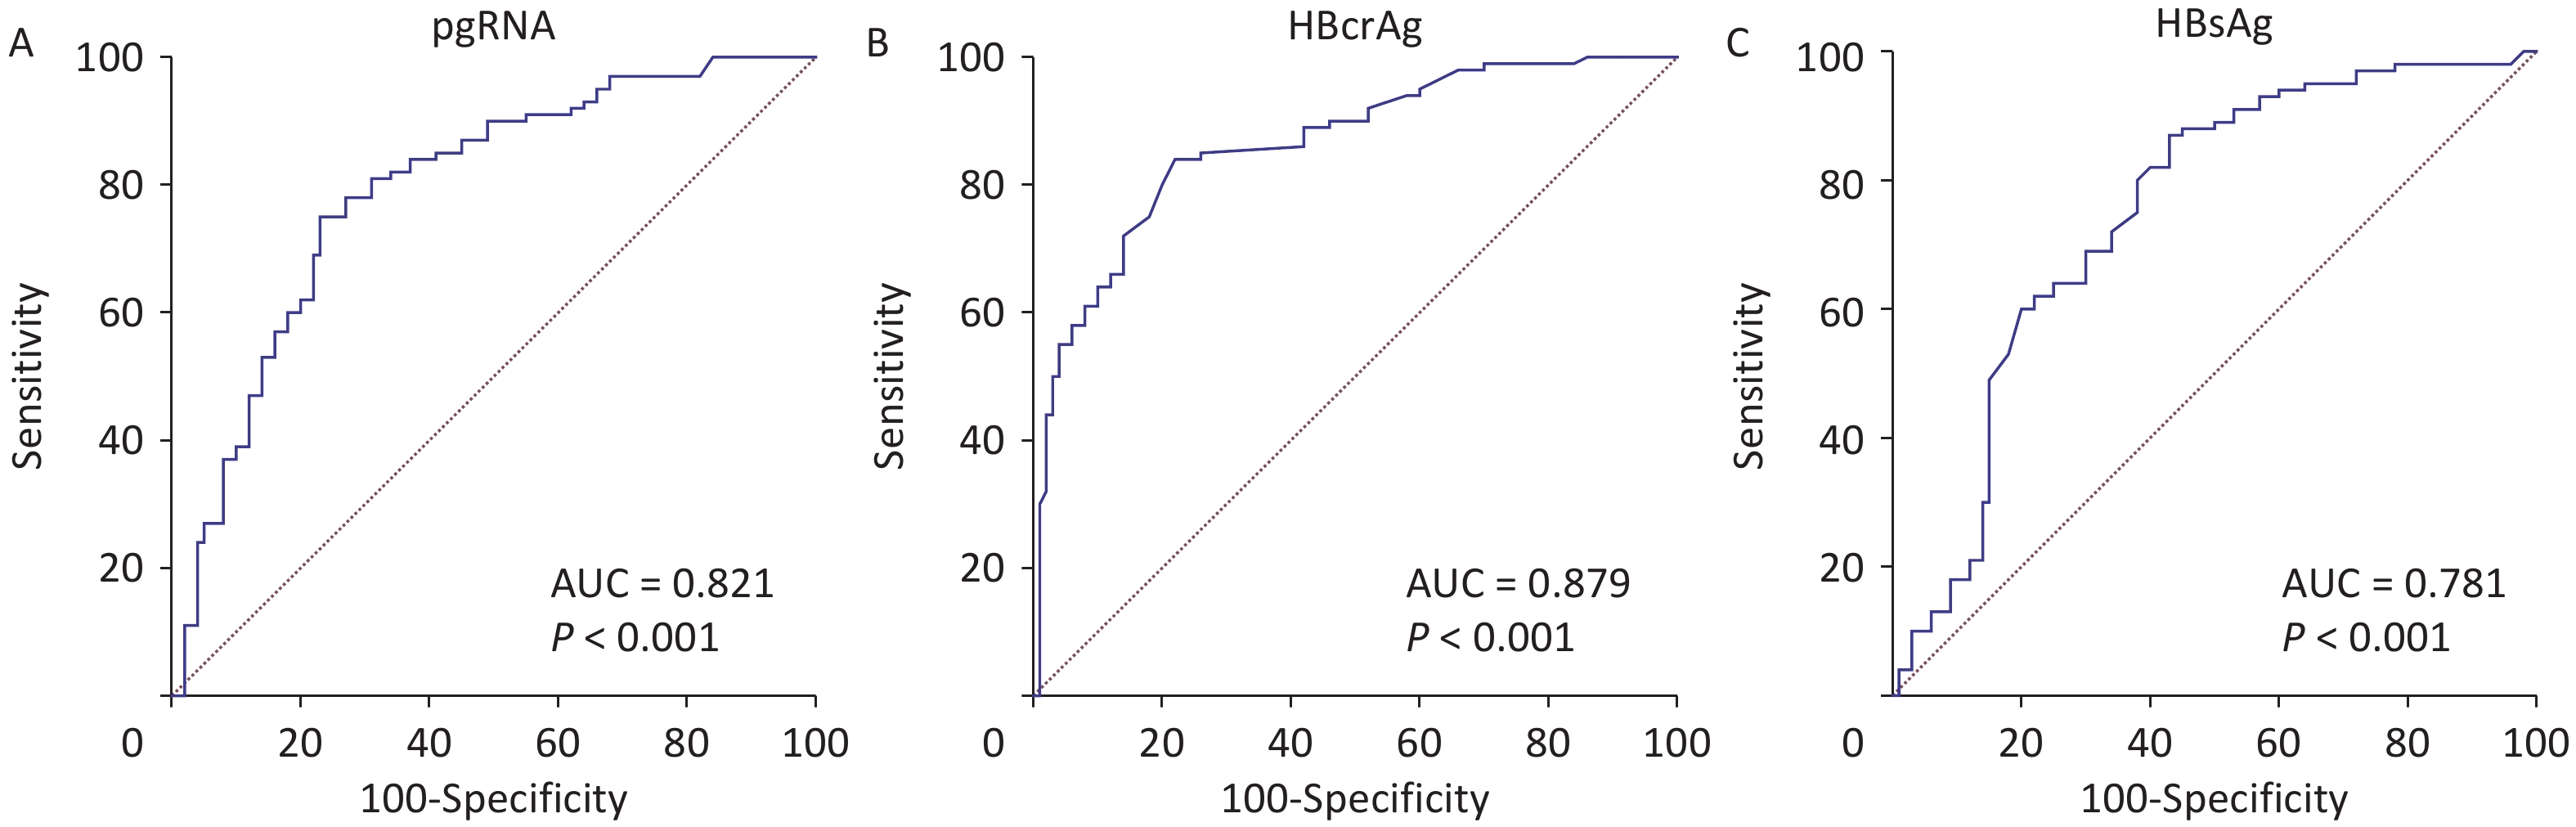
ROC curve analysis demonstrated that baseline serum pgRNA, HBcrAg, and HBsAg levels predicted Peg-IFN-α therapy efficacy. The areas under the ROC curves were 0.821 (95% CI, 0.758–0.874), 0.879 (95% CI, 0.822–0.923), and 0.781 (95% CI, 0.719–0.835), respectively (Figure 5). The optimal cutoff values were pgRNA log10 = 2.06 (sensitivity, 75%; specificity, 81.65%); HBcrAg = 28.47 mU/mL (3.45 log10 U/mL) (sensitivity, 84.7%; specificity, 79.2%); and HBsAg log10 = 3.53 (sensitivity, 80.2%; specificity, 64.2%).
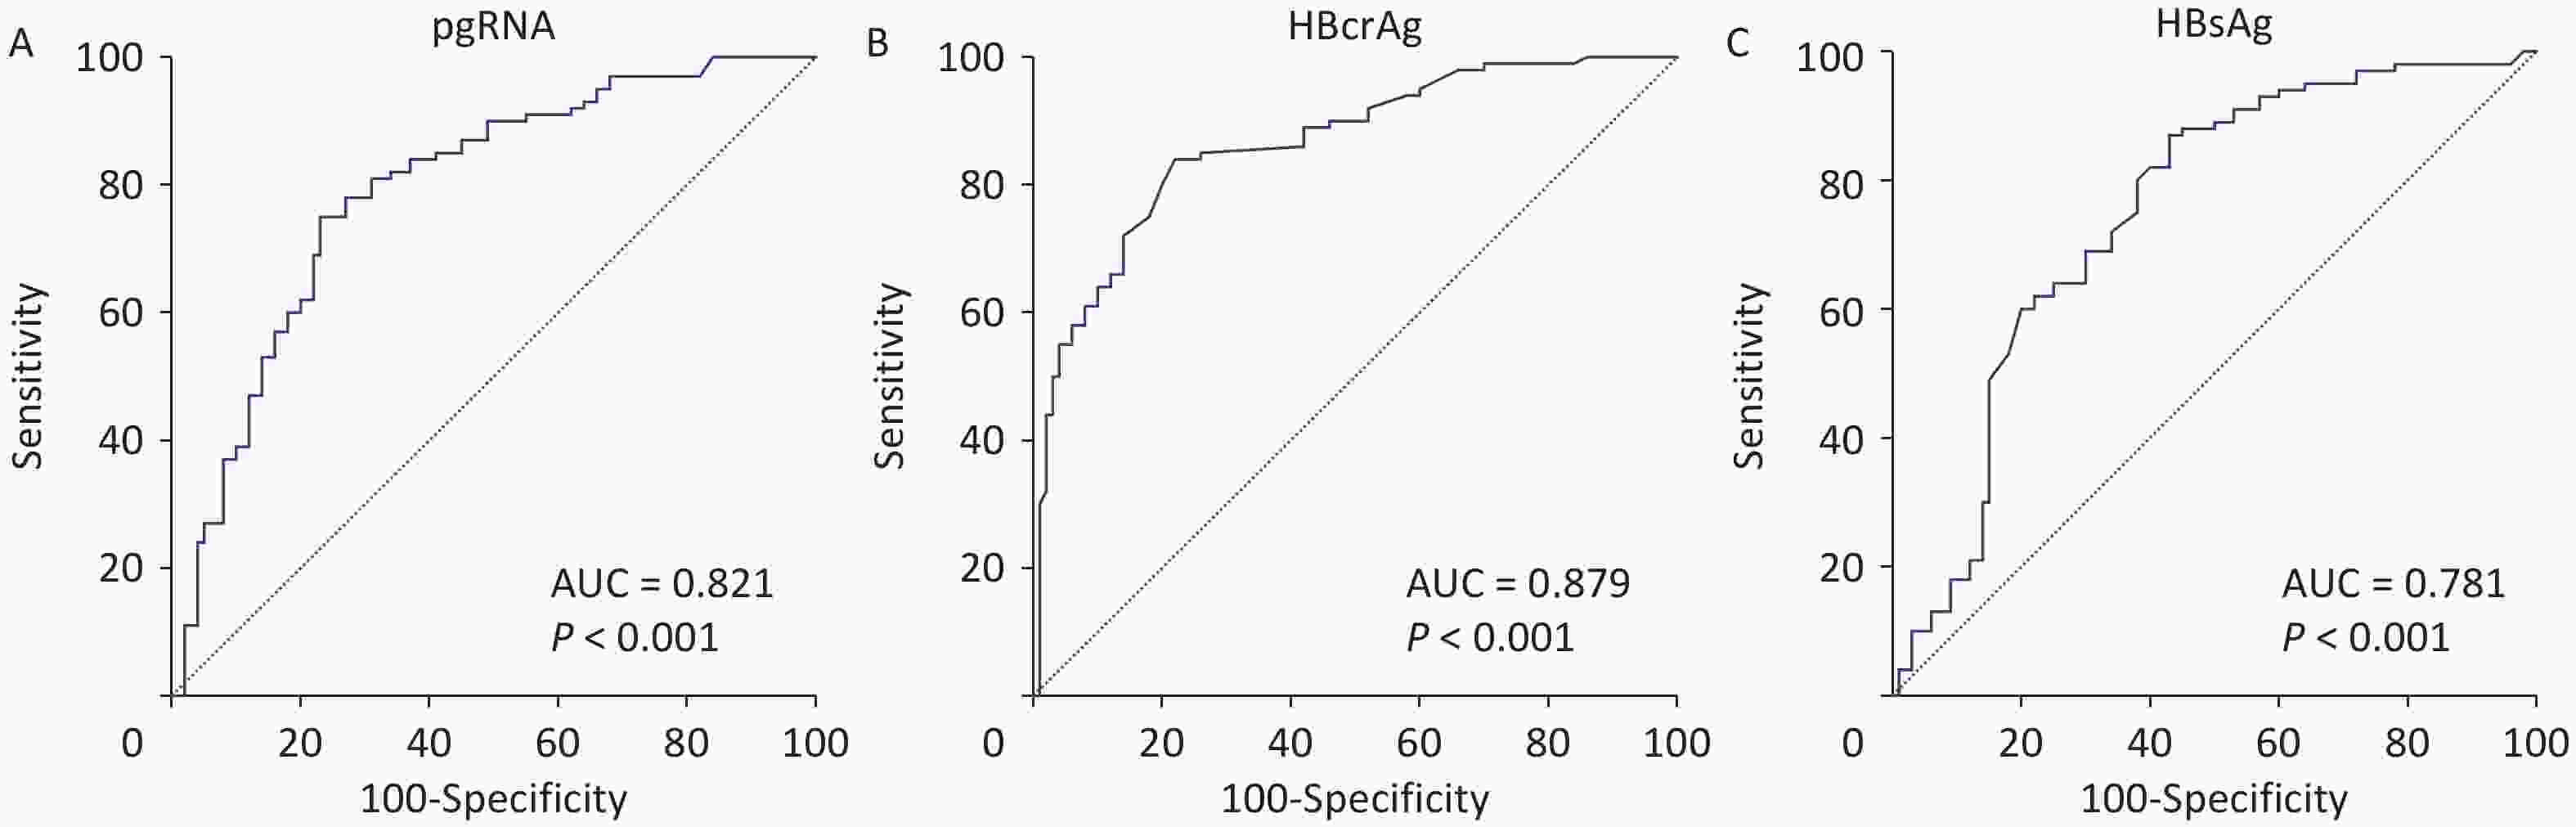
Figure 5. ROC curve analysis of biomarkers for predicting Peg-IFN-α efficacy. (A) ROC curve of pgRNA demonstrating predictive capacity for Peg-IFN-α antiviral efficacy. (B) ROC curve of HBcrAg for predicting Peg-IFN-α treatment response. (C) ROC curve of HBsAg evaluating its association with the therapeutic outcome. Peg-IFN-α, pegylated interferon-alpha; pgRNA, pregenomic RNA; ROC, reciever operating characteristic; AUC, area under the curve.
-
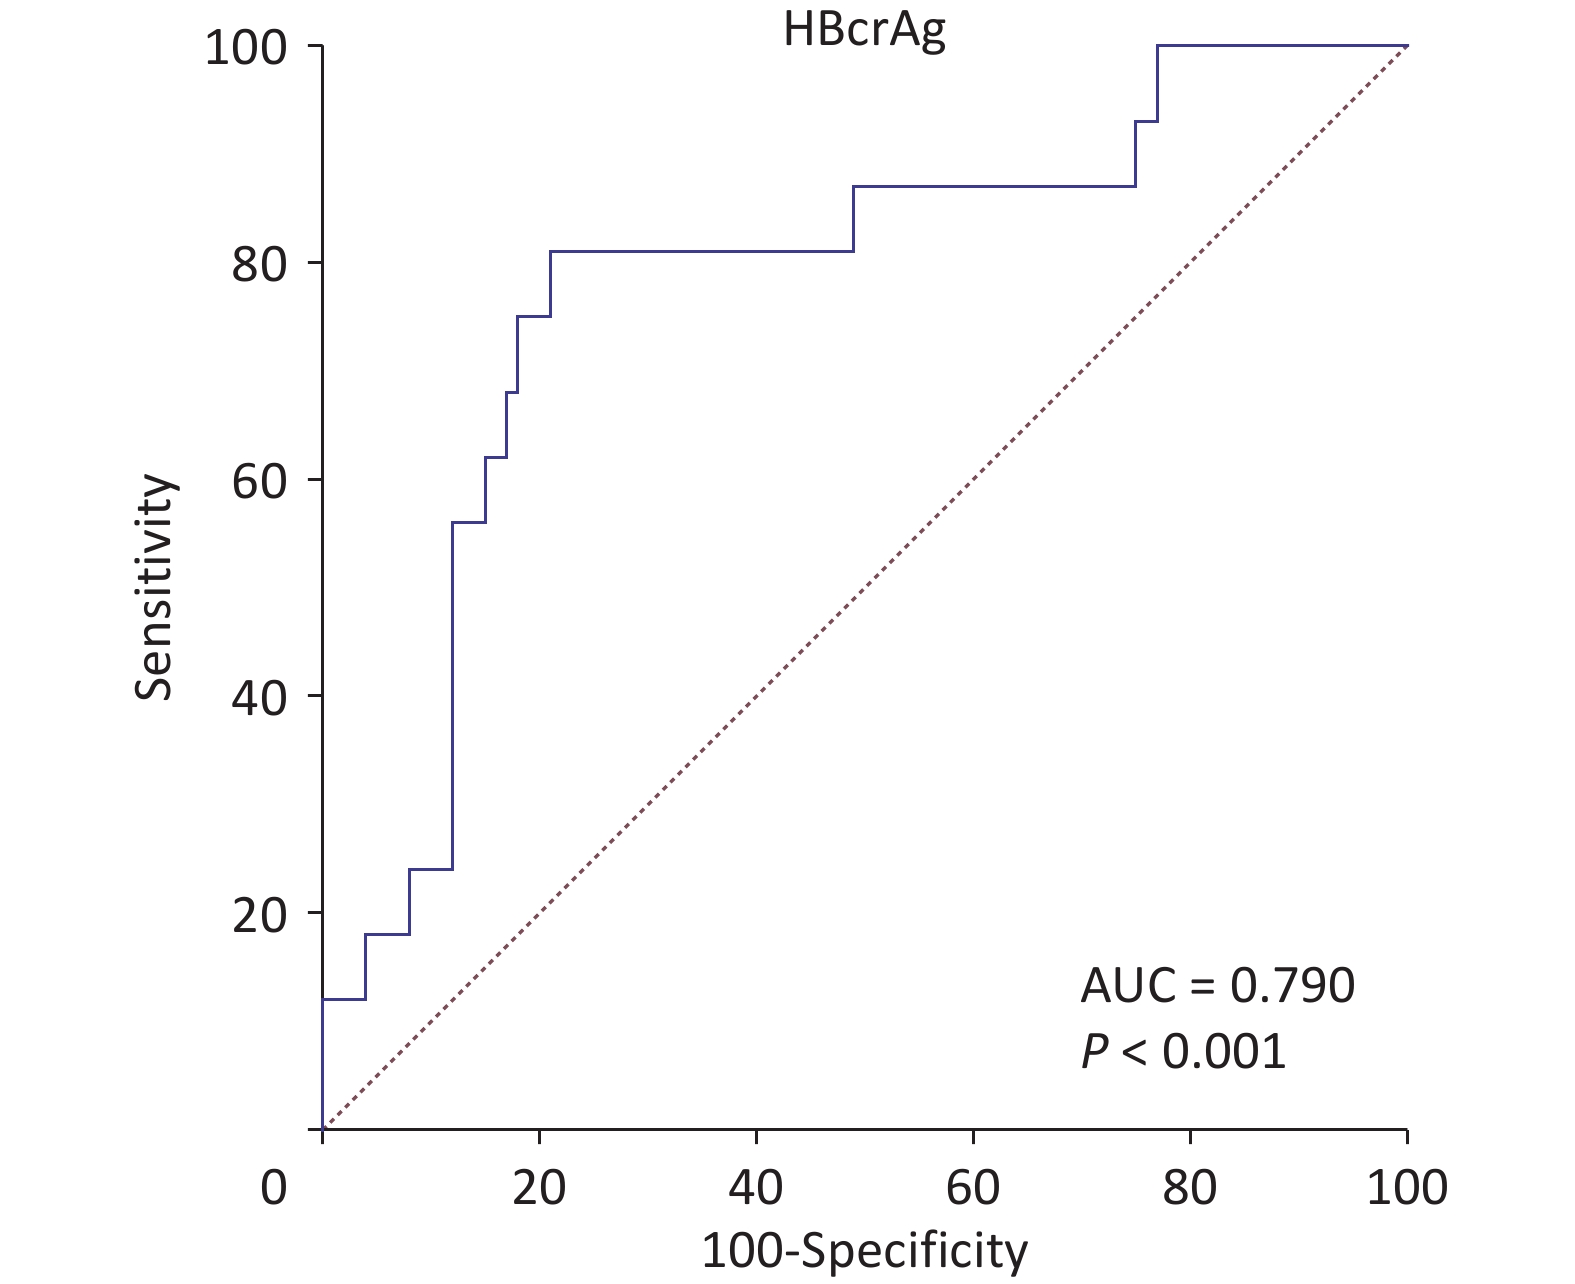
Post-Peg-IFN-α virologic relapse occurred in 16 patients. ROC curve analysis showed that serum HBcrAg levels at Peg-IFN-α discontinuation were significantly associated with post-Peg-IFN-α virologic relapse and showed potential as a predictive biomarker for post-Peg-IFN-α virologic relapse (area under the ROC curve = 0.790; 95% CI, 0.703–0.861) (Figure 6). The optimal cutoff value was HBcrAg = 24.85 mU/mL (3.40 log10 U/mL) (sensitivity, 81.25%; specificity, 79.17%). Neither pgRNA nor HBsAg showed a significant predictive value.
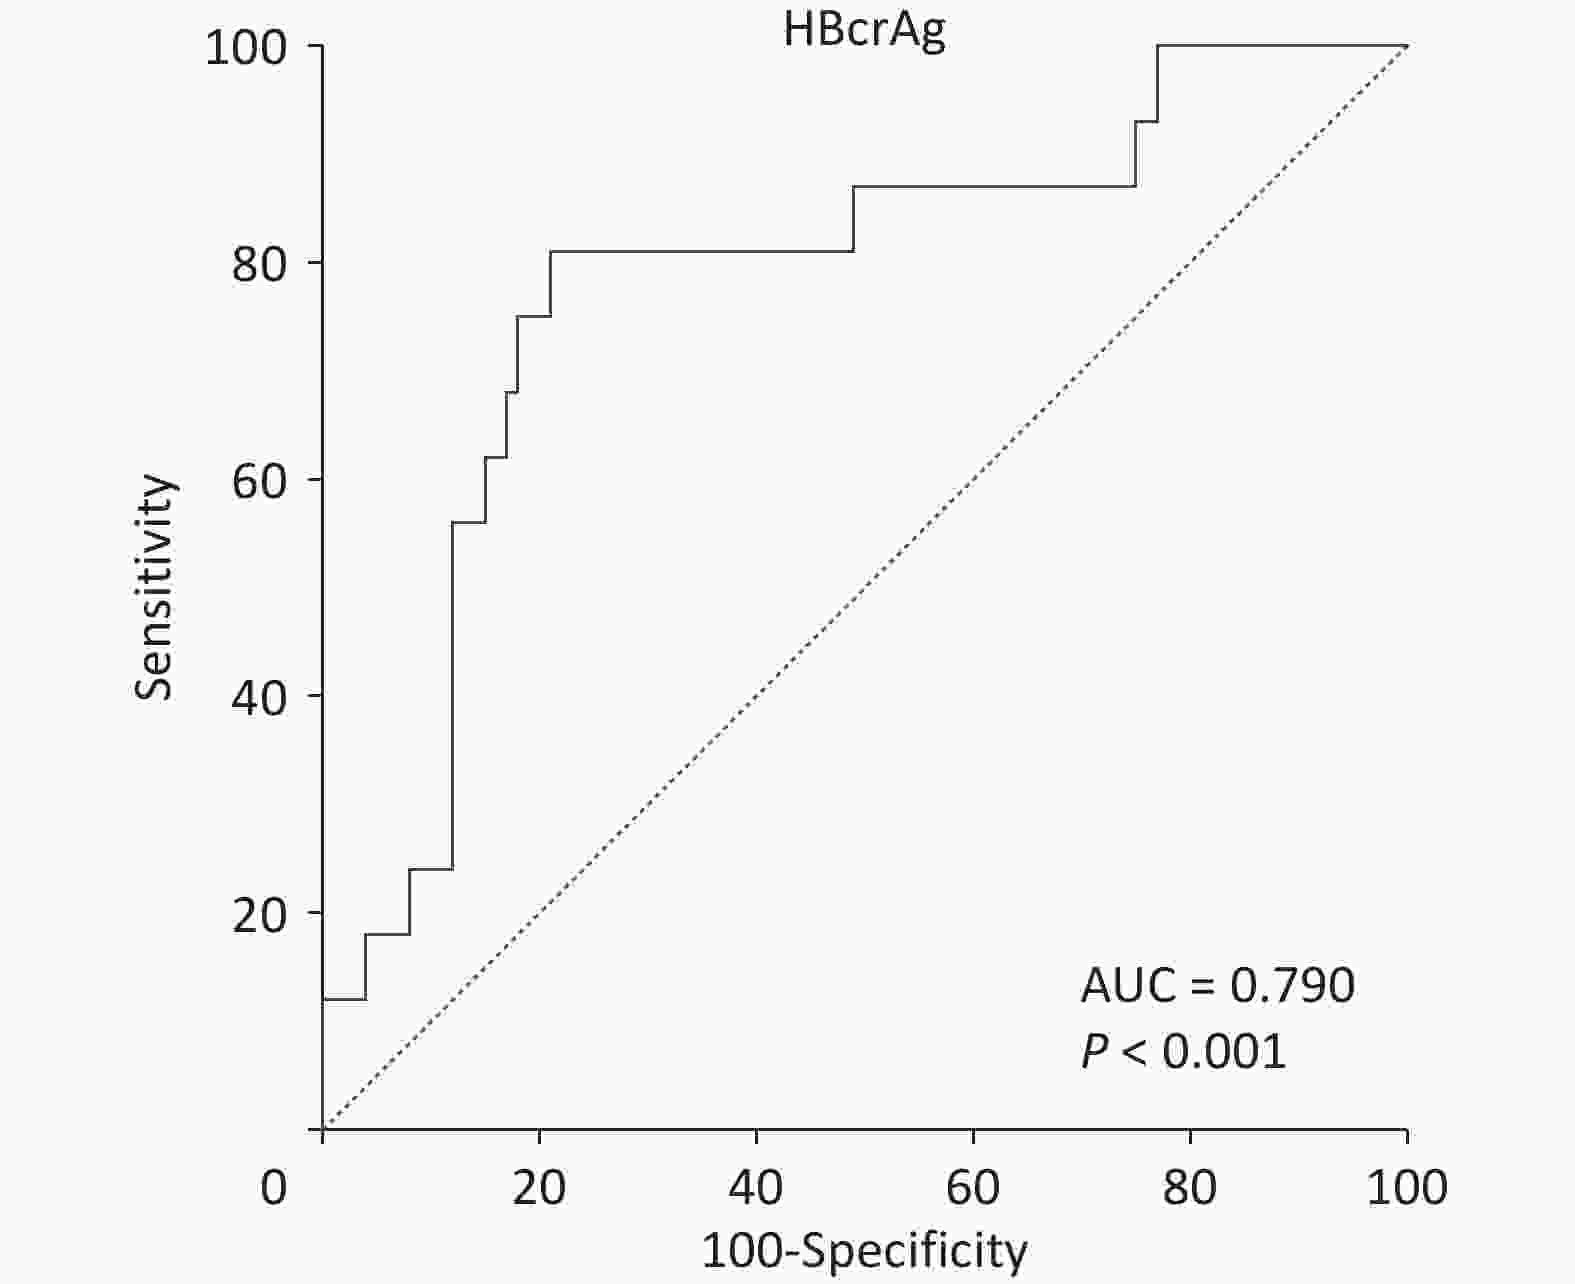
Figure 6. Predictive value of HBcrAg for post-Peg-IFN-α virologic relapse. ROC curve analysis demonstrates serum HBcrAg levels at therapy discontinuation as a predictor of post-Peg-IFN-α virologic relapse. The area under the ROC curve was 0.790 (95% confidence interval [CI], 0.703–0.861). ROC, reciever operating characteristic; AUC, area under the curve; HBcrAg, hepatitis B core-related antigen; Peg-IFN-α, pegylated interferon-alpha.
-
HBcrAg and pgRNA are well-known serum surrogate markers that reflect intrahepatic cccDNA transcriptional activity[5,6]. Accumulating evidence has shown that HBcrAg is associated with HBeAg seroconversion and disease progression in patients with CHB[9]. Elevated HBcrAg levels in HBV carriers are associated with an increase risk of cirrhosis progression, supporting their potential prognostic value[13]. In addition, HBcrAg levels are closely associated with the progression of liver fibrosis in patients with CHB receiving nucleos(t)ide analog therapy[15]. Similarly, pgRNA levels play a critical role in monitoring antiviral treatment and identifying potential viral relapse after drug discontinuation[5,14]. Whether serum pgRNA and HBcrAg levels are associated with Peg-IFN-α antiviral outcomes and post-treatment virologic relapse in patients with CHB remains to be further clarified.
This study enrolled 371 treatment-naïve patients with CHB, 327 of whom completed the entire follow-up course. All participants received standard 48-week Peg-IFN-α therapy[16]. Logistic regression analysis showed that baseline serum pgRNA (OR, 0.571; 95% CI, 0.388–0.838), HBcrAg (OR, 0.539; 95% CI, 0.348–0.835), and HBsAg (OR, 0.356; 95% CI, 0.223–0.567) levels were inversely correlated with Peg-IFN-α antiviral efficacy, which is consistent with previous findings[17-20]. ROC curve analysis confirmed the predictive performance of these baseline markers, with AUCs of 0.821, 0.879, and 0.781 for pgRNA, HBcrAg, and HBsAg, respectively. The optimal cutoff values showed acceptable sensitivity and specificity[21]. Notably, the HBcrAg threshold of 3.45 log10 U/mL identified in our study is comparable to previously reported cutoff values for predicting HBeAg seroconversion. Further analysis of post-Peg-IFN-α virologic relapse revealed that HBcrAg levels at treatment discontinuation may predict subsequent viral relapse, with an AUC of 0.790 and an optimal cutoff of 3.40 log10 U/mL. Previous studies have demonstrated that HBcrAg and HBsAg serve as valuable markers for predicting off-therapy relapse after the withdrawal of nucleos(t)ide analogs[22]. Our findings further suggest that HBcrAg also has potential predictive significance for post-IFN-α relapse, acting as a reliable surrogate indicator reflecting cccDNA activity[23]. In contrast, neither pgRNA nor HBsAg showed significant predictive value for relapse in the present cohort. The overall virologic response rate of 34.25% was consistent with real-world clinical data from previous studies[24,25]. We also observed a marked elevation of ALT and AST during Peg-IFN-α treatment, especially at week 24 in virologic responders, further supporting the notion that transaminase flares are closely related to IFN-induced antiviral immune activation[26]. Transaminase flares during Peg-IFN-α therapy do not merely reflect simple hepatocellular damage but also largely mirror immune-mediated HBV clearance. The increase in ALT and AST levels is driven by IFN-triggered immune activation, which promotes the recognition and elimination of HBV-infected hepatocytes. The more prominent transaminase elevation observed in virologic responders further indicates that such flares are beneficial indicators of effective immune clearance. In this regard, the magnitude and dynamic trend of early transaminase flares may serve as convenient early response markers for predicting subsequent virological outcomes, providing a simple auxiliary reference for timely individualized treatment adjustment in clinical practice[27]. In addition, dynamic changes in serum pgRNA during Peg-IFN-α treatment may carry potential predictive implications for antiviral response and subsequent virologic relapse. Serial fluctuations in pgRNA levels directly reflect real-time cccDNA transcriptional activity, and longitudinal kinetic patterns during therapy may help stratify clinical prognosis. In the current study, we mainly focused on baseline and end-of-treatment pgRNA levels rather than on on-treatment dynamic trends. Further large-scale prospective studies are warranted to clarify whether longitudinal pgRNA kinetics can improve the predictive accuracy of treatment response and post-treatment relapse[28].
This study has some inherent limitations. First, the number of patients who experienced post-treatment virologic relapse was relatively small (only 16 cases), which inevitably limited the statistical power and robustness of the relapse prediction analysis. Therefore, the predictive value of end-of-treatment HBcrAg levels should be interpreted cautiously, and the relevant conclusions cannot be overgeneralized. External validation in larger independent CHB cohorts is required before widespread clinical application[29]. Second, pgRNA levels failed to demonstrate significant predictive performance for post-treatment virologic relapse. The small relapse sample size (n = 16) may partially account for this negative result because the current cohort only provided approximately 30% statistical power to detect an AUC greater than 0.7. Insufficient statistical power cannot completely exclude the potential predictive role of pgRNA levels, and future studies with larger sample sizes and more relapse events are needed for further verification. Third, constructing and validating a combined predictive model integrating HBcrAg with other clinical and laboratory indicators may further improve predictive efficiency; however, external validation in an independent cohort is still necessary. Well-designed follow-up studies are also needed to explore the molecular mechanism underlying the association between HBcrAg and HBV relapse after Peg-IFN-α cessation[24,25].
-
These findings indicate that serum pgRNA, HBcrAg, and HBsAg are closely correlated with the therapeutic response to Peg-IFN-α in treatment-naïve patients with CHB. Importantly, serum HBcrAg levels at Peg-IFN-α discontinuation have the potential to serve as a predictive biomarker for post-treatment virologic relapse, which may help identify high-risk individuals after Peg-IFN-α withdrawal and guide clinical consolidation therapy strategies.
HTML
Patients
Laboratory Data
Serum HBcrAg Measurement
Serum pgRNA Measurement
Statistical Analysis
Patient Characteristics at Baseline
Response to Peg-IFN-α Antiviral Therapy
ALT and AST Elevation during Peg-IFN-α Therapy
Association of pgRNA, HBcrAg, and HBsAg with Peg-IFN-α Outcomes
Predictive Value of pgRNA, HBcrAg, and HBsAg for Peg-IFN-α Efficacy
Serum HBcrAg Predicts Post-Peg-IFN-α Virologic Relapse
Competing Interests The authors declare no conflicts of interest.
Authors’ Contributions Conceptualization and study design were performed by Minghui Li and Ruyu Liu. Patient recruitment, clinical data collection, and laboratory investigation were performed by Linmei Yao, Chuanchun Mao, Yuan Tian, Yao Lu, Lu Zhang, Ge Shen, Shuling Wu, Min Chang, Hongxiao Hao, Leiping Hu, Yuanjiao Gao, Mengjiao Xu, and Yao Xie. Data curation, statistical analysis, and interpretation were performed by Linmei Yao, Chuanchun Mao, Yuan Tian, Minghui Li, and Ruyu Liu. The original draft was prepared by Linmei Yao, Chuanchun Mao, and Yuan Tian. The manuscript was reviewed and revised by Minghui Li and Ruyu Liu. Supervision and project administration were provided by Minghui Li and Ruyu Liu. All authors read and approved the final manuscript and agreed to be accountable for all aspects of the work.
Data Sharing The supporting data are available from the corresponding authors upon request. The datasets used and/or analyzed in the current study can be obtained by contacting the corresponding authors.
&These authors contributed equally to this work.

 Quick Links
 DownLoad: