




-
Depression is a highly prevalent global public health challenge characterized by persistently low mood, anhedonia, and cognitive impairment and is projected to become a leading cause of global disease burden by 2030[1,2]. Emerging clinical and epidemiological evidence highlights the close bidirectional relationship between systemic metabolic dysfunction and depressive symptoms[3]. This relationship is driven by shared pathways, including chronic low-grade systemic inflammation, elevated oxidative stress, and neuroendocrine dysregulation via the hypothalamic–pituitary–adrenal axis[3]. The triglyceride–glucose (TyG) index has gained recognition as a reliable, accessible, and inexpensive surrogate marker for peripheral insulin resistance, comparable to the hyperinsulinemic-euglycemic clamp[4]. Recent epidemiological investigations have consistently identified positive and/or nonlinear correlations between higher TyG levels and the presence of depressive symptoms in various populations[4], with reported odds ratios (ORs) ranging from 1.20 to 1.35 when comparing extreme categories. Subclinical renal insufficiency is a distinct risk factor for neuropsychiatric decline and mood disturbances[5]. Serum creatinine (Crea), an easily accessible clinical proxy for renal filtration capacity and somatic skeletal muscle mass, has shown complex inverse associations with the risk of depressive symptoms, suggesting its utility as a supplementary biological indicator[5]. As metabolic abnormalities and renal filtration deficits frequently coexist and may synergistically disrupt the central nervous system, evaluating these physiological domains in isolation may underrepresent an individual's true systemic psychiatric vulnerability. Therefore, we developed a novel integrated metabolic–renal indicator, the TyG–Crea index, and investigated its cross-sectional association with depressive symptoms in a large, well-characterized, community-based adult population, situating our findings within the broader context of the current literature.
Data for this study were obtained from the baseline database of the Qingdao Diabetes Prevention Program, a multistage stratified cluster sampling survey conducted in Shandong Province in 2006 and 2009, comprising an analytic sample of 8,675 participants (mean age 51.12 ± 10.51 years; 60.93% female), as described previously[6]. To ensure strict quality control, all clinical examinations followed a standardized protocol with centralized laboratory testing. To obtain a complete analytic sample and minimize confounding from primary renal disease, we excluded individuals with missing sociodemographic, clinical, or biochemical covariate data and those with a self-reported physician diagnosis of kidney disease or a documented family history of kidney disease. This selection process resulted in a final analytic sample of 8,675 participants aged 35–74 years (the study flowchart is available online in Supplementary Figure S1). Fasting venous blood samples were drawn from all participants in the morning after an overnight fast of at least 10 hours. Fasting plasma glucose, serum triglyceride, and serum creatinine levels were measured using automated enzymatic assays on a standardized autoanalyzer. The TyG index was calculated using the following formula: ln [fasting triglycerides (in milligrams per deciliter) × fasting glucose (in milligrams per deciliter)/2][7]. To combine the metabolic and renal axes into a single continuous marker and address the skewed distribution of raw creatinine levels, the TyG–Crea index was constructed as ln (TyG × Crea). Depressive symptoms were assessed using the validated Chinese version of the 20-item Zung Self-Rating Depression Scale (SDS), with a widely accepted clinical raw cutoff score of 50 to define the presence of significant depressive symptoms[8,9].
Logistic regression models were used to estimate ORs and 95% confidence intervals (CIs). The independent variables were analyzed as continuous metrics (per 1-standard deviation [SD] increment), and categorical variables were divided into quartiles (Q1–Q4). Confounding variables were adjusted progressively across the three models: Model 1 was unadjusted; Model 2 was adjusted for fundamental demographic factors, including age, sex, body mass index (BMI), and urban/rural residential status; and Model 3 was fully adjusted for all baseline sociodemographic and lifestyle variables, including smoking status, alcohol consumption, marital status, employment status, hypertension, type 2 diabetes, formal education level, and monthly household income. Model calibration was evaluated using Hosmer–Lemeshow goodness-of-fit tests. Dose–response characteristics were examined using restricted cubic splines (RCS) with three knots, and threshold effects were quantified using a two-piecewise linear regression model when nonlinearity was detected. To verify the statistical robustness of our primary findings against baseline selection bias, a 1:4 nearest-neighbor propensity score matching (PSM) sensitivity analysis was performed based on age, sex, BMI, and residential status.
Among the 8,675 included participants, 5,286 (60.93%) were female, the mean age of the entire cohort was 51.12 ± 10.51 years, and 1,109 individuals (12.78%) presented with significant depressive symptoms (Table 1). Participants in the depressive symptom group were significantly older, had a higher prevalence of type 2 diabetes, and were more likely to reside in urban areas than those in the non-depressive group (all P < 0.05; Table 1). Laboratory comparisons further revealed that the depressive group displayed significantly higher baseline levels of the crude TyG index (8.69 ± 0.65 vs. 8.61 ± 0.64), serum creatinine (0.69 ± 0.18 vs. 0.67 ± 0.16), and the integrated TyG–Crea index (1.76 ± 0.27 vs. 1.73 ± 0.24) (all P < 0.05; Table 1). This baseline elevation is the first indication that concurrent shifts in metabolic and renal profiles are closely linked to psychiatric outcomes in the general population. Fully adjusted multivariable logistic regression analyses showed that the TyG index, serum creatinine, and novel TyG–Crea index were independently associated with higher odds of depressive symptoms when evaluated as continuous variables (Table 2). Specifically, after adjustment for all potential sociodemographic and lifestyle confounders in Model 3, each 1-SD increment in the continuous TyG index was associated with a 16.8% higher odds of depressive symptoms (OR = 1.168, 95% CI: 1.044–1.307, P = 0.006), while a 1-SD increase in continuous serum creatinine was also associated with higher odds of depressive symptoms (OR = 1.652, 95% CI: 1.081–2.525, P = 0.020). The integrated TyG–Crea index demonstrated a stronger association with depressive symptoms; each 1-SD increment in the continuous TyG–Crea index corresponded to a 52.4% increase in the odds of presenting with depressive symptoms (OR = 1.524, 95% CI: 1.115–2.083, P = 0.008). The larger point estimate for the TyG–Crea index suggests that combining the two markers may provide additional information beyond either marker alone. Furthermore, when participants were categorized into quartiles, those in the highest quartile (Q4) of the TyG–Crea index had an adjusted OR of 1.415 (95% CI: 1.141–1.755, P < 0.05) compared with those in the lowest quartile (Q1). This relative risk elevation exceeded the corresponding quartile-based effects observed for the independent TyG index (OR = 1.217, 95% CI: 1.185–1.468) or serum creatinine alone (OR = 1.244, 95% CI: 1.008–1.535). Hosmer–Lemeshow goodness-of-fit tests indicated no evidence of poor fit for the three primary models (all P > 0.05; detailed calibration values are compiled in Supplementary Table S1). These findings suggest that concurrent metabolic and renal filtration alterations may be associated with a higher prevalence of depressive symptoms. From a physiological standpoint, chronic insulin resistance may promote microvascular structural changes and neuroinflammation, while concurrent subclinical renal stress may increase the systemic accumulation of metabolic byproducts, potentially creating a highly neurotoxic peripheral environment that compromises blood-brain barrier integrity and impairs mood regulation networks.
Variables Overall Participants without depressive symptoms Participants with depressive
symptomsP-value N 8,675 7,566 1,109 Age (yrs) 51.12 ± 10.51 50.96 ± 10.49 52.21 ± 10.61 < 0.001 BMI (kg/m2) 25.40 ± 3.60 25.42 ± 3.61 25.28 ± 3.58 0.212 TyG index 8.62 ± 0.64 8.61 ± 0.64 8.69 ± 0.65 < 0.001 Crea (mg/dL) 0.68 ± 0.16 0.67 ± 0.16 0.69 ± 0.18 0.021 TyG-Crea index 1.73 ± 0.25 1.73 ± 0.24 1.76 ± 0.27 0.003 Gender, n (%) 0.143 Male 3,389 (39.07) 2,978 (39.36) 411 (37.06) Female 5,286 (60.93) 4,723 (62.42) 508 (45.81) Marital status, n (%) 0.002 Married 8,204 (94.57) 7,177 (94.86) 1,027 (92.61) Other 471 (5.43) 389 (5.14) 82 (7.39) Work status, n (%) < 0.001 Employed 4,234 (48.81) 3,775 (49.89) 459 (41.39) Unemployed 2,202 (26.40) 1,908 (25.22) 294 (26.51) Retired 2,239 (25.81) 1,883 (24.89) 356 (32.10) Residential status, n (%) < 0.001 Urban 3,444 (39.70) 2,843 (37.58) 601 (54.19) Rural 5,231 (60.30) 4,723 (62.42) 508 (45.81) Hypertension, n (%) 0.029 No 4,631 (53.38) 4,005 (52.93) 626 (56.45) Yes 4,044 (46.62) 3,561 (47.07) 483 (43.55) Diabetes, n (%) < 0.001 No 7,245 (83.52) 6,356 (84.01) 889 (80.16) Yes 1,430 (16.48) 1,210 (15.99) 220 (19.84) Income level, n (%) 0.046 < $410 6,010 (69.28) 5,213 (68.90) 797 (71.87) ≥ $410 2,665 (30.72) 2,353 (31.10) 312 (28.13) Nine-year education, n (%) 0.107 Not completed 5,924 (68.29) 5,190 (68.60) 734 (66.19) Completed 2,751 (31.71) 2,376 (31.40) 375 (33.81) Smoking status, n (%) 0.120 No 6,979 (80.45) 6,106 (80.70) 873 (78.72) Yes 1,696 (19.55) 1,460 (19.30) 236 (21.28) Drinking status, n (%) 0.077 No 5,387 (62.10) 4,725 (62.45) 662 (59.69) Yes 3,288 (37.90) 2,841 (37.55) 447 (40.31) Note. Data are shown as mean and standard deviation or number (percentage). BMI, body mass index; TyG, triglyceride–glucose; Crea, creatinine; PSM, propensity score matching. Table 1. Characteristics of participants with and without depressive symptoms
Index Quartiles/Continuous Model 1 Model 2 Model 3 TyG index Q1 Reference Reference Reference Q2 0.994 (0.824, 1.199) 0.929 (0.767, 1.124) 0.941 (0.777, 1.140) Q3 1.258 (1.052, 1.504) 1.151 (0.954, 1.389) 1.185 (0.980, 1.433) Q4 1.343 (1.124, 1.605) 1.212 (1.040, 1.470) 1.217 (1.185, 1.468) Continuous variable 1.230 (1.119, 1.353) 1.175 (1.059, 1.304) 1.168 (1.044, 1.307) Crea Q1 Reference Reference Reference Q2 0.871 (0.720, 1.055) 0.860 (0.710, 1.043) 0.860 (0.709, 1.044) Q3 0.946 (0.794, 1.126) 0.990 (0.822, 1.192) 0.978 (0.811, 1.179) Q4 1.183 (1.012, 1.404) 1.245 (1.010, 1.536) 1.244 (1.008, 1.535) Continuous variable 1.574 (1.099, 2.256) 1.632 (1.067, 2.496) 1.652 (1.081, 2.525) TyG-Crea index Q1 Reference Reference Reference Q2 0.927 (0.770, 1.115) 0.927 (0.768, 1.118) 0.932 (0.772, 1.124) Q3 1.005 (0.837, 1.206) 1.064 (0.876, 1.292) 1.048 (0.862, 1.274) Q4 1.329 (1.117, 1.581) 1.418 (1.144, 1.758) 1.415 (1.141, 1.755) Continuous variable 1.519 (1.175, 1.962) 1.543 (1.130, 2.106) 1.524 (1.115, 2.083) Note. Model 1 = unadjusted; Model 2 = adjusted for age, sex, BMI, and urban/rural residence; Model 3 was further adjusted for smoking status, alcohol consumption, marital status, employment status, hypertension, diabetes, educational level, and income level. Depressive symptoms were defined as SDS score ≥ 50. TyG, Crea, and TyG-Crea indices were analyzed as continuous variables and quartiles. TyG, triglyceride-glucose; Crea, creatinine; BMI, body mass index; SDS, self-rated depression scale; OR, odds ratio; CI, confidence interval. Table 2. Multivariate-adjusted association of TyG index, Crea, and TyG-Crea index and depression symptoms
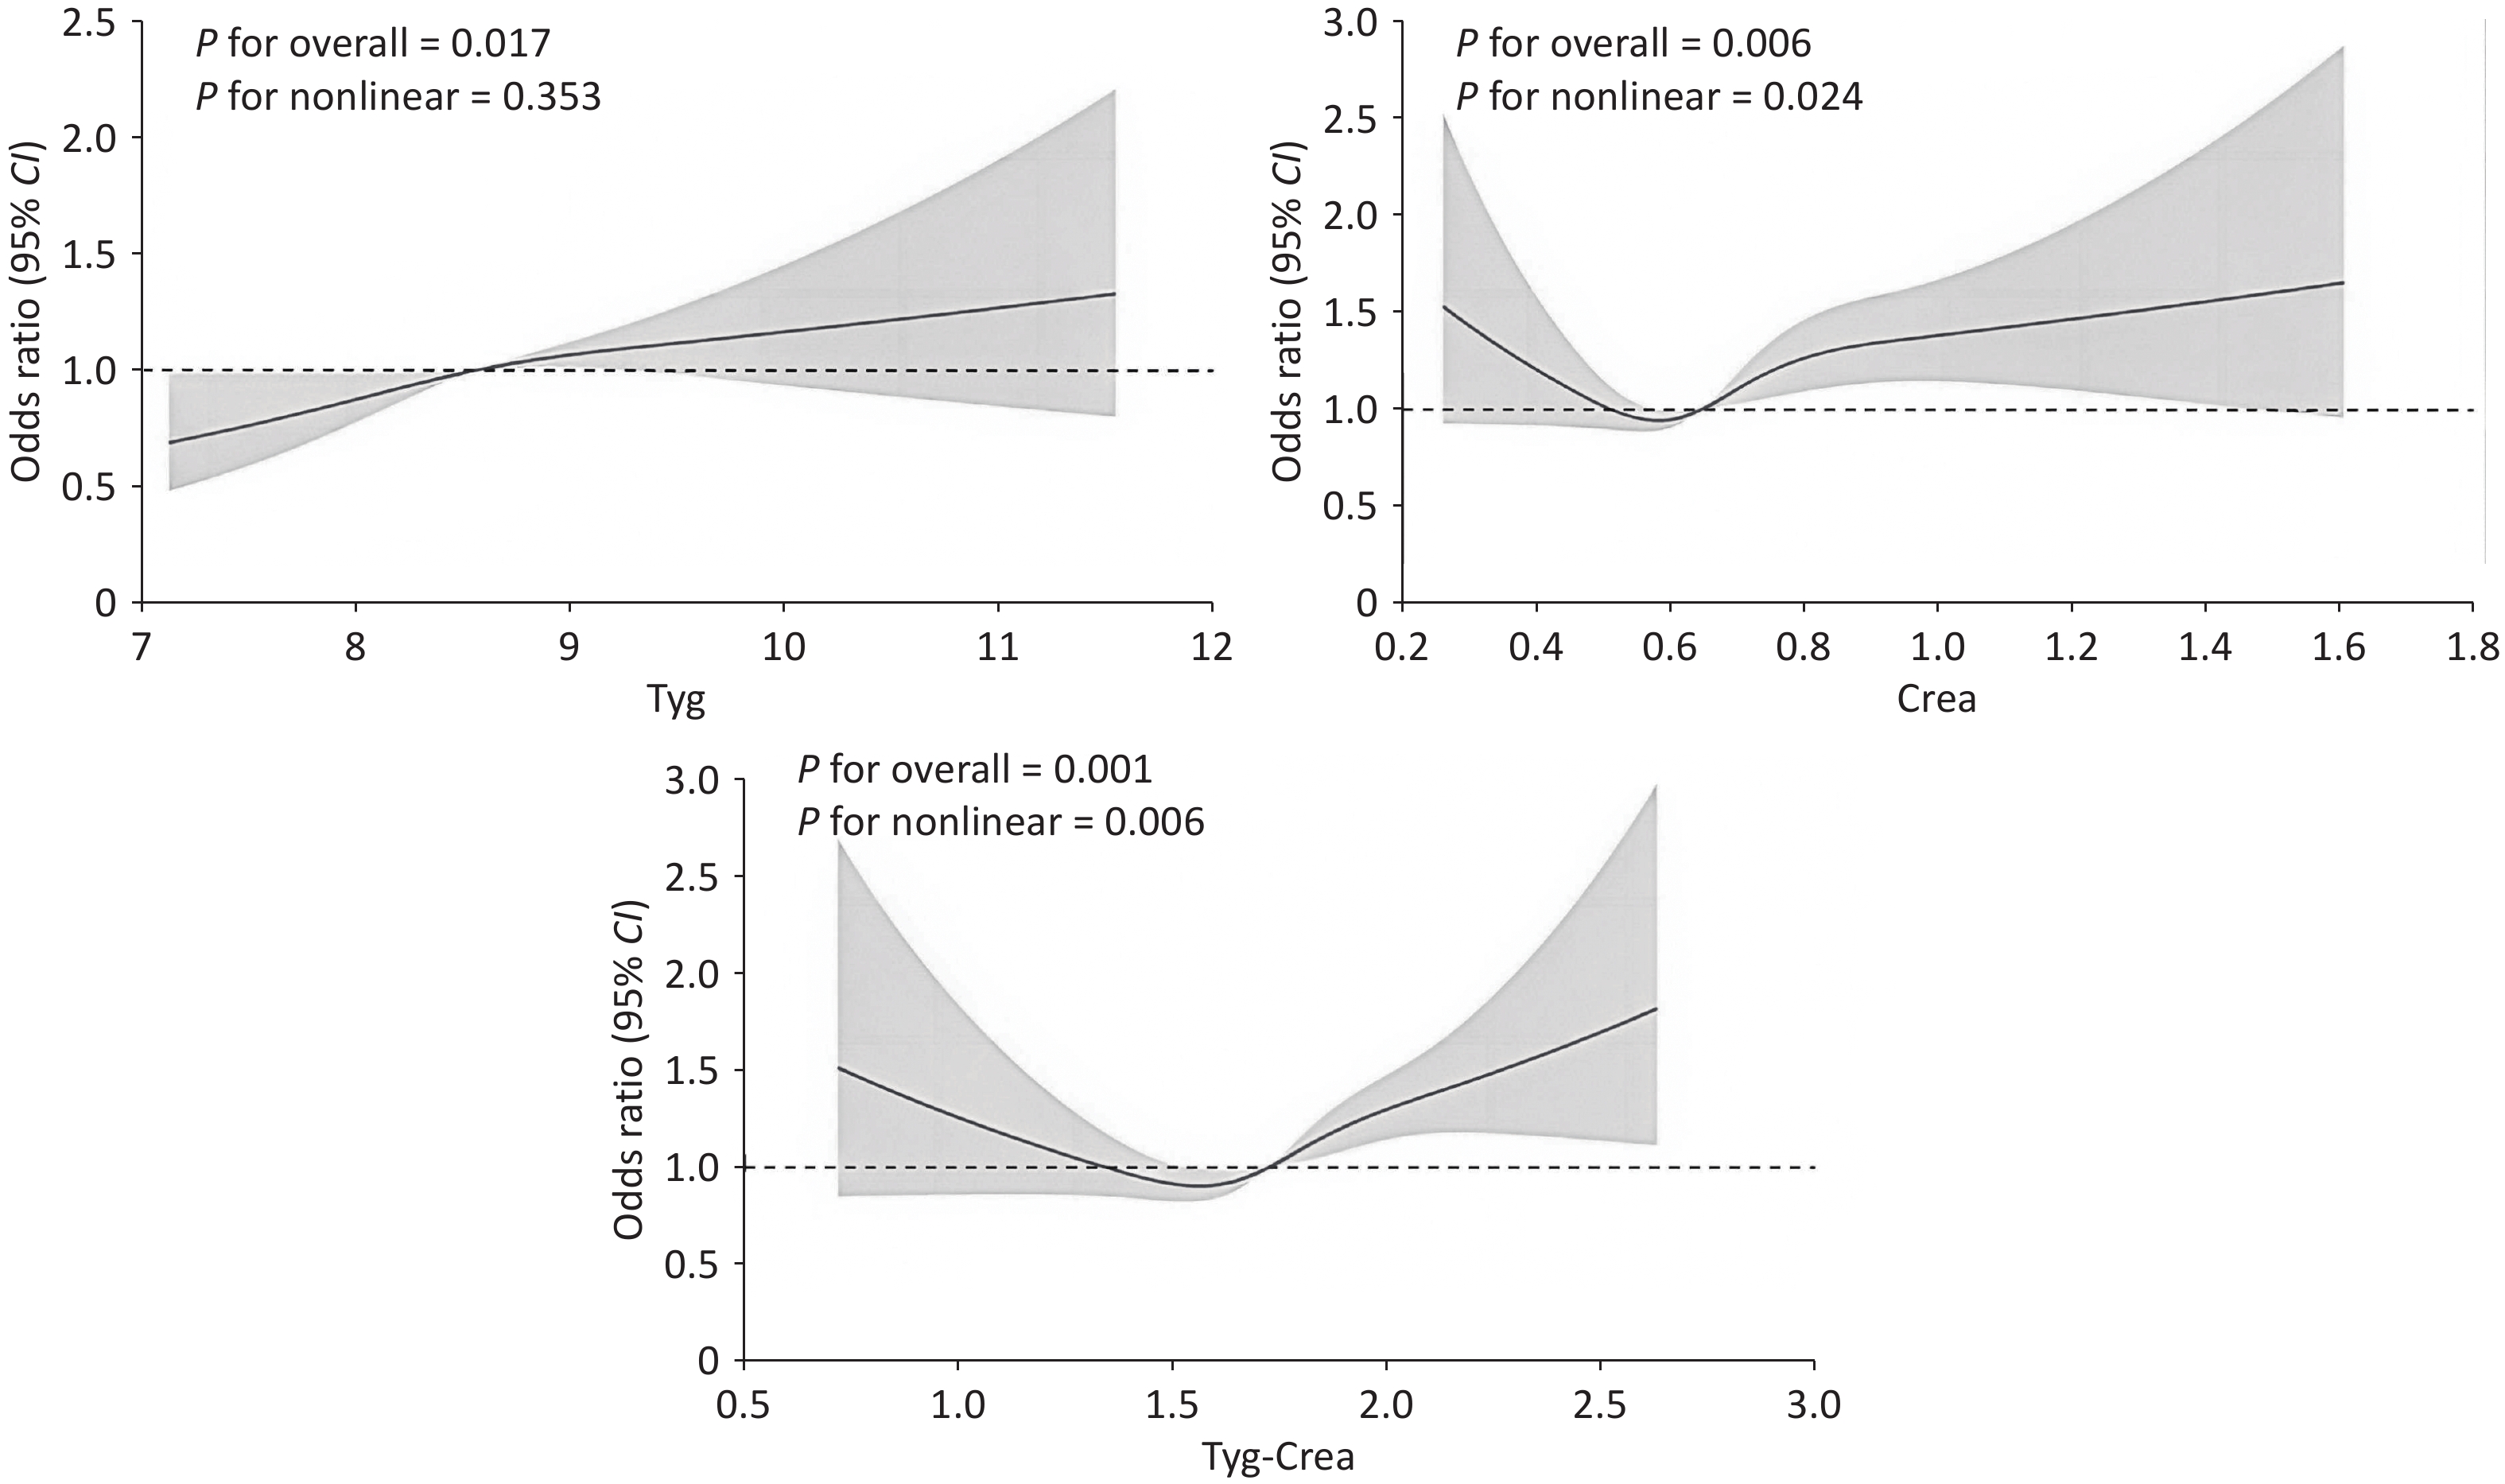
The dose–response characteristics mapped via the fully adjusted RCS configurations uncovered distinct epidemiological trajectories among the indices. The TyG index showed a positive dose-response relationship with depressive symptoms, with no evidence of nonlinearity (overall P = 0.017, nonlinear P = 0.353; Figure 1), indicating progressively higher odds of depressive symptoms with increasing TyG values. In contrast, the newly integrated TyG–Crea index demonstrated a highly significant nonlinear dose–response relationship (overall P = 0.001, nonlinear P = 0.006; Figure 1). This non-linear pattern reveals a complex biological relationship that may not be adequately captured by simple linear modeling. The estimated inflection point was a TyG–Crea index value of 1.580. Segmented regression indicated a pronounced threshold effect (likelihood ratio test, P = 0.012; data shown online in Supplementary Table S2). Below the threshold of 1.580, the TyG–Crea index was not significantly associated with the odds of depressive symptoms (OR = 0.560, 95% CI: 0.260–1.240, P = 0.156), for conciseness. However, beyond the critical threshold value of 1.580, a sharp risk increase occurred, with each unit increase in the index more than doubling the odds of depressive symptoms (OR = 2.260, 95% CI: 1.470–3.480, P < 0.001; Supplementary Table S2). This threshold effect suggests that when metabolic-renal dysregulation reaches a specific biological tipping point, it may trigger systemic changes that increase vulnerability to depressive disorders. When the combined metabolic and filtration stress remains below 1.580, homeostatic compensatory mechanisms within the central nervous system appear capable of buffering peripheral metabolic insults. However, once this threshold is crossed, the cumulative burden likely triggers an abrupt, uncompensated cascade of systemic oxidative stress and neuroendocrine disruption, causing a sharp drop in neuroplasticity and hippocampal brain-derived neurotrophic factor expression, which manifests as severe depressive symptoms.
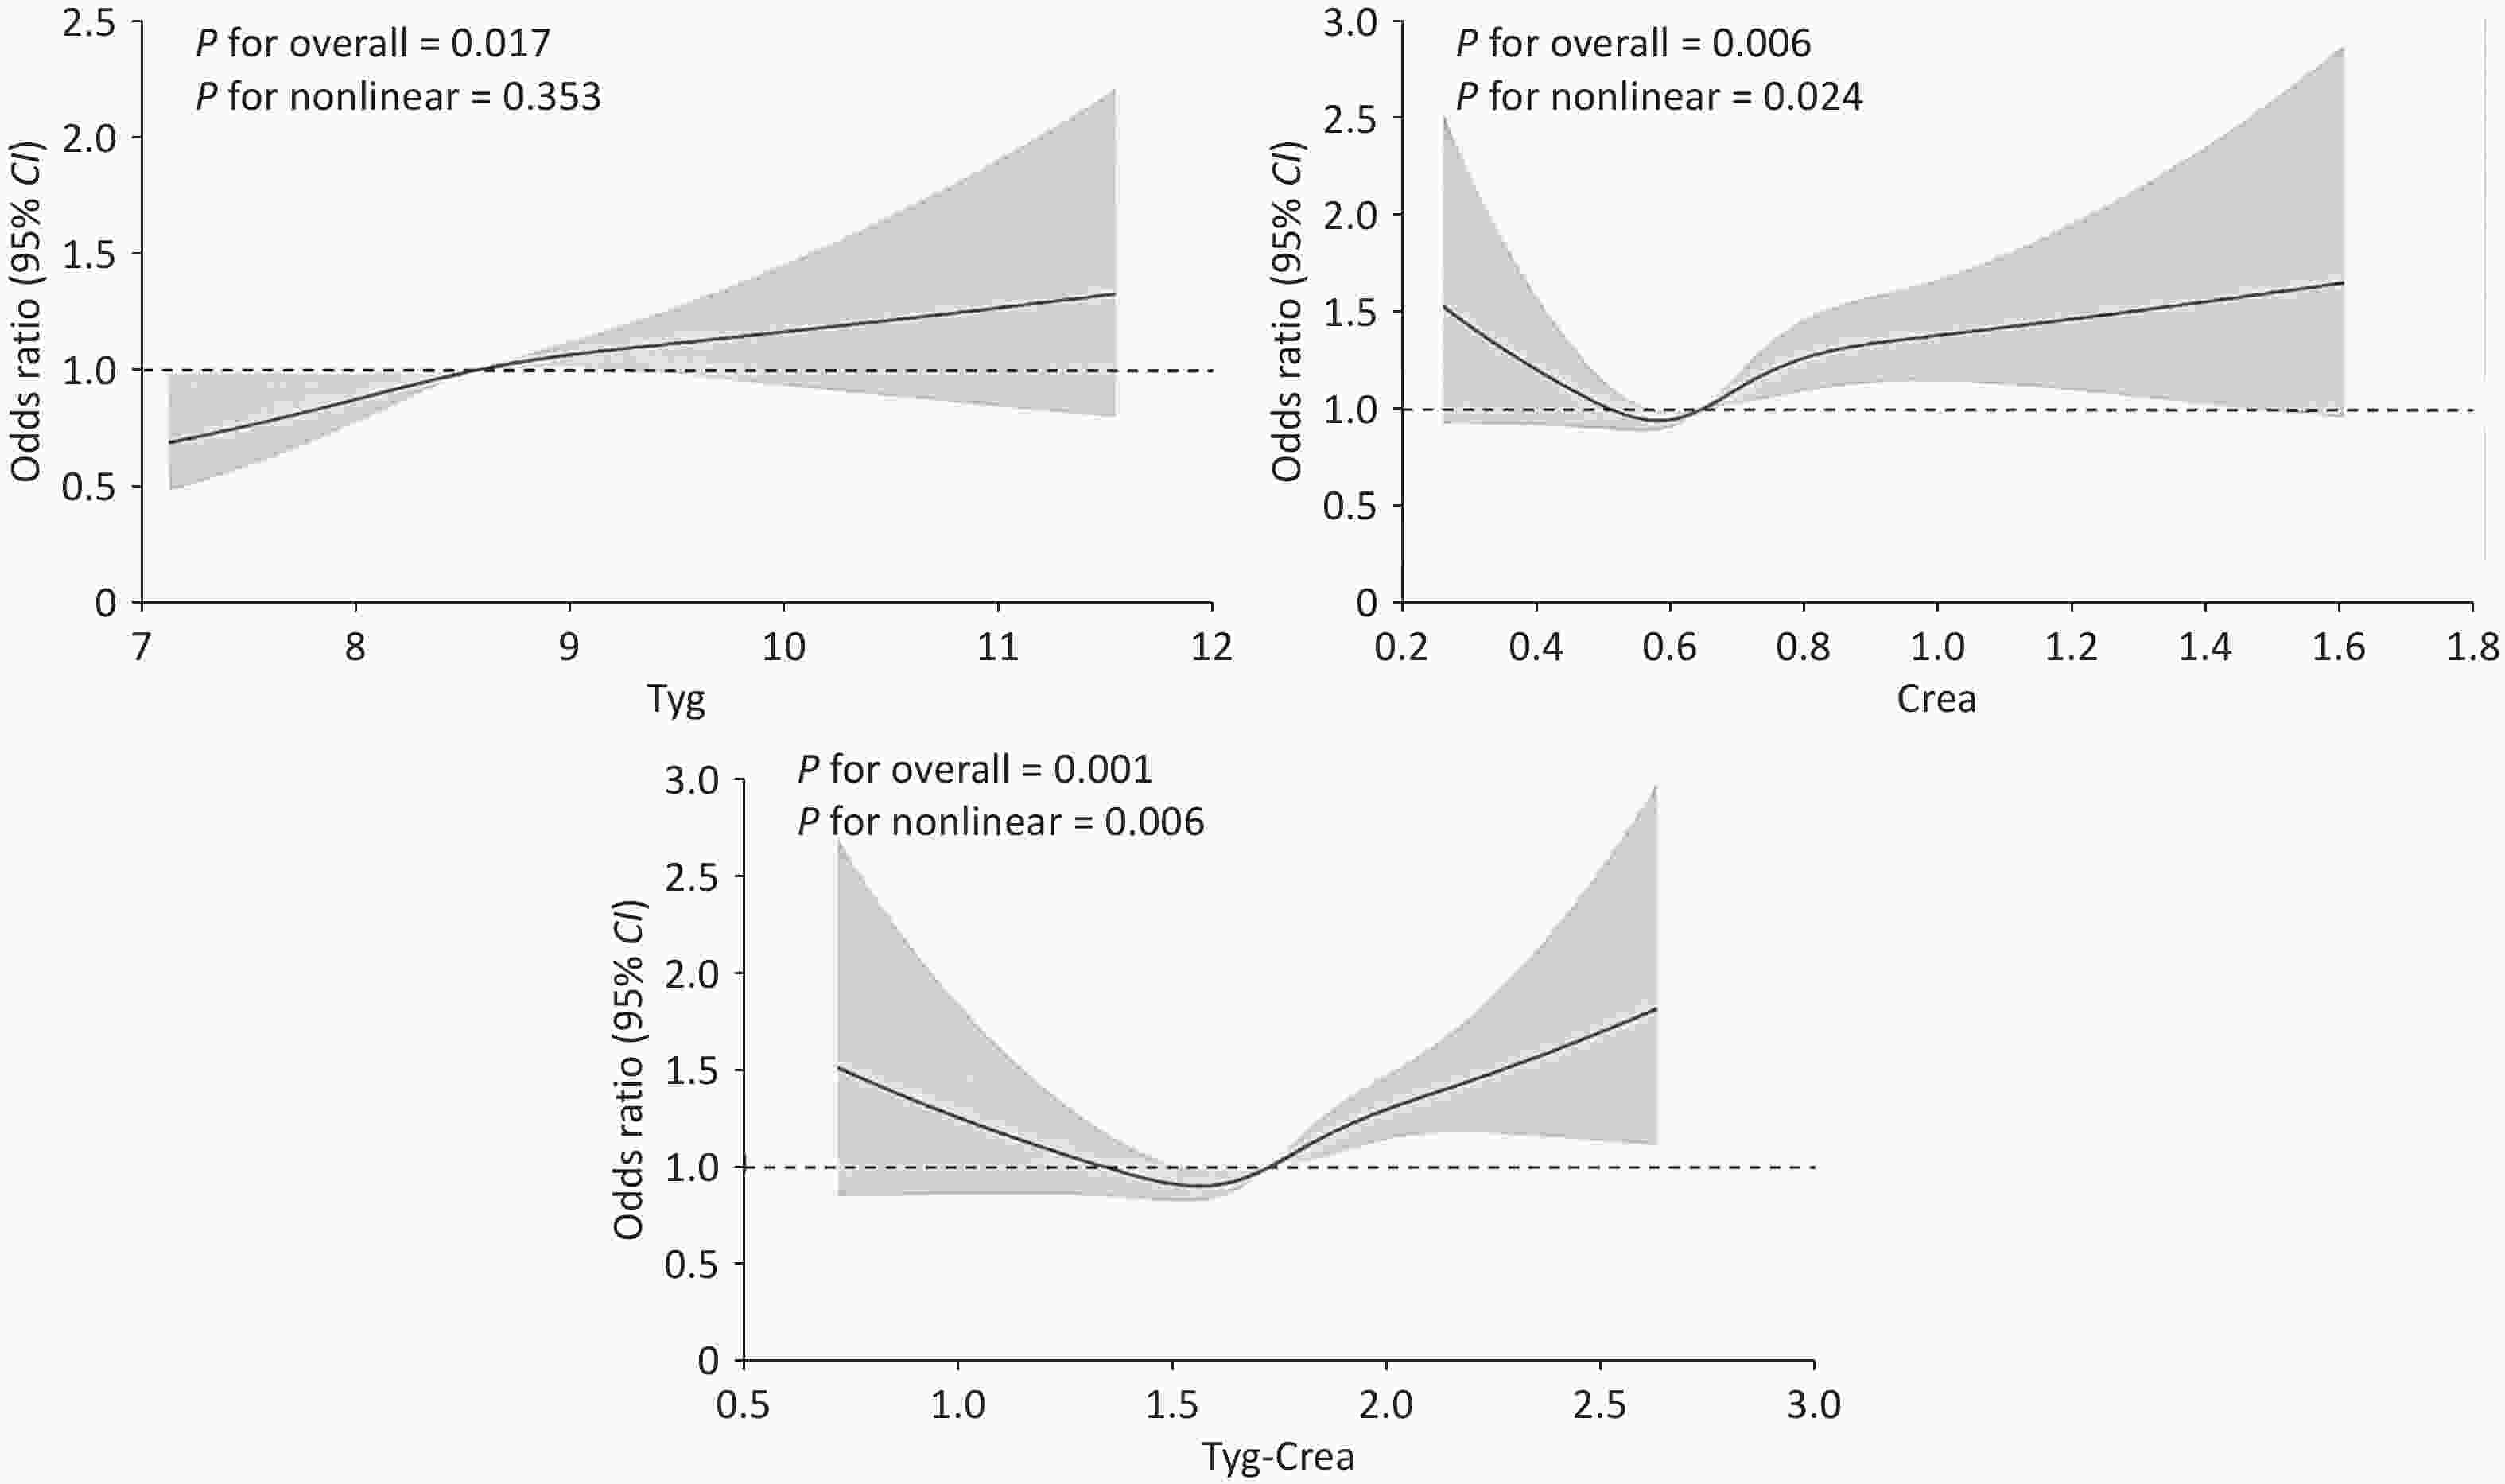
Figure 1. Dose–response associations of the TyG index, Crea, and TyG-Crea indexes with depression symptoms using restricted cubic splines. TyG, triglyceride–glucose; Crea, creatinine.
Subgroup analyses indicated that the positive association between the TyG–Crea index and depressive symptoms was pronounced and consistent among urban dwellers, individuals under 60 years of age, women, and individuals with a normal BMI who were non-smokers and non-drinkers (comprehensive subgroup forest plots are available in Supplementary Figures S2 and S3). Notably, a significant multiplicative interaction was observed for residential status (P for interaction = 0.012), suggesting that environmental, socioeconomic, or lifestyle variations unique to urban living may compound metabolic-renal psychiatric risk. The subgroup analyses showed a pronounced association in participants with a normal BMI. This finding may indicate that BMI alone does not fully reflect the metabolic and renal factors associated with depressive symptoms. Additionally, the heightened vulnerability observed among urban residents may reflect unique interactions with elevated psychological stressors, modern dietary shifts, or socio-environmental pressures. The pronounced pattern in females may be related to age-dependent hormonal variations or muscle mass transitions near menopause, which may contribute to metabolic-renal susceptibility. To assess whether these associations were independent of baseline selection bias or imbalances in demographic characteristics, a 1:4 propensity score matching sensitivity analysis was performed. The baseline-matching balance matrices and distribution curves are provided in Supplementary Tables S3 and S4. Following this matching procedure, independent associations remained statistically unaltered across all biological markers, reinforcing the high internal validity and reproducibility of our primary findings (Supplementary Table S4). The observed synergistic effect may be underpinned by a shared biological "metabolic-renal-brain" axis. Chronic uncompensated insulin resistance is known to trigger peripheral and central inflammatory cascades, damage microvascular endothelial cells, and downregulate neuroplasticity pathways in the hippocampus[3,4]. Subtle or subclinical renal filtration deficits and physical frailty (reflected by creatinine alterations) can exacerbate systemic oxidative stress and cause neuroendocrine axis imbalances[10]. When these two distinct pathways cross the identified biological threshold of 1.580, they appear to interact synergistically, leading to structural blood-brain barrier disruption, localized neuroinflammation, and altered neurotransmitter metabolism, ultimately accelerating mood regulation.
This study has several limitations that should be acknowledged. The cross-sectional design precluded causal inference, and the sample was restricted to a single Chinese cohort. Both measures are surrogates: the TyG index is not equivalent to the glucose clamp, and serum creatinine may be less sensitive than cystatin C or UACR for detecting early renal impairment. Furthermore, potential selection and recall biases from variable exclusions and self-reported SDS scales might exist; however, this misclassification is non-differential, biasing estimates toward the null and ensuring a conservative underestimation. Furthermore, participant exclusions may have introduced selection bias, and the self-reported SDS may have introduced recall or reporting bias; the direction and magnitude of these biases are uncertain. Nonetheless, the large community-based sample, progressive covariate adjustment, and propensity score matching sensitivity analysis support the robustness of these findings.
In conclusion, the novel TyG-Crea index was independently and nonlinearly associated with depressive symptoms, with markedly higher odds above the estimated threshold of 1.580. Given its simplicity, low cost, and ready availability in routine clinical chemistry panels, the TyG-Crea index holds substantial promise as an accessible population-level screening tool to facilitate early risk stratification and support targeted preventive mental health strategies.
HTML
Competing Interests The authors declare that they have no competing financial interests or personal relationships that may have influenced the work reported in this study.
Ethics This study was approved by the Ethics Committee of the Qingdao Center for Disease Control and Prevention. All participants provided written informed consent prior to enrollment. The trial was registered at ClinicalTrials.gov (registration number: NCT01053195).
Authors' Contributions Conceptualization, Data curation, Methodology, Writing—original draft: Shaopeng Guo. Conceptualization, Writing—review & editing: Xiaohui Sun. Conceptualization, Methodology: Hongxuan Yan. Conceptualization: Kejia Huang. Data curation, Software: Chen Chen, Chi Pan. Writing—review & editing, Supervision: Xianyun Wang. Data curation, Validation: Xiao Liu. Conceptualization, Data curation: Ao Li. Conceptualization, Software, Validation: Weijing Wang. Conceptualization, Supervision, Writing—review & editing: Jie Xu. Methodology, Conceptualization, Supervision, Writing—review & editing, Funding acquisition: Feng Ning.
Data Sharing The supplementary materials will be available at www.besjournal.com.
&These authors contributed equally to this work.
Reference

 Quick Links

 DownLoad: