


-
Against the backdrop of a globally aging population, endocrine health in older adults remains a key area of public health research[1]. Sex hormones not only regulate reproductive function but also modulate systemic physiological processes, thereby influencing the pathogenesis of osteoporosis, metabolic disorders, and cognitive decline[2–4]. Although previous studies have confirmed that hormone levels decline with age, most of them have focused primarily on Western populations or younger cohorts of older adults[5]. Significant differences in hormone profiles exist across ethnic groups and lifestyles, thus limiting the applicability of Western reference ranges to Chinese populations. Furthermore, the unique physiological states of individuals in the regions with high life expectancies offer a unique perspective for observing the ultimate trajectory of human aging; however, data from these populations remain scarce.
This study is based on the “Healthy Aging and Biomarkers Cohort Study” (HABCS) and includes data from 5,545 community-dwelling older adults (aged ≥ 65 years) from 18 longevity regions in China. Plasma estradiol (E2), follicle-stimulating hormone (FSH), and testosterone (T) levels were measured by chemiluminescence. Strict quality control measures were implemented. Researchers underwent standardized training, and a multilevel data validation system ensured data integrity. For men, E2 and T values below the limit of detection (LOD) were imputed as LOD/2 (7.5 pg/mL and 5 ng/dL, respectively). In women, the detection rate of E2 was only 10.7%; therefore, it was treated as a binary variable (detected vs. undetected). Data for FSH levels exceeding 200 IU/L were capped at the detection limit. Participants receiving medications for hormone-sensitive conditions (such as prostate cancer, uterine fibroids, or epilepsy) were excluded (Supplementary Figure S1).
The study population has distinct demographic characteristics (Supplementary Table S1). Women (n = 3,206) were significantly older ((87.0 ± 12.0) years) than men (n = 2,339; (83.0 ± 10.5) years). Men demonstrated higher educational attainment, better self-reported health, higher marital rates, and healthier lifestyles (higher smoking/alcohol consumption). Conversely, women have a higher prevalence of dementia, heart disease, and hypertension, whereas men have a higher prevalence of respiratory diseases.
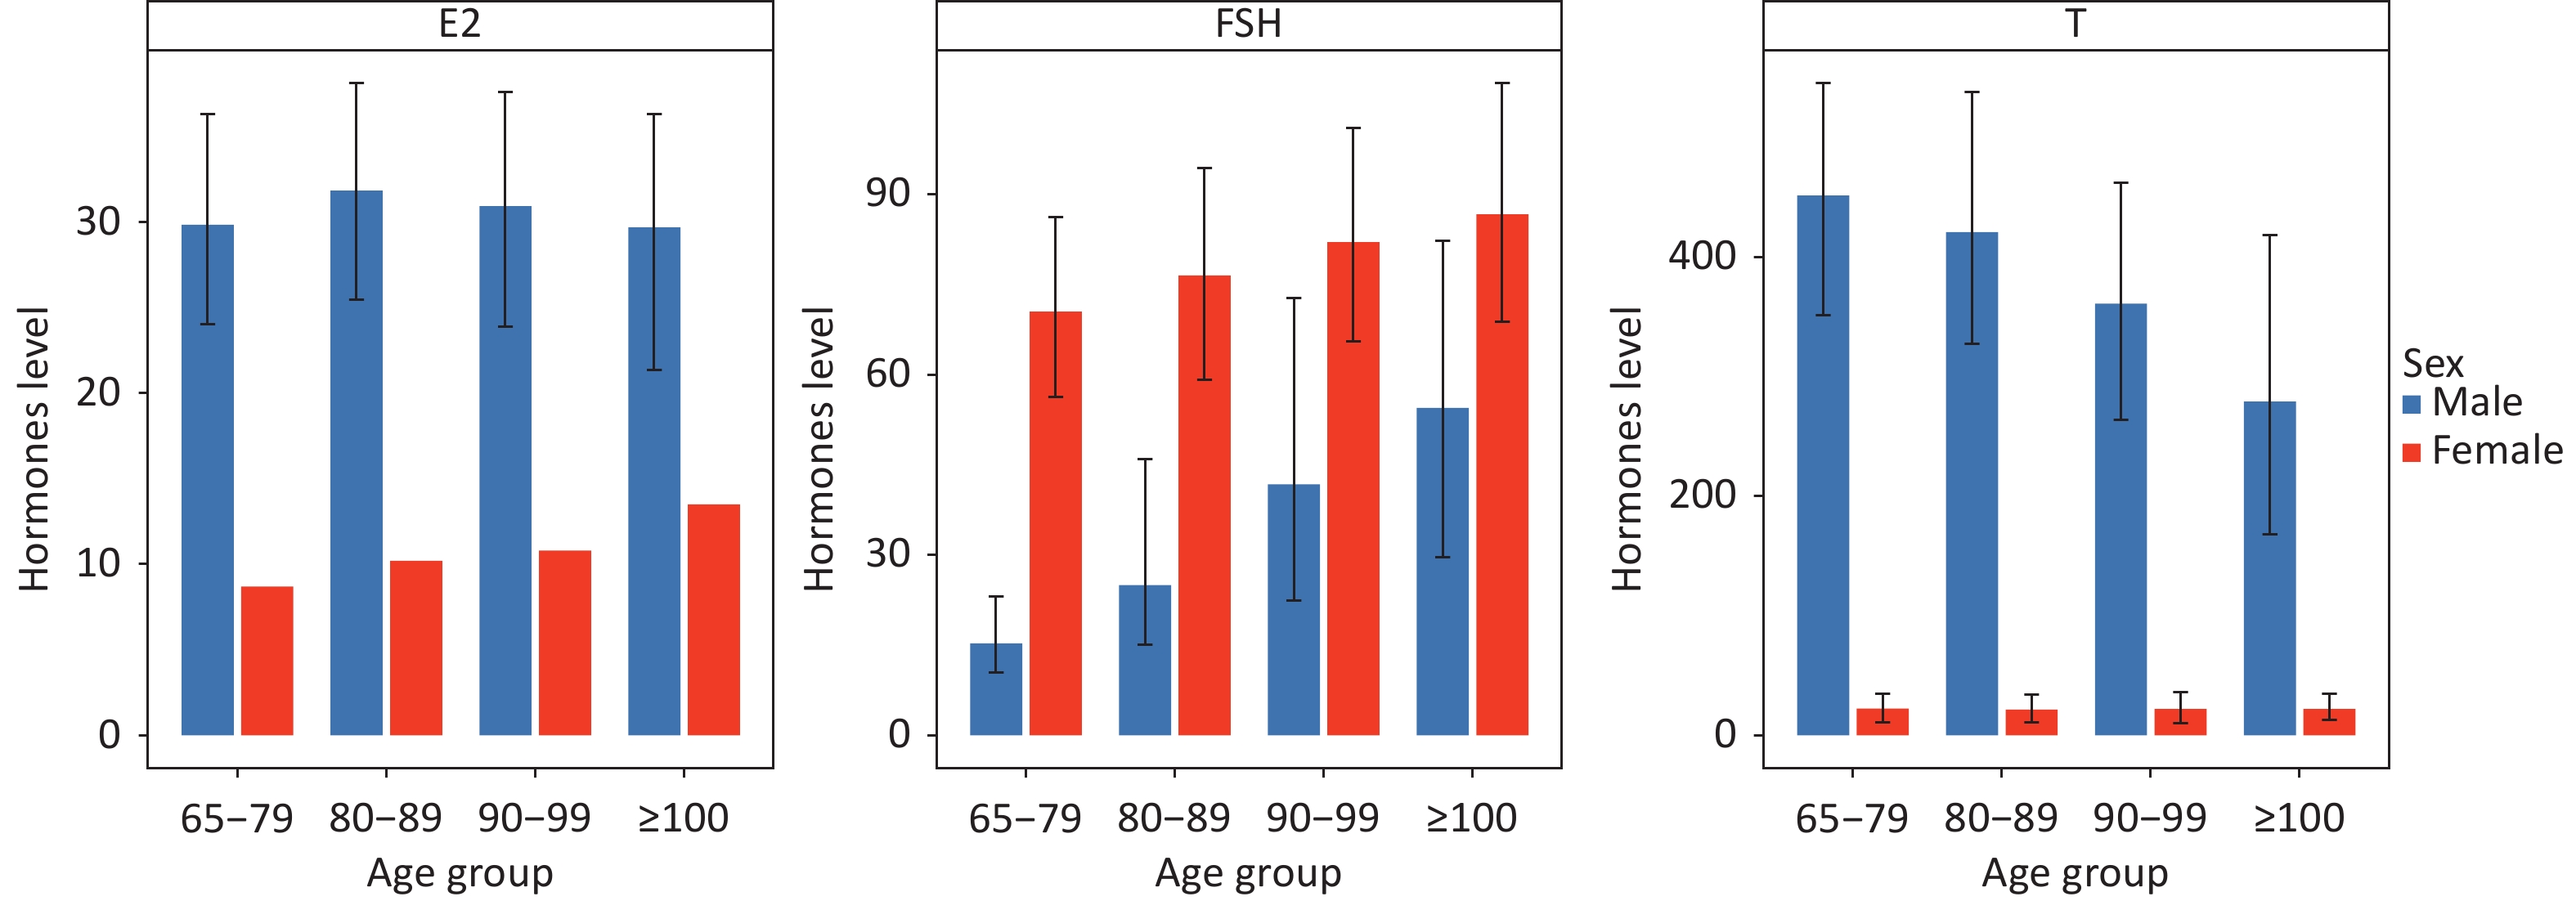
The distribution of the sex hormones revealed striking sexual dimorphisms and age-specific patterns (Supplementary Table S1, Figure 1, Supplementary Figure S2–S3). In men, the T levels showed a progressive decline with age, dropping nearly 40% from the 65–79 group (median: 451.40 ng/dL) to centenarians (median: 279.07 ng/dL). This decline aligns with the concept of gradual Leydig cell senescence[6,7]. Interestingly, male E2 levels remained remarkably stable across all age groups (median, ~30 pg/mL). FSH levels in men rose significantly in the oldest age groups (97th percentile reaching 134.42 IU/L in centenarians).
E2 (pg/mL) FSH(IU/L) T(ng/dL) 65–79 80–89 90–99 ≥100 65–79 80–89 90–99 ≥100 65–79 80–89 90–99 ≥100 Men Total 1,007 647 484 201 1,007 647 484 201 1,007 647 484 201 Min 7.50 7.50 7.50 7.50 0.82 4.54 1.90 1.89 5.00 5.00 5.00 5.00 Max 74.51 77.94 111.65 79.71 132.18 156.71 200.00 200.00 1093.16 945.01 831.24 815.40 Mean 30.23 31.84 30.06 29.07 20.50 34.46 50.40 58.71 452.33 426.80 352.10 297.34 Median 29.83 31.82 30.91 29.67 15.32 25.01 41.75 54.48 451.40 420.81 361.04 279.07 1st 7.50 7.50 7.50 7.50 4.70 5.73 6.30 4.66 19.45 31.16 12.52 15.34 3rd 7.50 7.50 7.50 7.50 5.97 7.32 8.95 10.77 148.12 98.26 33.09 22.19 5th 7.50 7.50 7.50 7.50 6.49 7.93 10.45 14.94 216.13 174.48 76.05 35.58 95th 46.49 49.34 47.29 49.03 58.02 90.94 108.14 119.98 716.96 671.72 609.14 599.24 97th 49.19 52.89 50.32 54.18 66.17 103.67 124.70 134.42 771.35 713.18 645.23 629.94 99th 56.72 60.48 56.37 66.32 94.33 125.98 156.79 147.09 856.78 780.89 695.93 739.57 Women Total 8.7 10.2 10.8 13.5 1,000 756 665 785 1,000 756 665 785 Min - - - - 0.62 0.80 0.96 0.60 5.00 5.00 5.00 5.00 Max - - - - 200.00 200.00 200.00 194.31 783.37 616.40 819.99 577.22 Mean - - - - 72.05 78.73 85.27 88.87 31.98 30.64 31.34 30.48 Median - - - - 70.50 76.52 82.04 86.68 22.38 21.65 22.05 22.11 1st - - - - 10.51 18.27 17.71 10.88 5.00 5.00 5.00 5.00 3rd - - - - 28.34 30.91 35.00 32.88 5.00 5.00 5.00 5.00 5th - - - - 35.67 41.23 41.36 40.22 5.00 5.00 5.00 5.00 95th - - - - 115.44 131.74 142.23 143.05 57.69 65.75 66.01 66.68 97th - - - - 126.18 143.84 149.67 149.85 74.51 81.24 83.34 83.86 99th - - - - 142.12 162.29 169.95 164.73 427.74 366.29 365.75 302.68 Note. Estradiol (E2), follicle-stimulating hormone (FSH), and testosterone (T) concentrations are expressed in traditional units, and the International System of Units (SI) conversion factor is as follows: estradiol, 1 pg/mL = 3.671 pmol/L and testosterone, 1 ng/dL = 0.0347 nmol/L. Table 1. Age- and sex-specific percentile values of sex hormones
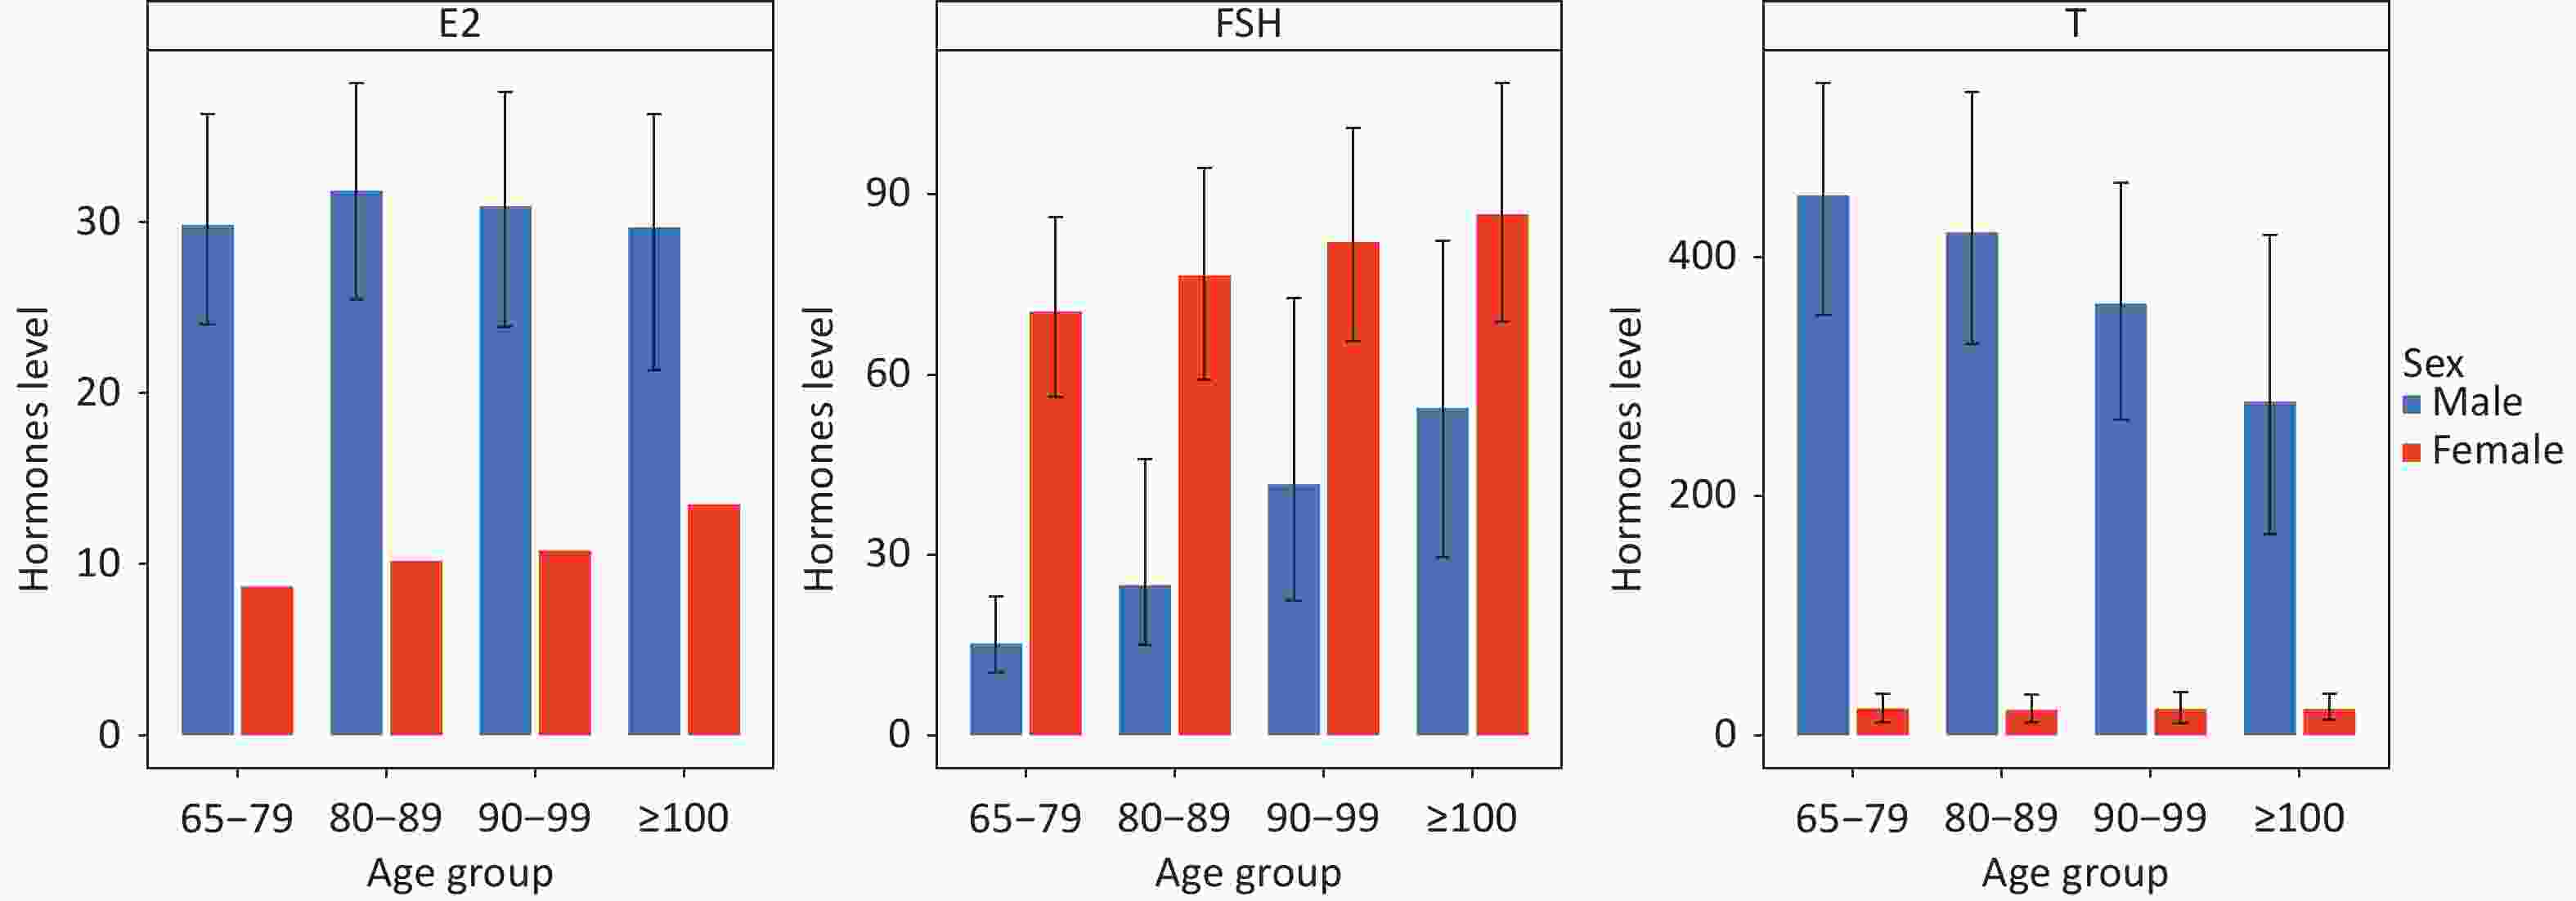
Figure 1. Age-specific distribution of sex hormones by sex. (A) Estradiol (E2) in men; (B) Follicle-stimulating hormone (FSH) in men; (C) Testosterone (T) in men; (D) E2 detection rate in women; (E) FSH in women; (F) T in women. Error bars represent interquartile ranges.
In women, the most notable feature was the near absence of quantifiable E2: 89% of the samples were below the detection limit. However, the detection rate was not the lowest in the youngest-old group but peaked in centenarians (13.5% vs. 8.7% in 65–79). Unlike in men, T levels in women remained stable across age groups (median ~22 ng/dL), whereas FSH levels were uniformly elevated (median >70 IU/L across all groups) (Supplementary Table S2).
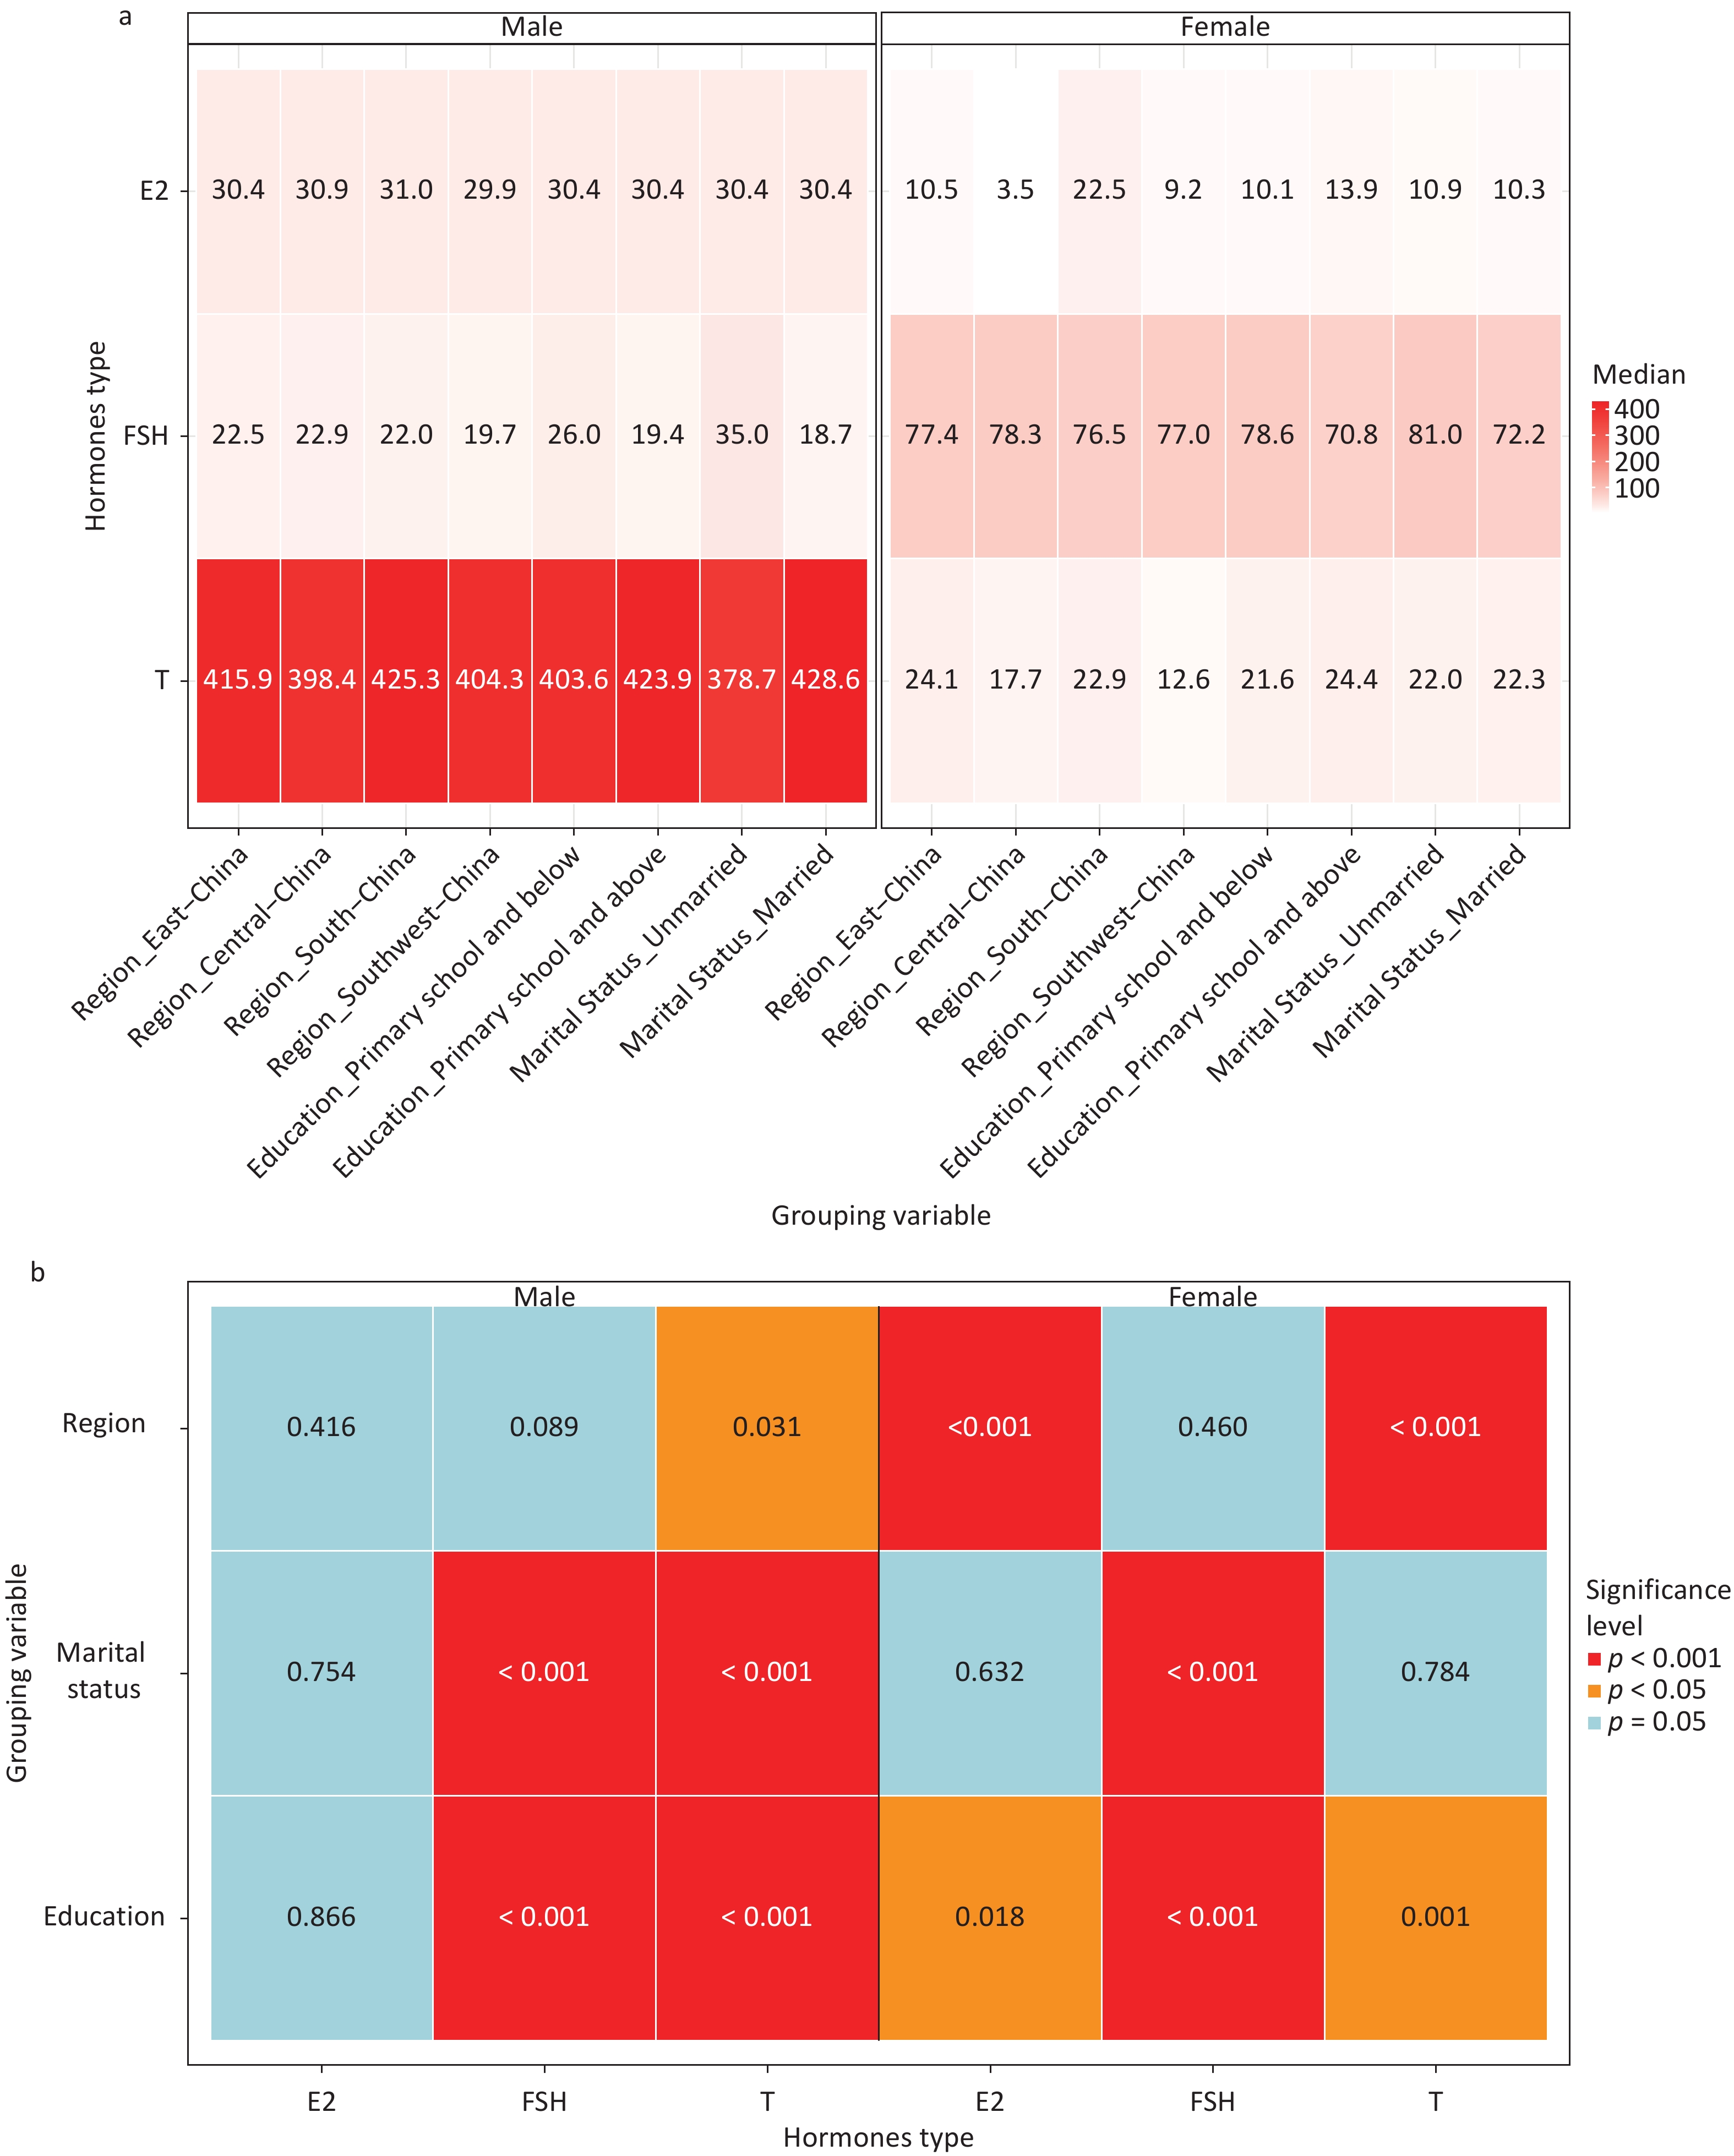
Sociodemographic factors further modified this distribution (Figure 2). Regional disparities were evident; men in South China had higher T levels, whereas women in East China exhibited higher T levels, and those in South China had the highest E2 detection rate (22.5%). This geographic variation may correlate with dietary patterns such as the intake of soy isoflavones prevalent in southern China[10]. Education level also played a role; women with primary school education or above had a significantly higher E2 detection rate (13.9% vs. lower education levels, P = 0.018). Regardless of sex, higher education correlated with lower FSH and higher T levels, suggesting a link between socioeconomic status and endocrine function, potentially mediated by stress responses or epigenetic mechanisms[8,9]. Married men had significantly lower FSH and higher T levels, possibly reflecting psychosocial benefits to the hypothalamic-pituitary-gonadal axis.
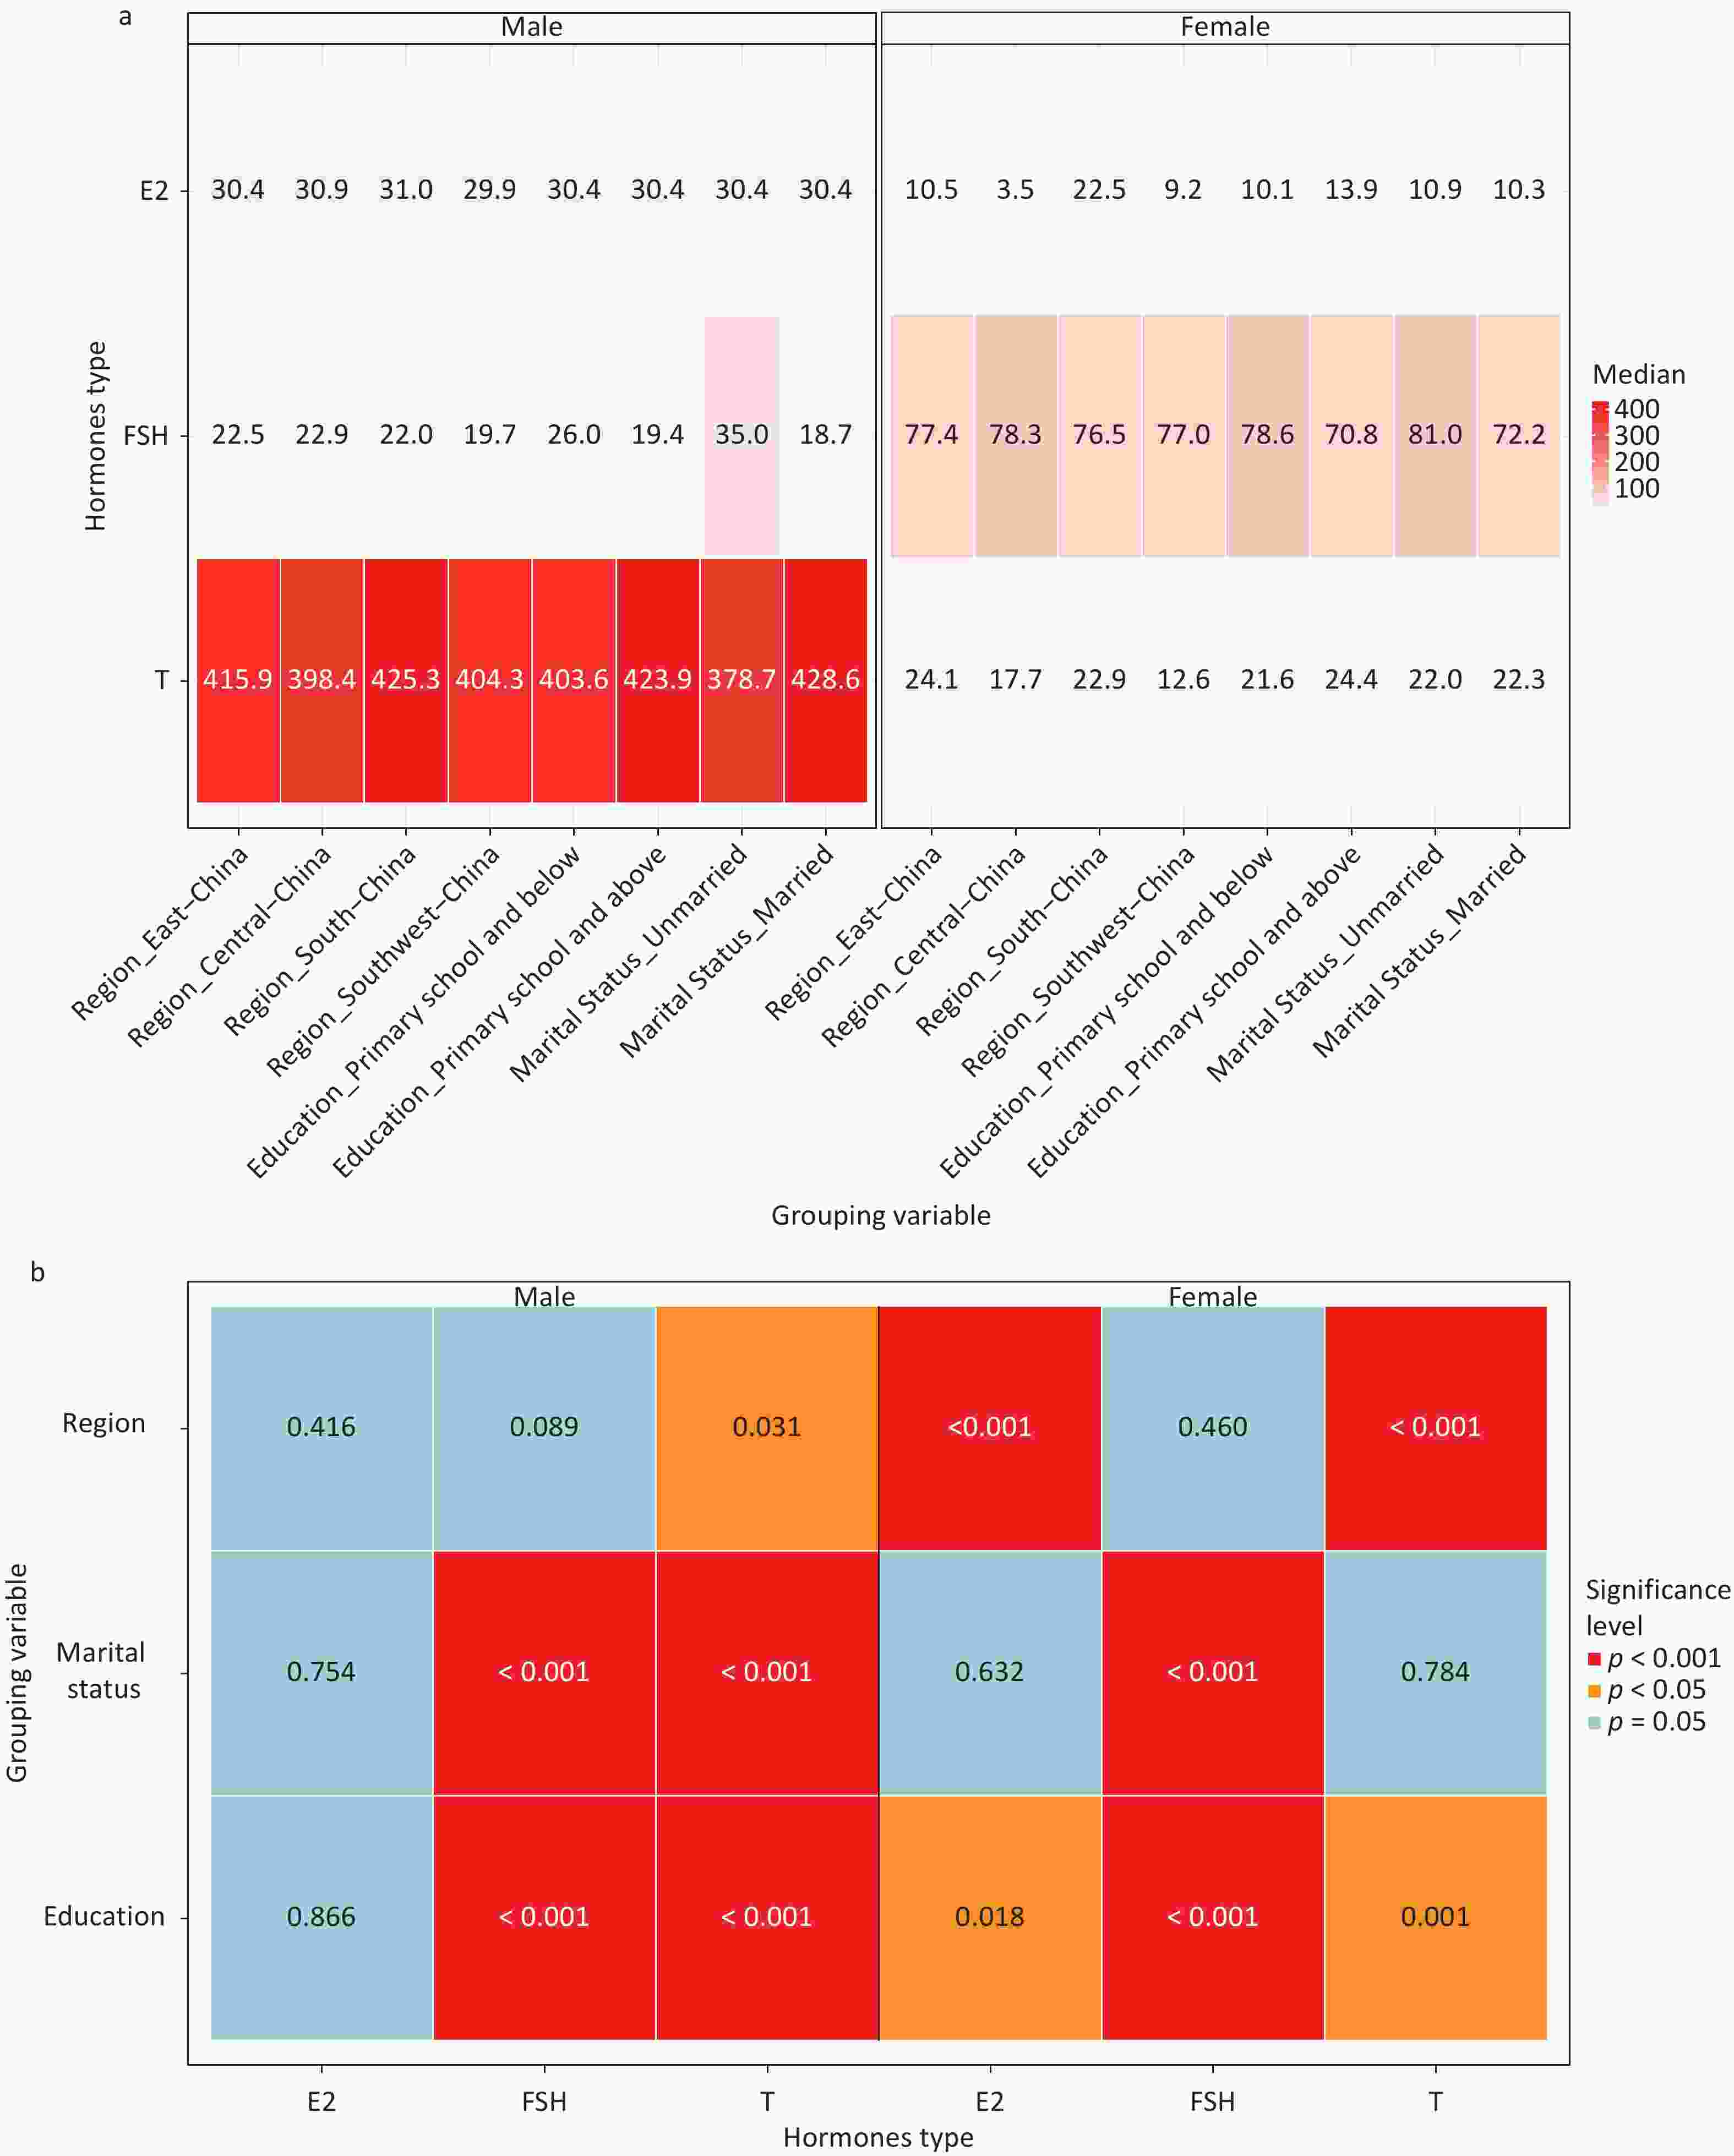
Figure 2. Heat map of median hormone levels across sociodemographic groups. (A) Men; (B) Women. *P < 0.05, P < 0.01,*P < 0.001.
To evaluate robustness, the sensitivity analysis included participants excluded owing to their medication history (Supplementary Tables S3-S5). In addition, missing or undetectable sex hormone values were imputed as LOD/2 in the main analysis. A sensitivity analysis using the ”mice” package for imputation showed no significant differences in percentile estimates. These findings confirm the robustness of our main results (Supplementary Table S6).
This study has several strengths, including its large community-based sample and the simultaneous measurement of three key sex hormones in the oldest-old group. However, this study has some limitations. First, participants were recruited from designated longevity regions, which may limit generalizability to the national population but may provide insights into exceptional aging. Second, the low sensitivity of standard E2 assays in women necessitates caution; clinical evaluation of E2 in elderly women should consider "undetectable" as a physiological norm rather than a pathological deficiency. Third, the cross-sectional design precludes inferences regarding individual hormonal trajectories over time.
In conclusion, this large-scale study provides age- and sex-specific percentile references for sex hormone levels in older Chinese adults. These data highlight that low E2 is the physiological norm in elderly women, whereas T levels in men decline significantly with age. These population-specific references are crucial for the accurate clinical assessment of gonadal function and development of personalized healthy aging strategies in China.
HTML
Competing Interests The authors report no conflicts of interest.
Ethics The study protocol was approved by the Institutional Review Board of the Chinese Center for Disease Control and Prevention's Institute of Environmental Health and Related Product Safety (Approval No. 202029). Written informed consent was obtained from all participants or their legal guardians.
Authors’ Contributions Xiaoshuang Fu, Sirui Chen, Jiahao Chen, and Chen Chen contributed equally to this work. Conceptualization: Yuebin Lv, Xiaoming Shi, and Jiaonan Wang; Methodology: Yuebin Lv, Xiaoming Shi, Jiaonan Wang, and Chen Chen; Formal Analysis: Xiaoshuang Fu, Sirui Chen, and Yuxin Yang; Investigation: Xiaoyan Ma, Jingjing Yang, Xi Meng, Huibin Jiang, Yongqiang Chen, Zenghang Zhang, Ziyue Zhu, Wenhui Shi, and Zhipei Li; Data Curation: Jun Wang, Xiaoshuang Fu, and Sirui Chen; Writing—Original Draft Preparation: Xiaoshuang Fu, Sirui Chen, Jiahao Chen, and Chen Chen; Writing—Review & Editing: All authors; Visualization: Yuxin Yang and Jiahao Chen; Supervision: Yuebin Lv, Xiaoming Shi, and Jiaonan Wang; Project Administration: Yuebin Lv and Xiaoming Shi; Funding Acquisition: Yuebin Lv and Xiaoming Shi. All authors have read and agreed to the published version of the manuscript.
Data Sharing Owing to ethical restrictions, the raw data are not publicly available. However, de-identified data can be obtained from the corresponding author upon reasonable request.
&These authors contributed equally to this work.
Reference

 Quick Links

 DownLoad: