



-
Gastric cancer (GC) is a common cancer worldwide that ranks fifth in incidence and mortality among all cancers[1]. Approximately 40% of the global number of GC deaths occurs in China, resulting in a considerable burden[2]. The nature of asymptomatic presentation in the initial stages of the disease results in most GC patients not being diagnosed until they are in advanced stages of the disease or have developed metastases, thereby resulting in a 5-year survival rate of only 35.9%[3,4]. Screening is an effective measure to reduce the mortality and burden of GC. As a primary screening tool, gastroscopy combined with gastric biopsy for histological examination is currently the gold standard for the screening and diagnosis of GC[5]. However, endoscopic screening is not suitable for censuses because of its high cost, invasiveness, and poor compliance[6]. Therefore, identifying high-risk populations for screening is a viable option to improve cost-effectiveness.
Previous studies have shown that multiple blood biomarkers are associated with the development of GC. Inflammatory responses, as a characteristic feature of the tumor microenvironment, participate throughout the entire process of GC initiation and progression. During the initial stages of GC development, various inflammatory cells within the immune system, such as neutrophils and lymphocytes, infiltrate the tumor stroma and release pro-inflammatory factors, leading to elevated levels of these cells in the blood[7,8]. Conversely, reduced levels of high-density lipoprotein cholesterol (HDL-C), which possesses antioxidant and anti-inflammatory properties, correlate with an increased GC risk[9]. GC progression also involves interactions between the body's coagulation and anticoagulation systems, potentially manifesting as alterations in coagulation-related biomarkers such as platelet indices[10]. Certain serum tumor markers such as carbohydrate antigen (CA) 125, CA72-4, CA19-9, and carcinoembryonic antigen (CEA) are widely used for recurrence monitoring, prognostic assessment, and auxiliary diagnosis of various tumors, including GC[11,12]. However, these traditional tumor markers have limited predictive capabilities and are often associated with multiple cancers, resulting in insufficient sensitivity and specificity[13]. Previous studies have indicated that combined prediction using multiple blood markers often yields better results than using single markers[14]. Therefore, identifying optimal predictive combinations by integrating diverse blood markers can enhance screening efficacy and provide new insights for GC diagnostic research.
Genetic susceptibility is also an important contributor to the development of GC. A study focusing on twins from northern Europe estimated the heritability of GC to be approximately 22%[15]. Multiple genome-wide association studies (GWAS) have identified several GC-related single nucleotide polymorphisms (SNPs)[16]. Previous studies have aggregated these variants to establish polygenic risk scores (PRS) for assessing genetic risk in the Chinese population[17]. Recent gene-environment interaction studies have indicated that, in many cases, the effects of genetic factors are influenced by environmental conditions and interact with them to affect cancer development[18]. Blood indices can reflect the effect of environmental factors; however, the combined effects of blood indices and genetic factors remain unclear. Therefore, our study aimed to detect blood indices associated with GC to generate a blood test score (BTS) and test the utility and effectiveness of this score in predicting the risk of incident GC. We subsequently used the PRS to assess the extent to which the presentation of a high BTS score may increase the risk of incident GC in different genetic backgrounds.
-
We conducted a nested case-control study using a prospective cohort. All the data included in this analysis were obtained from the Taihu Biobank of Tumor Biomarkers (TBTB) cohort. The TBTB cohort was a large-scale study that included 538,618 participants recruited from Wuxi, Jiangsu Province. All participants were older than 45 years and recruited at baseline between August 2020 and December 2021. At baseline, all the participants completed face-to-face questionnaires, physical examinations and clinical tests[19].
This study included all new GC cases diagnosed after baseline, and the diagnoses were confirmed via medical records from hospitals and the cancer registration system. When the study participants were diagnosed with GC, their demographic information and International Classification of Diseases, Tenth Revision (ICD-10: C16.0–C16.6, C16.8–C16.9) data were obtained from the cancer registration system. Case reviews were performed using outpatient, inpatient, diagnostic, and pathological information from the hospital information system. By December 31, 2022, 1,388 study participants were diagnosed with GC, and we included 1,612 controls via group matching, with age and sex as matching factors.
-
The demographic characteristics and blood indices of the study population were measured at baseline. Demographic data including age, sex, waist circumference, and body mass index (BMI) were obtained using questionnaires and physical examinations. Considering the significant association between Helicobacter pylori (H. pylori) and GC[20], H. pylori infection was additionally tested. Blood indices obtained from laboratories at local hospitals included routine blood tests [white blood cell count (WBC), red blood cell count (RBC), hemoglobin (HGB), platelet (PLT) count, neutrophils (count and percentage), lymphocytes (count and percentage), monocytes (count and percentage), eosinophils (count and percentage), basophils (count and percentage), hematocrit, mean corpuscular volume (MCV), mean corpuscular hemoglobin (MCH), mean corpuscular hemoglobin concentration (MCHC), platelet hematocrit (PCT), mean platelet volume (MPV), platelet distribution width (PDW), red blood cell distribution width coefficient of variation (RDW-CV), red blood cell distribution width SD (RDW-SD), and large platelet ratio (LPR)], blood lipid levels [triglyceride (TG), total cholesterol (TC), high-density lipoprotein cholesterol (HDL-C), and low-density lipoprotein cholesterol (LDL-C)], and tumor biomarkers [CA19-9, CA125, CA72-4, CEA, and pepsinogen I-II ratio (PGI/PGII)]. Additionally, based on previous studies, we also calculated the NLR, PLR, NHR, PHR, LHR, and SII using the aforementioned indices, totaling 39 items. We then counted the proportion of missing values for each blood index and excluded those with a large proportion of missing values (> 20%) (Supplementary Table S1). As a result, 10 blood indices were excluded and 29 blood indices were ultimately included in our study.
-
Genome-wide genotyping was performed using Illumina's Infinium Asian Array-24 v1.0 (ASA) chip. The chip included 659,184 loci designed for East Asian populations. Imputation was performed using the Westlake Imputation Server, based on the merged WBBC phase 1 and 1,000 Genomes phase 3 panels. Markers with a minor allele frequency (MAF) > 0.05 were retained. Detailed information on sample acquisition, genotype imputation, and quality control is described in the Additional file (Supplementary Appendix S1). After excluding individuals with genomic data that did not meet the quality control criteria (n = 146), 1,352 cases and 1,502 controls were ultimately included.
-
A two-stage design was used. First, we identified blood-based biomarkers associated with GC in the training set and constructed a blood test score (BTS). In the second stage, we evaluated the predictive performance of BTS in the testing set and assessed the combined predictive effectiveness of BTS and PRS.
For continuous variables, the sex-specific median value of each variable was used to replace the missing values. For categorical variables, we performed multiple imputations five times (each with 10 iterations) and used the mode of the imputed values. We performed log-transformation of skewed variables with skewness > 1.5 or < −1.5. All participants were then divided into training and testing sets in a 7:3 ratio. In the training set, both linear and nonlinear associations were assessed between 29 biomarkers and GC. Linear associations of the variables were evaluated using logistic regression models with age, sex, BMI, waist circumference, and H. pylori as covariates. Nonlinear associations were examined using logistic regression models with a restricted cubic spline (RCS), and three nodes were set for each biomarker at the 10th, 50th, and 90th percentiles. Variables with U-shaped nonlinear correlations were segmented using the median as the node for segmentation (Supplementary Appendix S1). These variables were subsequently incorporated into a least absolute shrinkage and selection operator (LASSO) logistic model to predict GC incidence. We tuned the hyperparameter λ via fivefold cross-validation with 20 repeats and chose the largest λmin value for the final model[21]. For biomarker integrity, both segments were retained as predictors (even when only one segment was selected via LASSO). The BTS was calculated for each participant as a linear combination of all selected predictors, weighted according to the regression coefficients in the aforementioned logistic model.
After the BTS was generated, linear and nonlinear associations between the BTS and incident GC were examined. To observe trends, the participants in the training and testing sets were categorized into five groups based on the quintiles of the BTS. We used receiver operating characteristic (ROC) curves, calibration curves, and decision curve analysis to evaluate the discrimination, accuracy, and clinical utility of the BTS[22-25]. Subgroup analysis was performed to evaluate the heterogeneity of the association between BTS and GC risk, stratified by GC type and TNM stage. Additionally, we constructed simplified models using λ1se and evaluated their predictive effects using sensitivity analysis. All abovementioned analyses were adjusted for age, sex, BMI, waist circumference, and H. pylori as covariates.
Based on previous studies on PRS in Chinese Han populations, we determined the SNPs associated with GC and the effect sizes that were needed to calculate PRS[17]. After generating the PRS, odds ratio (OR) values were used to compare the differences in the risk of incident GC between the different groups and those who exhibited low BTS and genetic risk. To assess multiplicative interactions, we included the product terms of BTS and PRS in our model. All analyses were performed using R 4.5.1 and PLINK 1.90 software.
-
According to the inclusion and exclusion criteria, 1,352 patients and 1,502 controls were enrolled in this study. The cases included 297 patients with esophageal cardia cancer (22.0%) and 1,055 patients with non-esophageal cardia cancer (78.0%). The proportion of H. pylori infection was higher in the case group than in the control group (64.6% vs. 54.5%, P < 0.001). As this nested case-control study was matched for age and sex, there were no statistically significant differences in age or sex between the case and control groups. After randomly dividing the participants into training and testing sets, the training set included 940 cases (47.0% of the training set), and the testing set included 412 cases (48.1% of the testing set). The differences in all the biomarkers between the training and testing sets were not statistically significant. Demographic and clinical data of the populations in the training and testing sets are presented in Table 1.
Variables Training set (N = 1,998) Testing set (N = 856) GC group
(n = 940)Non-GC group
(n = 1,058)GC group
(n = 412)Non-GC group
(n = 444)Age (years) 71.20 ± 7.10 71.11 ± 1.92 71.24 ± 7.12 71.15 ± 2.03 Sex, % Male 686 (72.98) 731 (69.09) 284 (68.93) 300 (67.57) Female 254 (27.02) 327 (30.91) 128 (31.07) 144 (32.43) Waist (cm) 85.64 ± 8.64 85.84 ± 8.77 85.65 ± 9.03 86.03 ± 8.96 BMI (kg/m2) 24.07 ± 3.19 24.24 ± 3.13 24.13 ± 3.47 24.10 ± 3.41 H. pylori, % Positive 606 (64.47) 581 (54.91) 267 (64.81) 237 (53.38) Negative 334 (35.53) 477 (45.09) 145 (35.19) 207 (46.62) GC type, % Cardiac 197 (20.96) / 100 (24.27) / Non-cardiac 743 (79.04) / 312 (75.73) / TNM stage, % I 211 (22.45) / 98 (23.79) / II 170 (18.09) / 67 (16.26) / III 127 (13.51) / 62 (15.05) / IV 89 (9.47) / 36 (8.74) / Unknown 343 (36.48) / 149 (36.16) / HGB (g/L) 141.63 ± 16.90 144.33 ± 14.23 140.89 ± 16.78 144.32 ± 13.85 WBC (×109/L) 6.33 ± 1.55 6.03 ± 1.42 6.28 ± 1.52 5.97 ± 1.42 PLT (×109/L) 207.19 ± 59.47 199.33 ± 52.44 207.31 ± 58.60 199.21 ± 52.86 NE% (%) 58.93 ± 8.04 57.54 ± 8.07 58.97 ± 8.23 56.71 ± 8.14 LYM% (%) 31.74 ± 7.61 33.21 ± 7.69 31.71 ± 7.86 33.81 ± 7.54 NE (×109/L) 3.75 ± 1.18 3.49 ± 1.05 3.73 ± 1.10 3.41 ± 1.06 LYM (×109/L) 1.97 ± 0.58 1.98 ± 0.59 1.97 ± 0.62 1.99 ± 0.57 RBC (×1012/L) 4.65 ± 0.51 4.69 ± 0.46 4.61 ± 0.50 4.70 ± 0.45 MCV (fL) 92.79 ± 5.62 92.40 ± 4.88 92.92 ± 5.39 92.15 ± 4.71 MCH (pg) 30.43 ± 2.31 30.75 ± 1.95 30.56 ± 2.22 30.70 ± 1.79 MCHC (g/L) 328.30 ± 13.42 333.04 ± 13.28 328.90 ± 13.20 333.35 ± 13.38 RDW-CV (%) 13.10 (12.60–13.60) 13.10 (12.60–13.60) 13.10 (12.50−13.63) 13.00 (12.60−13.40) MPV (fL) 10.28 ± 1.34 10.50 ± 1.34 10.28 ± 1.35 10.62 ± 1.32 PDW (%) 14.41 ± 2.51 14.12 ± 2.81 14.41 ± 2.42 14.27 ± 2.74 TC (mmol/L) 4.89 ± 0.96 5.05 ± 0.97 4.99 ± 1.01 5.05 ± 0.96 TG (mmol/L) 1.34 (0.98–1.92) 1.38 (1.00–1.98) 1.30 (0.99−1.84) 1.45 (1.04−2.04) HDL-C (mmol/L) 1.34 ± 0.34 1.39 ± 0.35 1.38 ± 0.35 1.37 ± 0.33 LDL-C (mmol/L) 2.79 ± 0.82 2.89 ± 0.84 2.91 ± 0.85 2.85 ± 0.82 NLR 1.84 (1.48–2.42) 1.75 (1.37–2.23) 1.84 (1.47−2.43) 1.71 (1.31−2.20) PLR 106.86 (81.97–134.76) 100.91 (81.74–126.59) 104.10 (86.07−128.42) 101.60 (79.16−124.62) SII (×109/L) 365.64 (267.94–516.45) 333.74 (251.87–458.23) 367.64 (278.76−503.31) 329.67 (236.04−440.83) NHR (×109/mmol) 3.00 ± 1.30 2.67 ± 1.06 2.90 ± 1.20 2.64 ± 1.05 PHR (×109/mmol) 163.83 ± 62.61 151.57 ± 53.76 159.48 ± 60.48 152.84 ± 52.81 LHR (×109/mmol) 1.57 ± 0.63 1.52 ± 0.61 1.53 ± 0.66 1.54 ± 0.57 CA19-9 (U/mL) 9.57 (5.25–17.24) 8.63 (5.25–14.33) 9.15 (5.25−15.37) 8.73 (5.25−13.73) CA125 (U/mL) 8.56 (6.64–11.56) 8.41 (6.40–11.32) 8.85 (6.78−12.27) 8.73 (6.58−11.48) CA72-4 (U/mL) 1.02 (1.02–2.95) 1.02 (1.02–2.15) 1.02 (1.02−2.74) 1.02 (1.02−1.85) CEA (ng/mL) 1.82 (1.13–3.08) 1.76 (1.13–2.64) 1.92 (1.22−3.31) 1.80 (1.12−2.68) PGI/PGII 5.81 ± 2.76 7.41 ± 2.71 5.94 ± 2.67 7.43 ± 2.68 Note. Continuous variables with normal distribution are presented as mean ± standard deviation, whereas non-normally distributed variables are presented as median (interquartile range). GC, gastric cancer; BMI, body mass index; H. pylori, Helicobacter pylori; TNM, tumor-node-metastasis; HGB, hemoglobin; WBC, white blood cell count; PLT, platelet; NE, neutrophils; LYM, lymphocytes; RBC, red blood cell count; MCV, mean corpuscular volume; MCH, mean corpuscular hemoglobin; MCHC, mean corpuscular hemoglobin concentration; RDW-CV, red blood cell distribution width coefficient of variation; MPV, mean platelet volume; PDW, platelet distribution width; TC, total cholesterol; TG, triglyceride; HDL-C, high-density lipoprotein cholesterol; LDL-C, low-density lipoprotein cholesterol; NLR, neutrophil-to-lymphocyte ratio; PLR, platelet-to-lymphocyte ratio; SII, systemic immune-inflammation index; NHR, neutrophil-to-high-density lipoprotein cholesterol ratio; PHR, platelet-to-high-density lipoprotein cholesterol ratio; LHR, lymphocyte-to-high-density lipoprotein cholesterol ratio; CA, carbohydrate antigen; CEA, carcinoembryonic antigen; PGI/PGII, pepsinogen I-II ratio. Table 1. Demographic characteristics and blood indicators of the study population
-
In the training set, 20 and 4 biomarkers demonstrated linear and nonlinear associations with GC incidence, respectively, including two overlapping biomarkers (Supplementary Table S2 and Figure S1). The MCV and PDW exhibited significant U-shaped associations with GC. After segmenting these variables into U-shaped nonlinear associations using the median as a node, the LASSO logistic regression model identified 14 significantly associated biomarkers: TC, CA19-9, RDW-CV, PHR, PDW, MCV, CEA, NHR, CA72-4, HGB, MPV, LYM%, MCHC, and PGI/PGII. The BTS was computed from the 14 aforementioned variables, and the weights were estimated by fitting a multivariate logistic model (Supplementary Table S3).
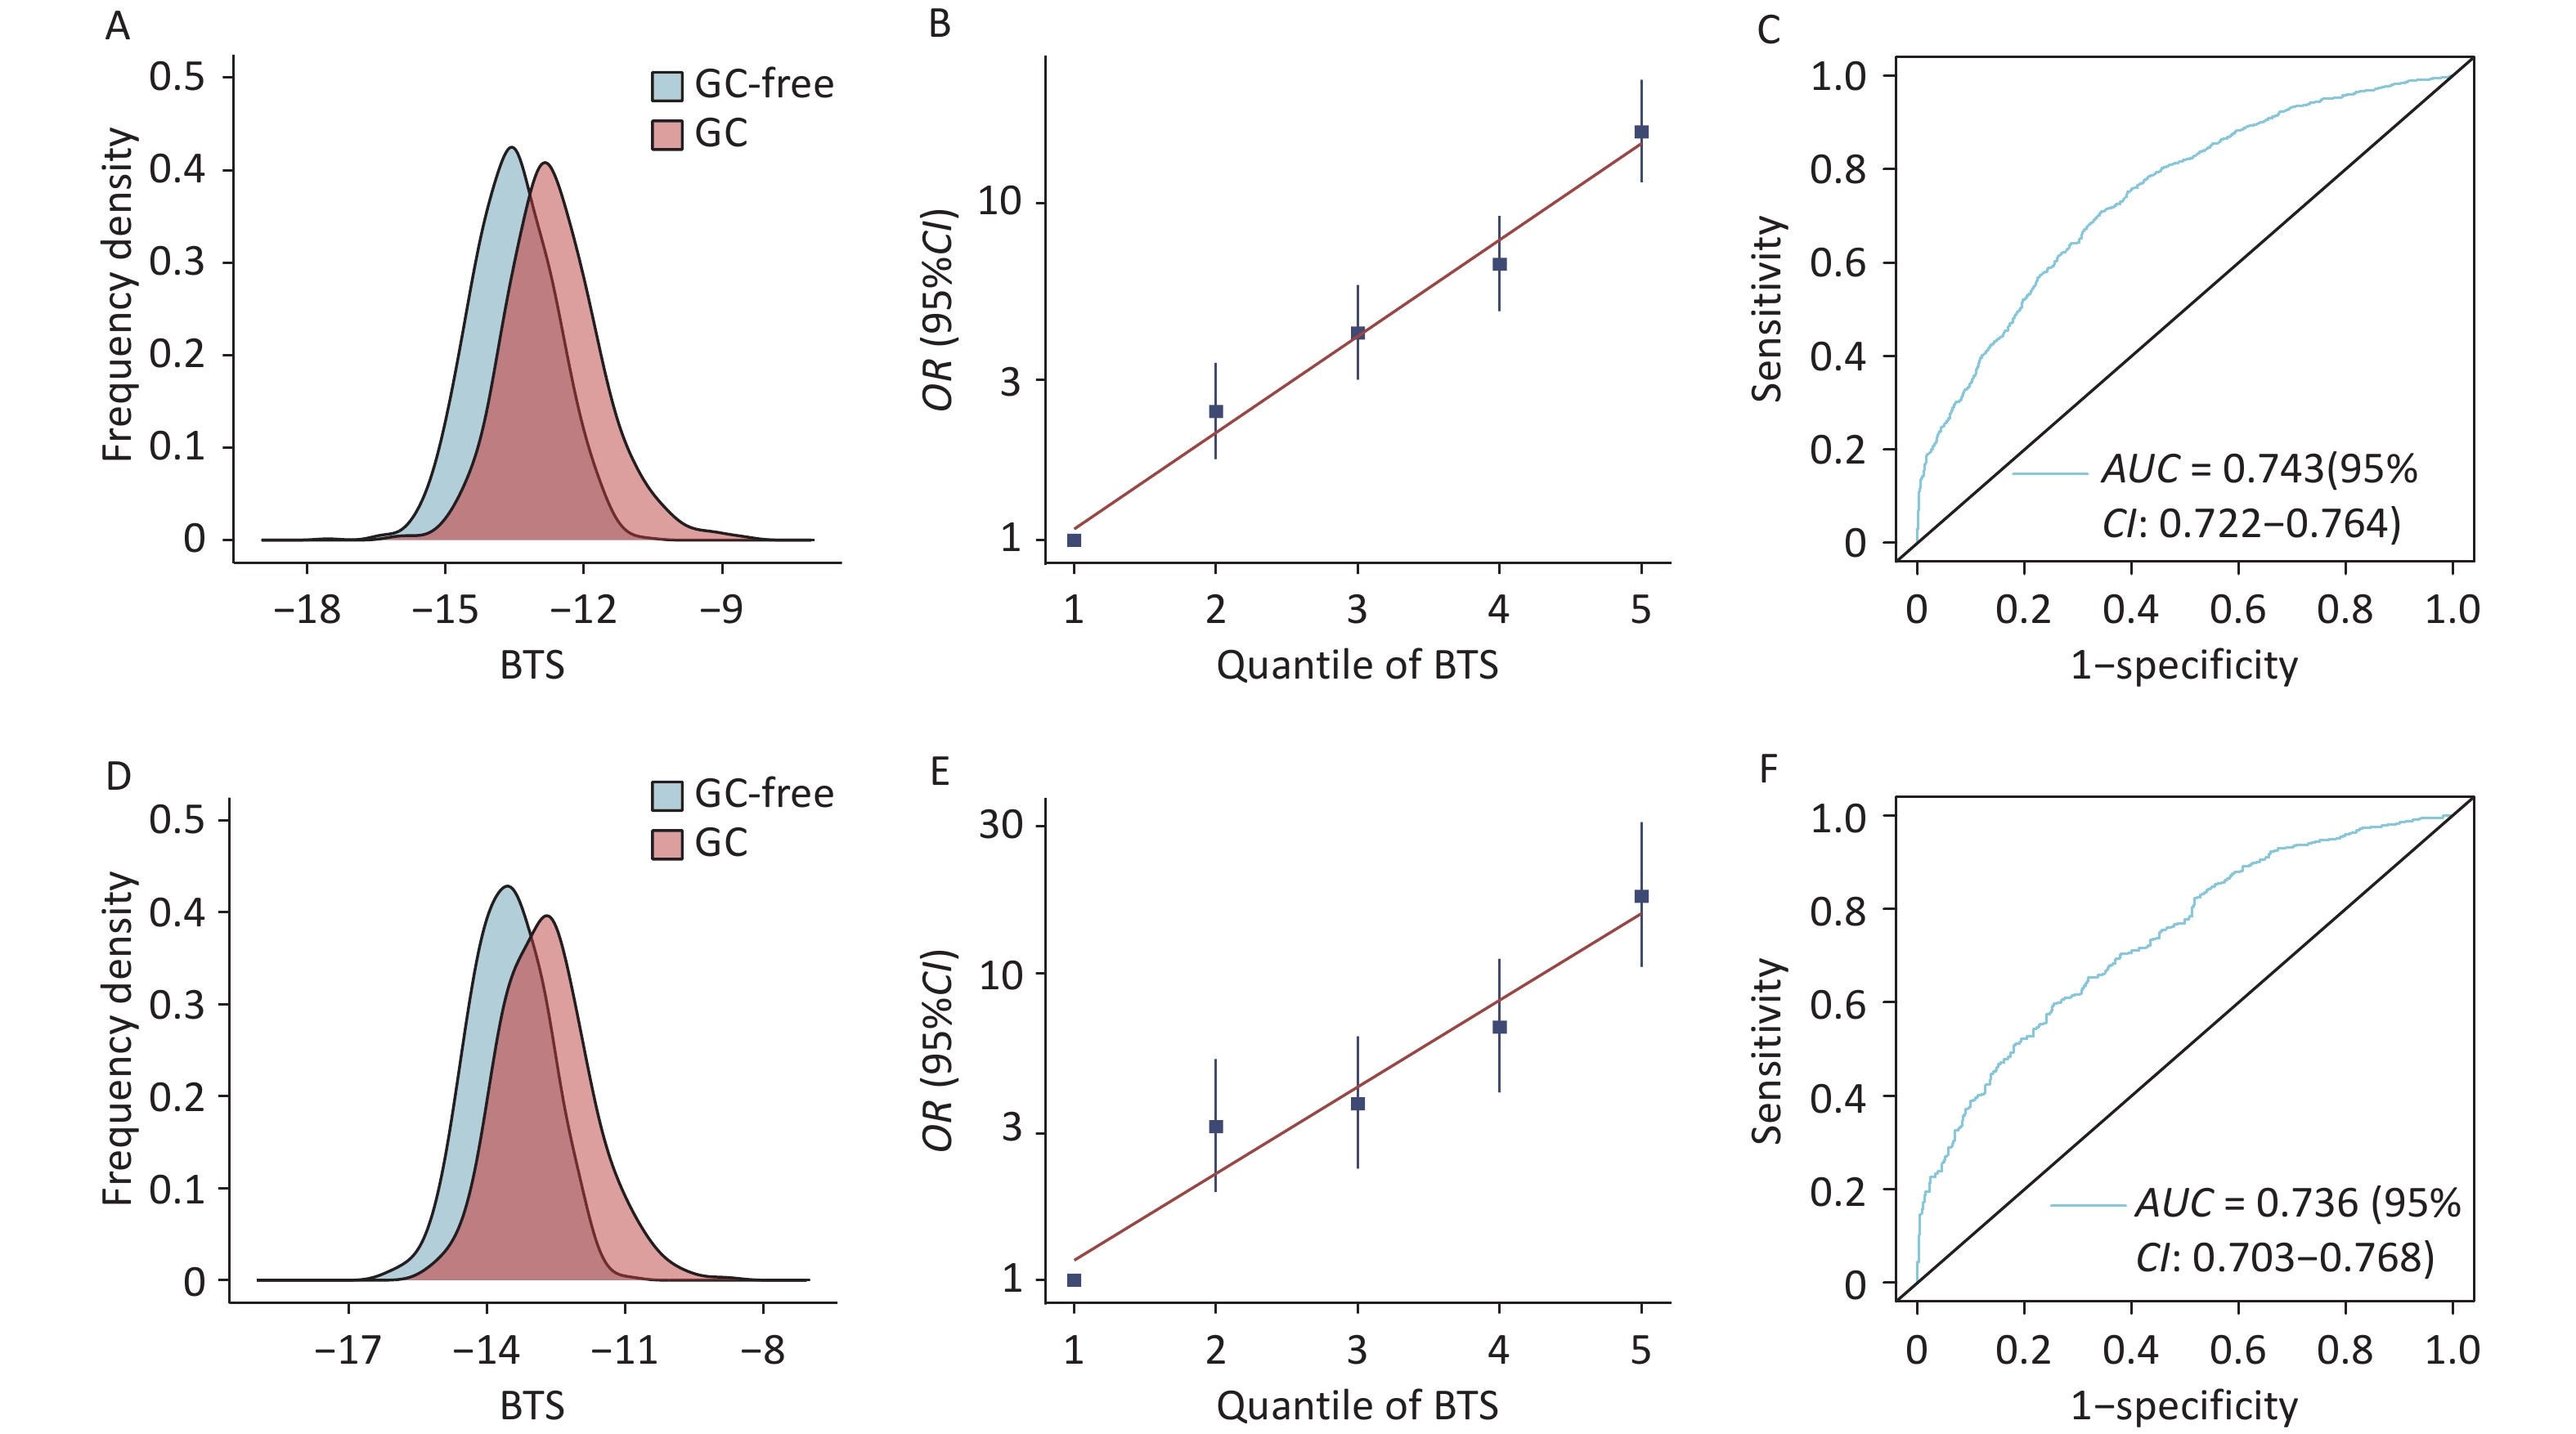
There was no significant difference in the BTS distribution between the training set and the testing set (−13.13 ± 1.07 vs. −13.14 ± 1.00, P = 0.643). A significantly greater BTS was observed in patients with GC compared to controls in the training and testing sets (−12.65 ± 1.05 vs. −13.54 ± 0.91, P < 0.001; −12.72 ± 0.99 vs. −13.54 ± 0.84, P < 0.001, respectively) (Figure 1A, Figure 1D).
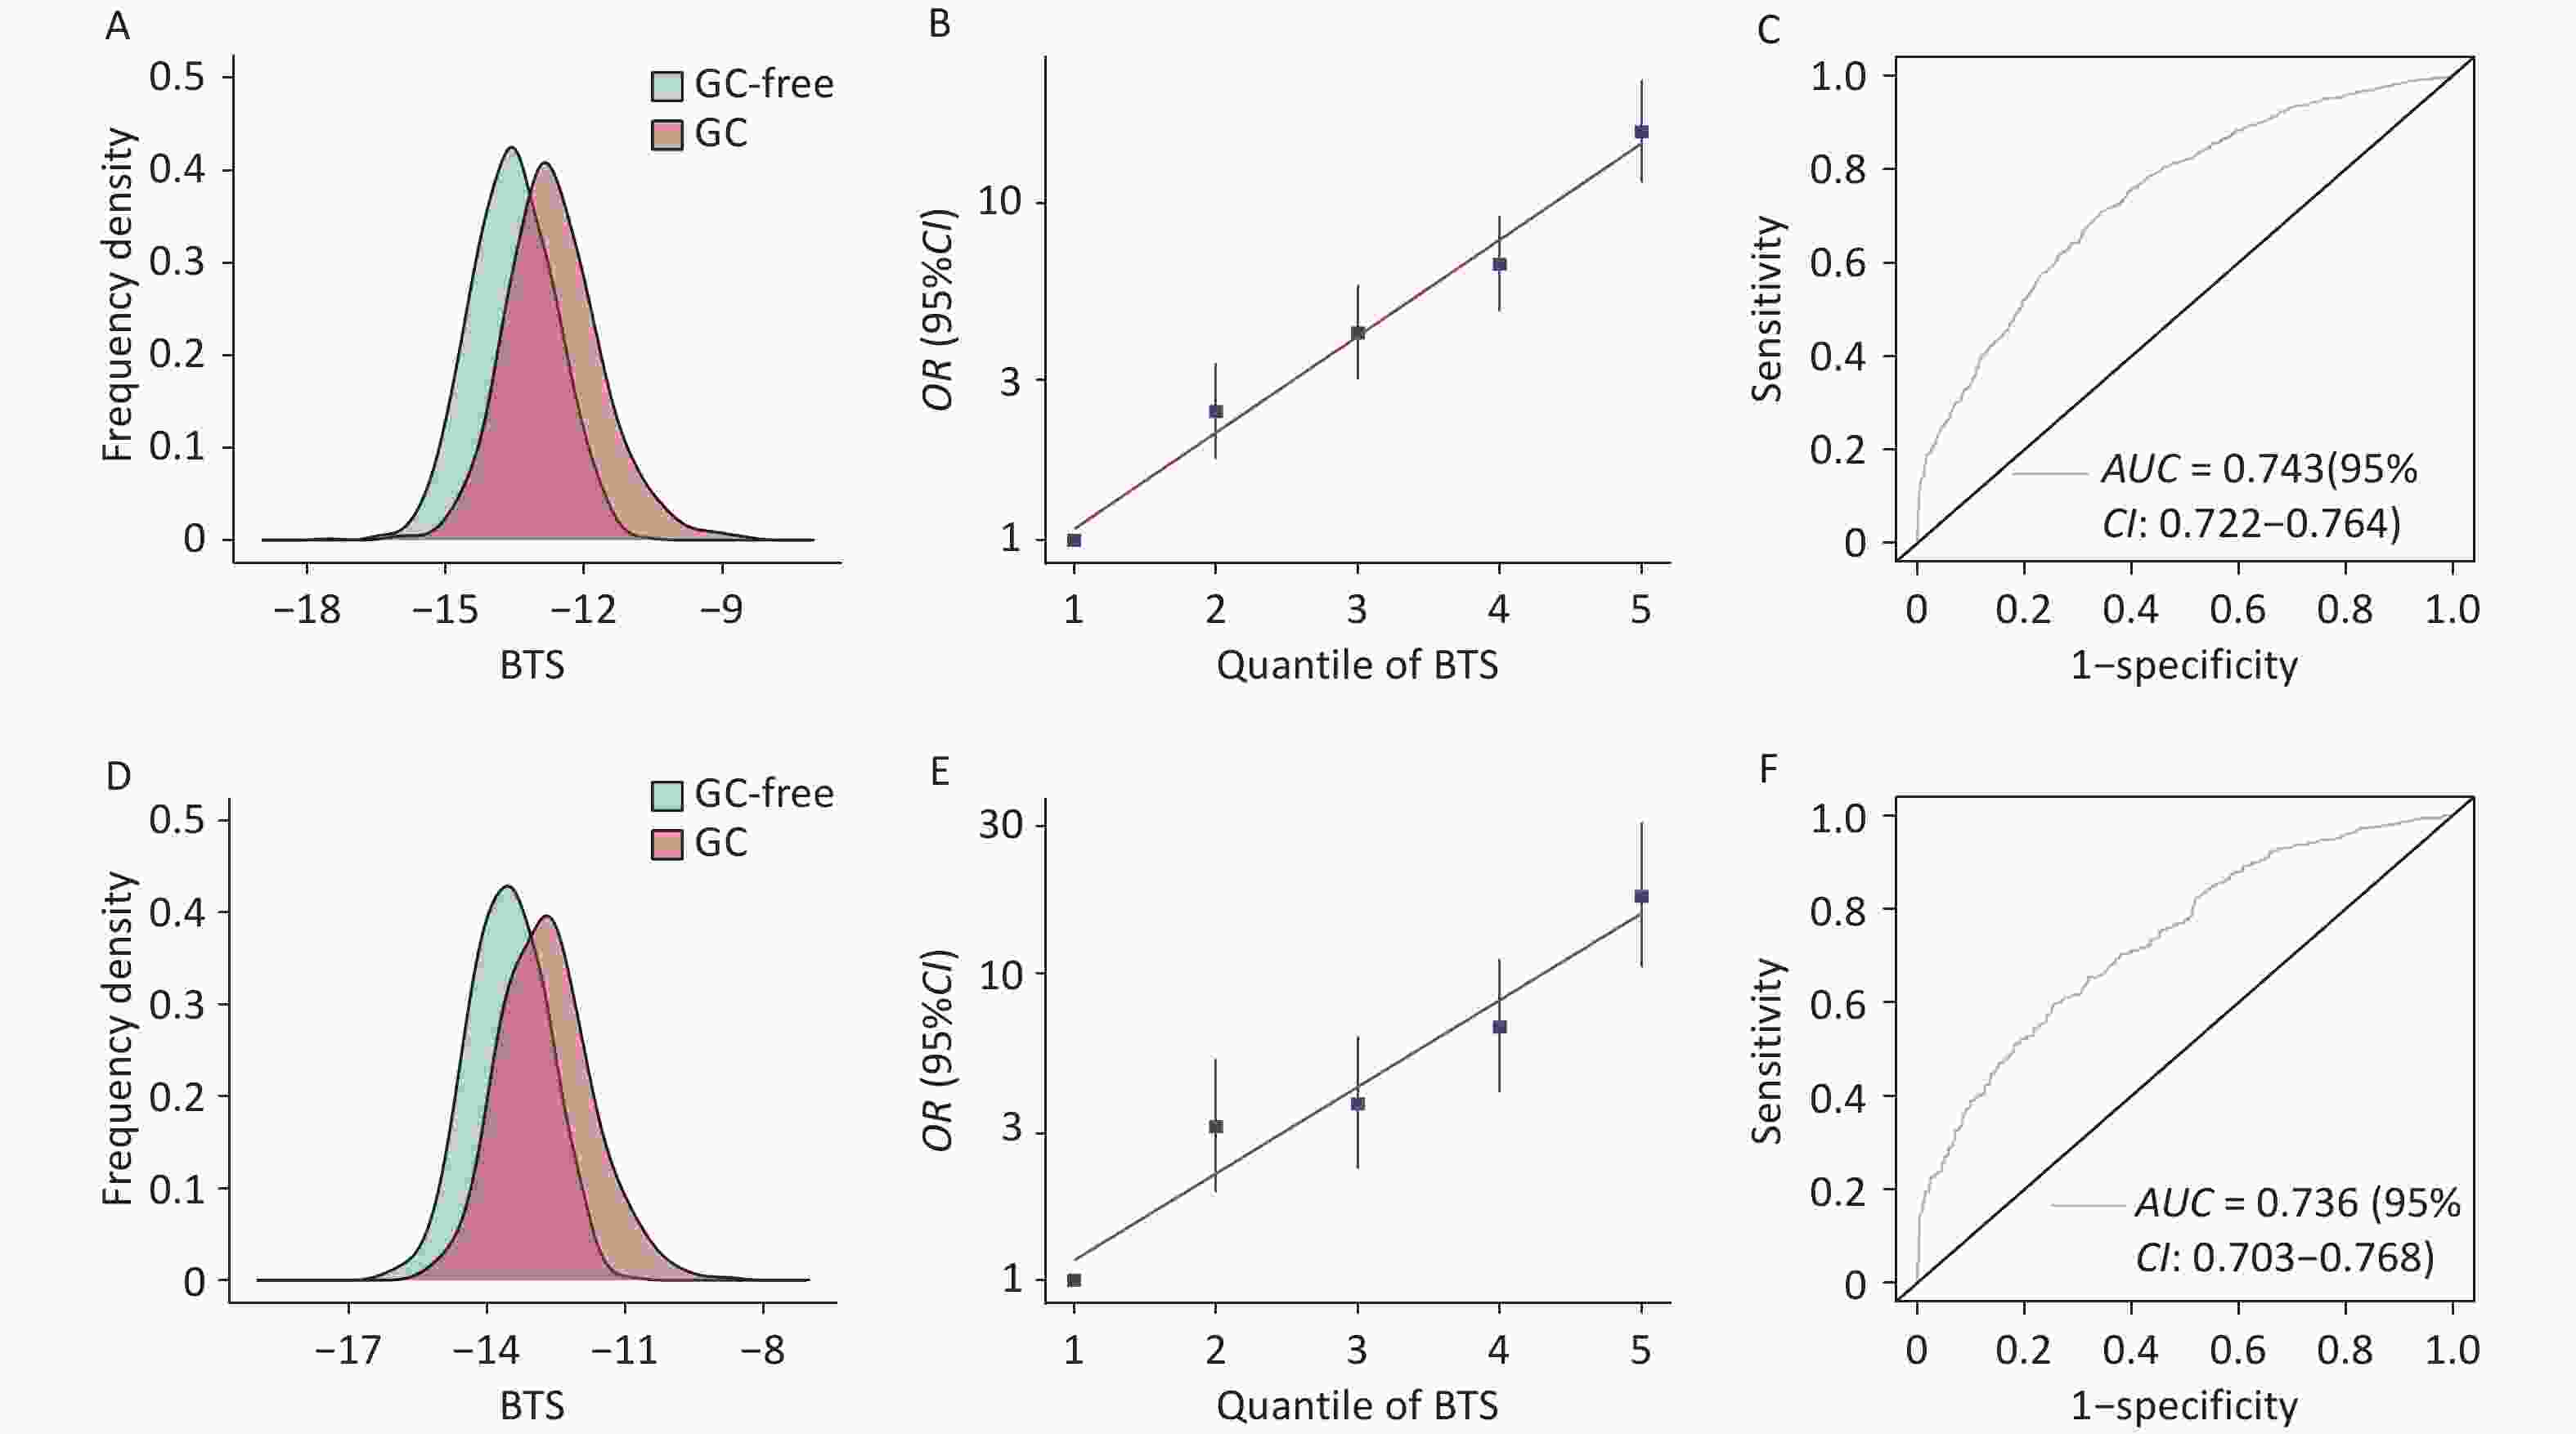
Figure 1. (A) Distribution of the BTS in the case and control groups in the training set. (B) Grouping trend of the BTS in the case and control groups in the training set. (C) ROC curve of the BTS in the training set; the AUC was calculated using BTS as a continuous variable (AUC = 0.743, 95% CI, 0.722–0.764). (D) Distribution of the BTS in the case and control groups in the testing set. (E) Grouping trend of the BTS in the case and control groups in the testing set. (F) ROC curve of the BTS in the testing set; the AUC was calculated using BTS as a continuous variable (AUC = 0.736, 95% CI, 0.703–0.769). BTS, blood test score; GC, gastric cancer; ROC: receiver operating characteristic; AUC, area under the curve; CI, confidence interval.
-
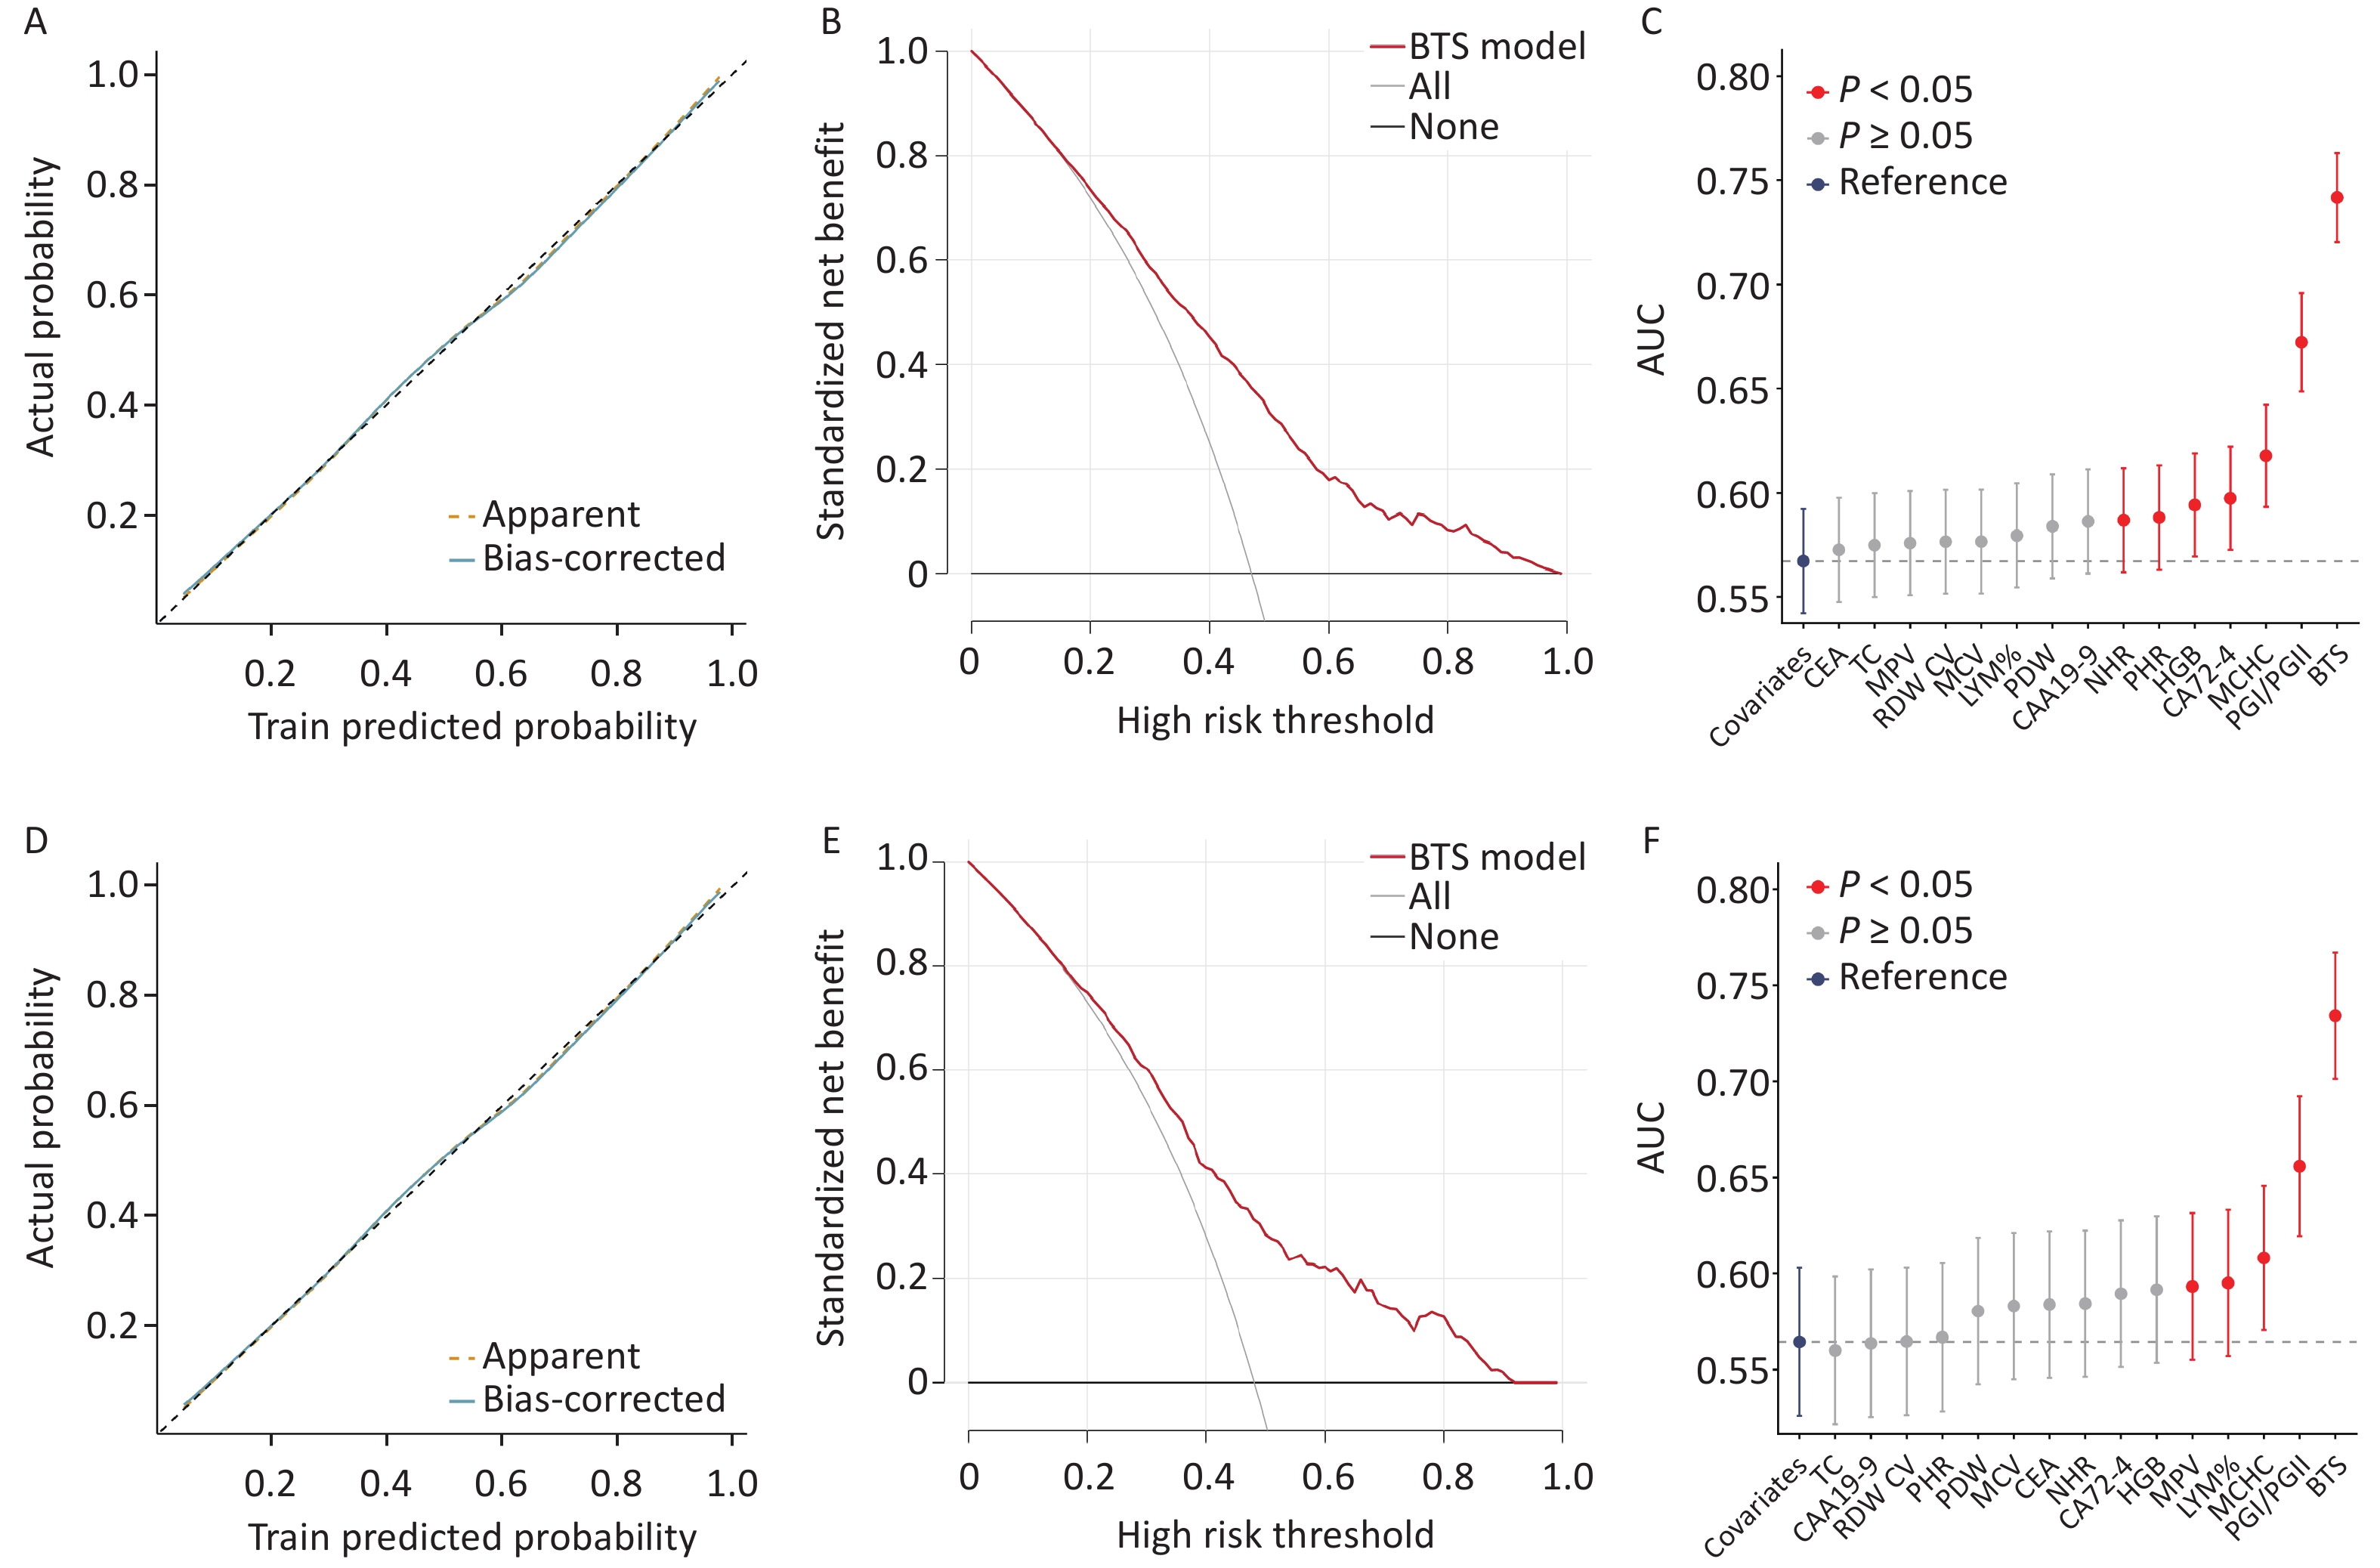
A linear association was observed between BTS and GC (training set: P < 0.001, testing set: P < 0.001); however, the nonlinear association was not significant (training set: P = 0.562, testing set: P = 0.251) (Supplementary Figure S2). After grouping BTS according to quintiles, we observed that the risk of incident GC significantly increased from quintile 1 to quintile 5 (training set: Ptrend < 0.001, testing set: Ptrend = 0.002) (Figure 1B, Figure 1E); however, this association did not change after adjusting for PRS (training set: Ptrend < 0.001, testing set: Ptrend = 0.001) (Supplementary Table S4). We further divided the participants into low (bottom 20% of the BTS), intermediate (20%–80%), and high (top 20%) BTS groups; the proportions of cases in these groups were 18%, 47%, and 78%, respectively, in the training set and 18%, 48%, and 78%, respectively, in the testing set (Supplementary Table S5). The ROC curve of the BTS demonstrated high discrimination for the risk of incident GC, and the area under the curve (AUC) values of the BTS were 0.743 (95% confidence interval [CI], 0.722–0.764) in the training set and 0.736 (95% CI, 0.703–0.769) in the testing set (Figure 1C, Figure 1F). In the sensitivity analysis, the discrimination of the BTS constructed via the simplified model of λ1se did not significantly decrease (Supplementary Figure S3). The calibration curves for the model plotted in both the training and testing sets (Figure 2A, Figure 2D) demonstrated good fit and calibration of the model. Similarly, the BTS model demonstrated strong clinical utility as evidenced by the decision curve analysis conducted on both the training and testing sets, indicating that the BTS model occupied a favorable position on the decision curve. The average standardized net benefit was 0.206 and 0.208 in the training and testing sets, respectively (Figure 2B, Figure 2E). To assess the contribution of each biomarker in the BTS to the effectiveness of score prediction, we calculated the AUC when incorporating individual biomarkers using a model containing only covariates as a reference (Figure 2C, Figure 2F).
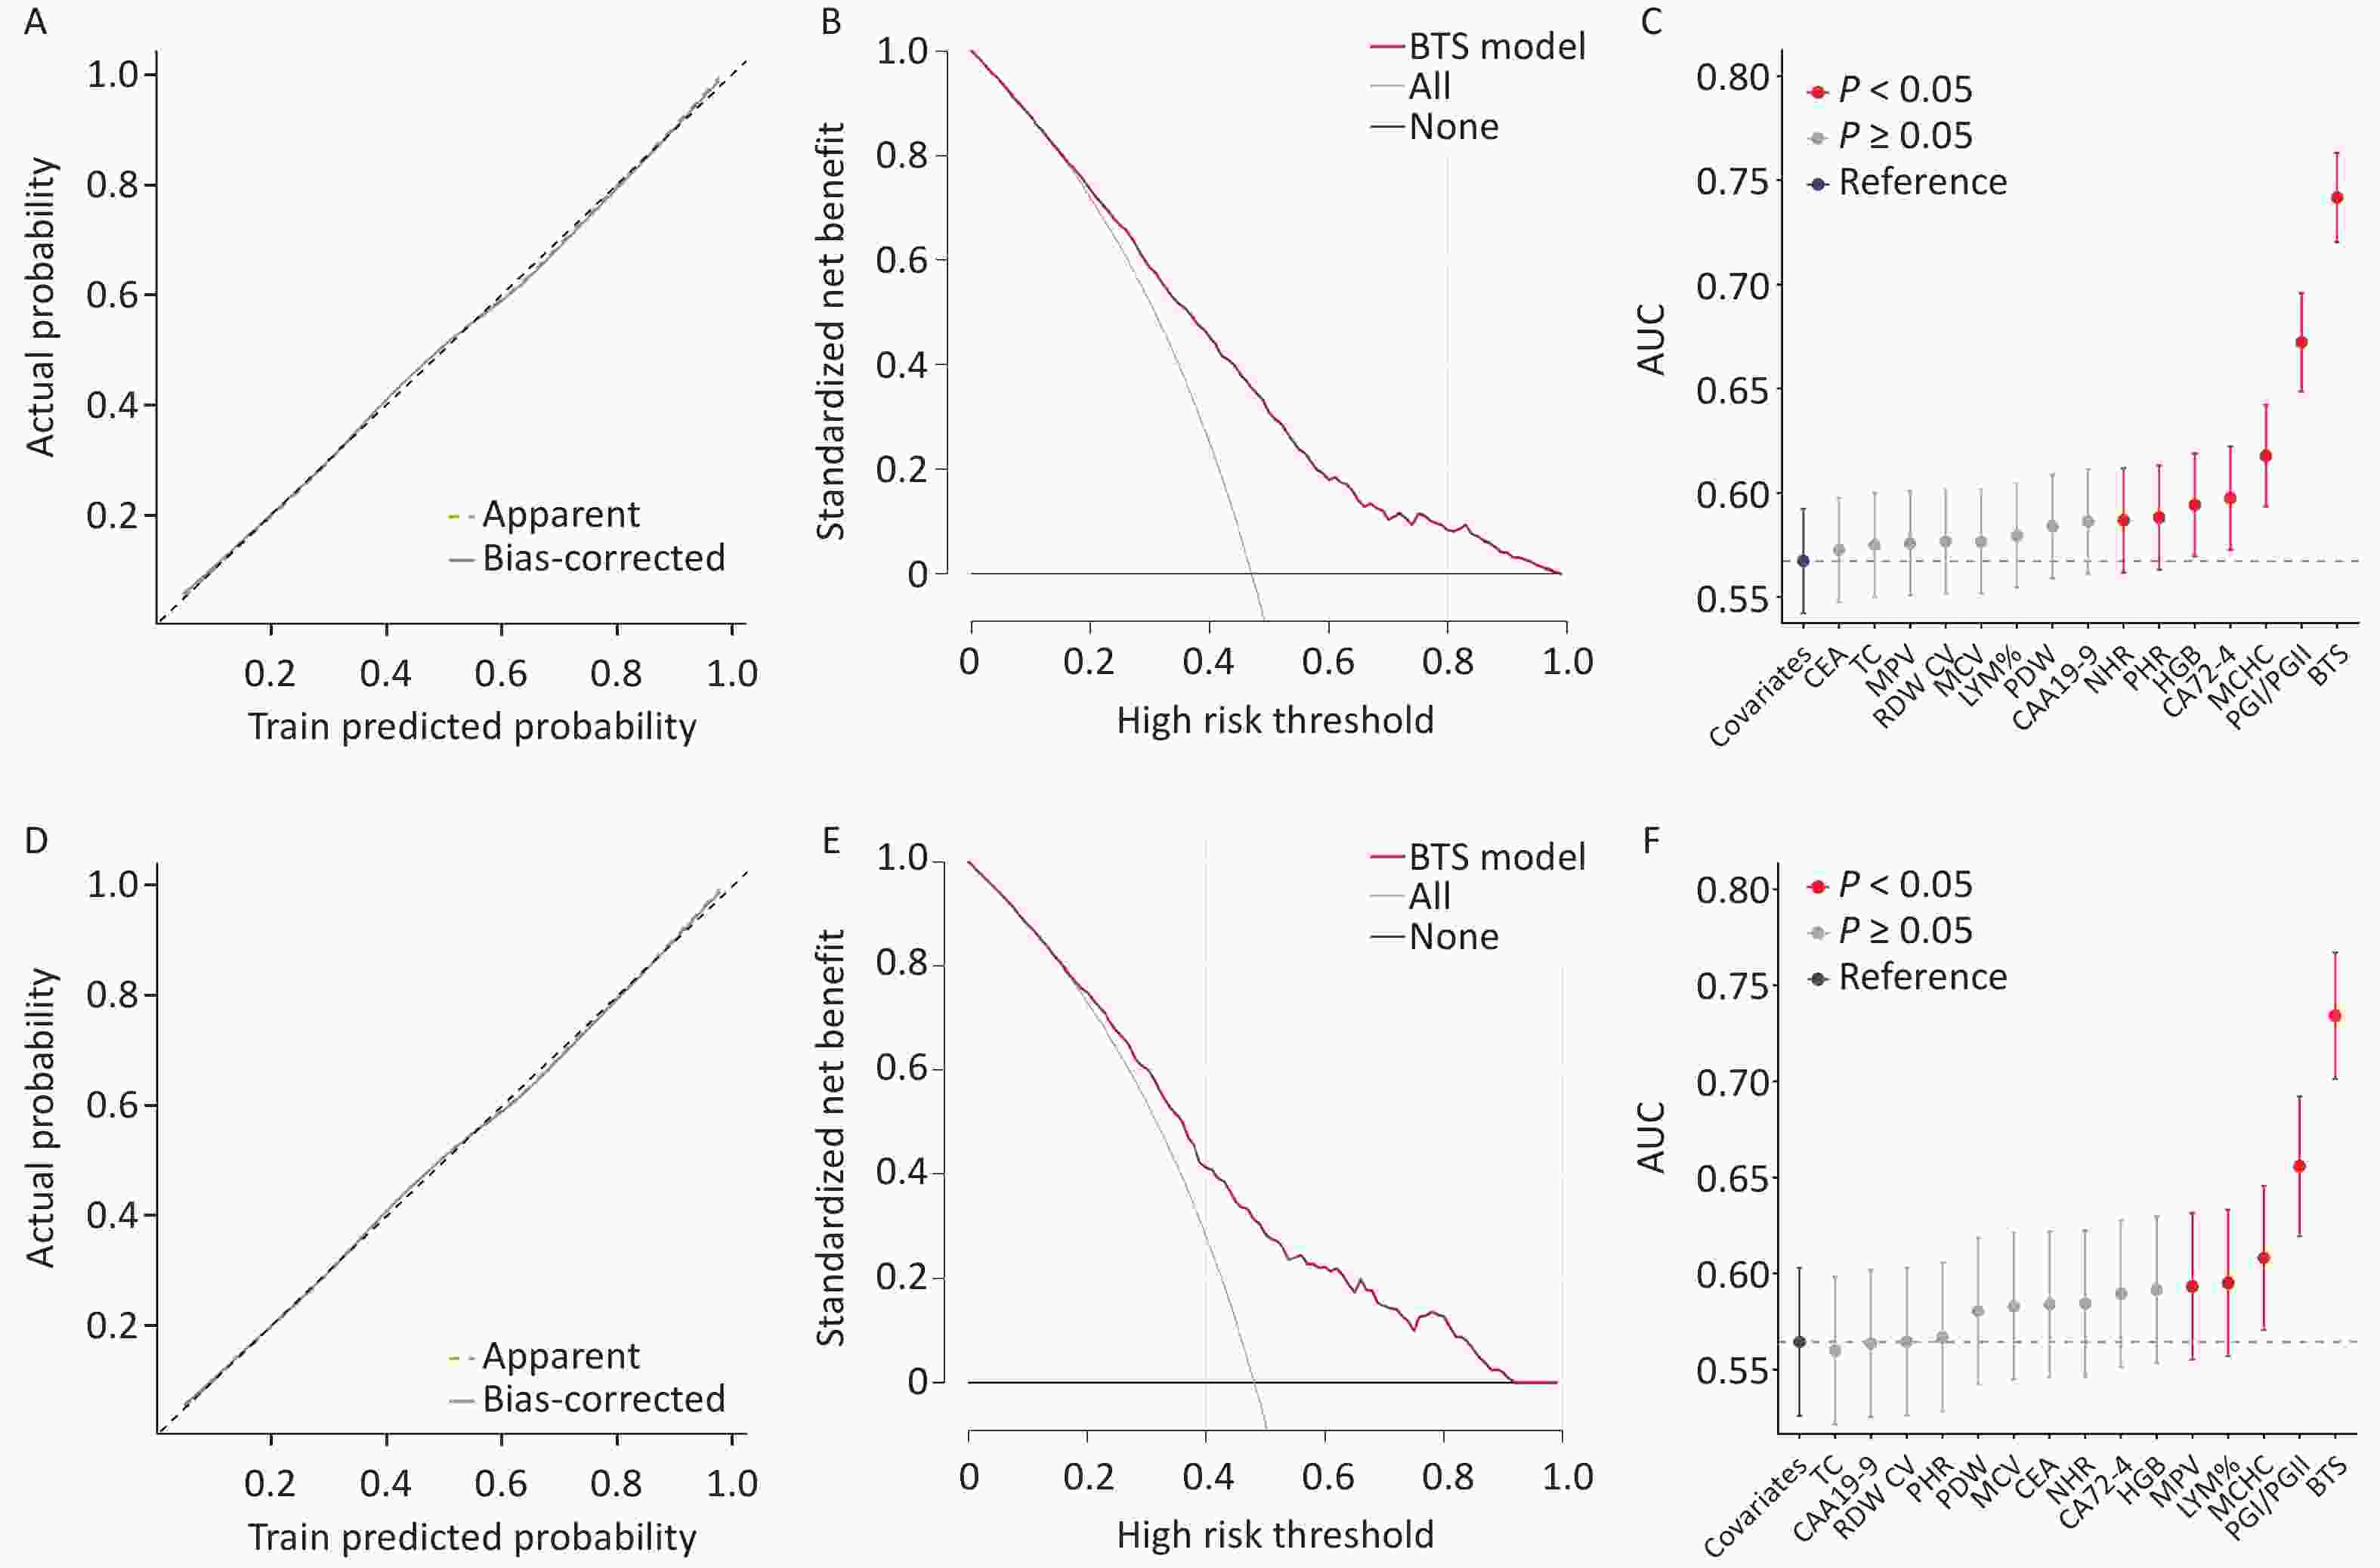
Figure 2. (A) Calibration curve of the BTS model for the training set. (B) Decision curve of the BTS model in the training set. (C) Improvement of AUC in the training set when incorporating individual biomarkers comprising BTS with covariates as a reference. (D) Calibration curve of the BTS model for the testing set. (E) Decision curve of the BTS model in the testing set. (F) Improvement of AUC in the testing set when incorporating individual biomarkers comprising BTS with covariates as a reference. BTS, blood test score; AUC, area under the curve.
We divided the cases into cardia and non-cardia cancers according to the pathological site and observed no significant difference (training set: Pheterogeneity = 0.395; testing set: Pheterogeneity = 0.776) in the ability of the BTS to predict the two GC types (Supplementary Table S6). After dividing the cases into four groups based on the TNM stage, we observed that the OR of BTS for GC gradually increased as the TNM stage of the study subjects increased in the training set (training set: Ptrend = 0.005, testing set: Ptrend = 0.269), thereby suggesting that the association between BTS and GC increased as the TNM stage increased (Supplementary Table S7).
-
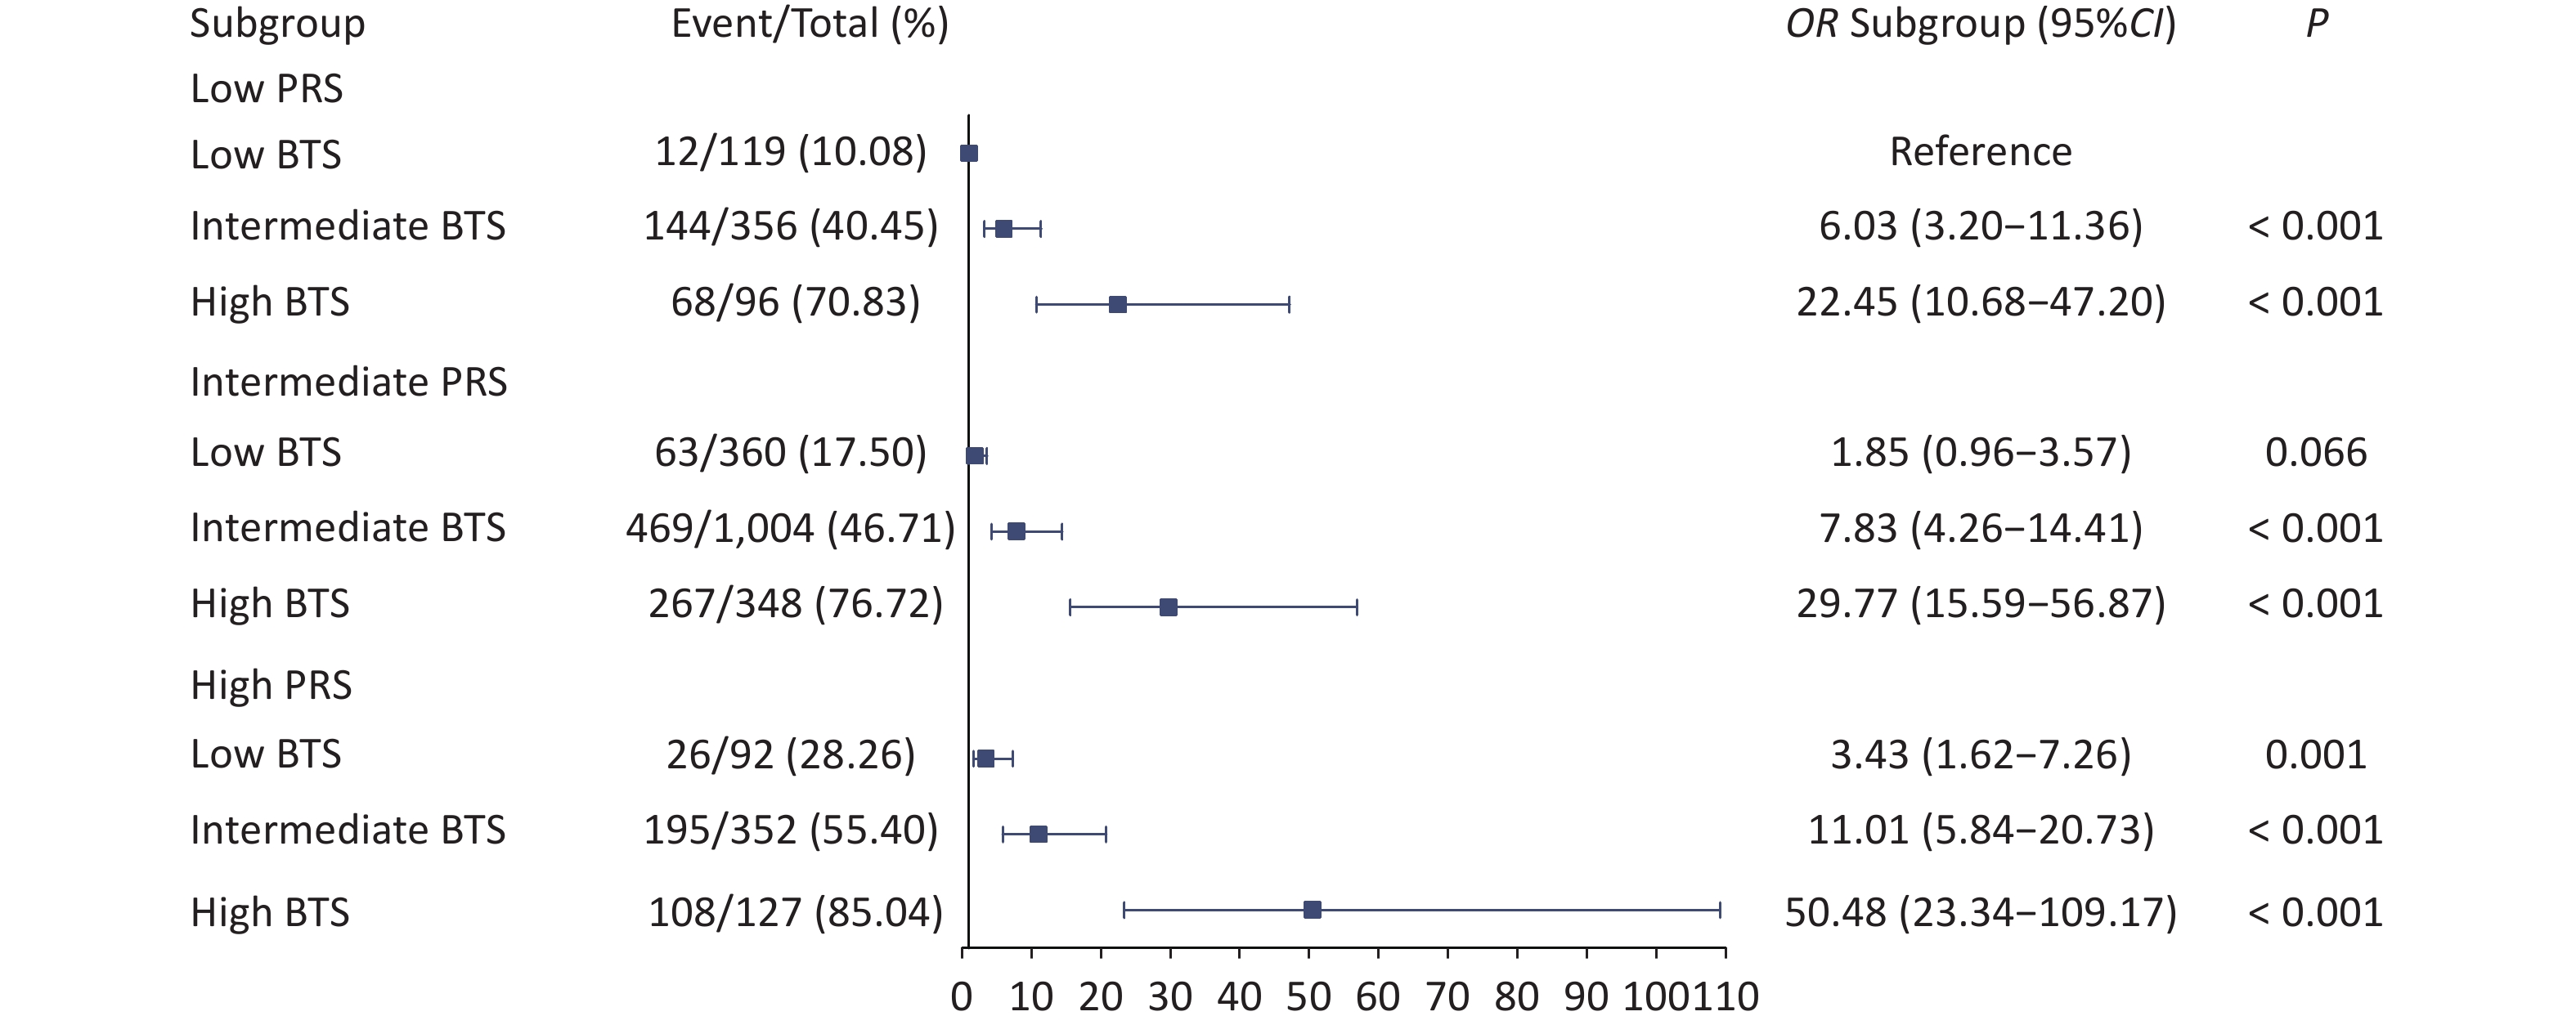
Based on a previous study, we identified 112 GC-associated SNPs used to construct the PRS. Similar to the BTS, the PRS showed good discrimination and predictive capabilities. After grouping the PRS by quintile, an increasing trend in GC risk was observed in the higher quintiles (training set: Ptrend < 0.001; testing set: Ptrend = 0.036) (Supplementary Figure S4). Similar to the BTS, the PRS of the participants was divided into low (bottom 20% of the PRS), intermediate (20%–80%), and high (top 20%) genetic risk groups. The proportions of cases in these groups were 38%, 47%, and 56% in the training set and 41%, 46%, and 61% in the testing set, respectively. Compared with low PRS, intermediate and high PRS were associated with a higher probability of GC (Supplementary Table S8). We observed a joint effect of BTS and PRS on the risk of incident GC in a dose-response manner. Specifically, with the joint increase in BTS and genetic risk, the overall risk of GC showed an upward trend (Figure 3). However, there was no significant interaction between BTS and PRS with respect to GC risk (P = 0.473).
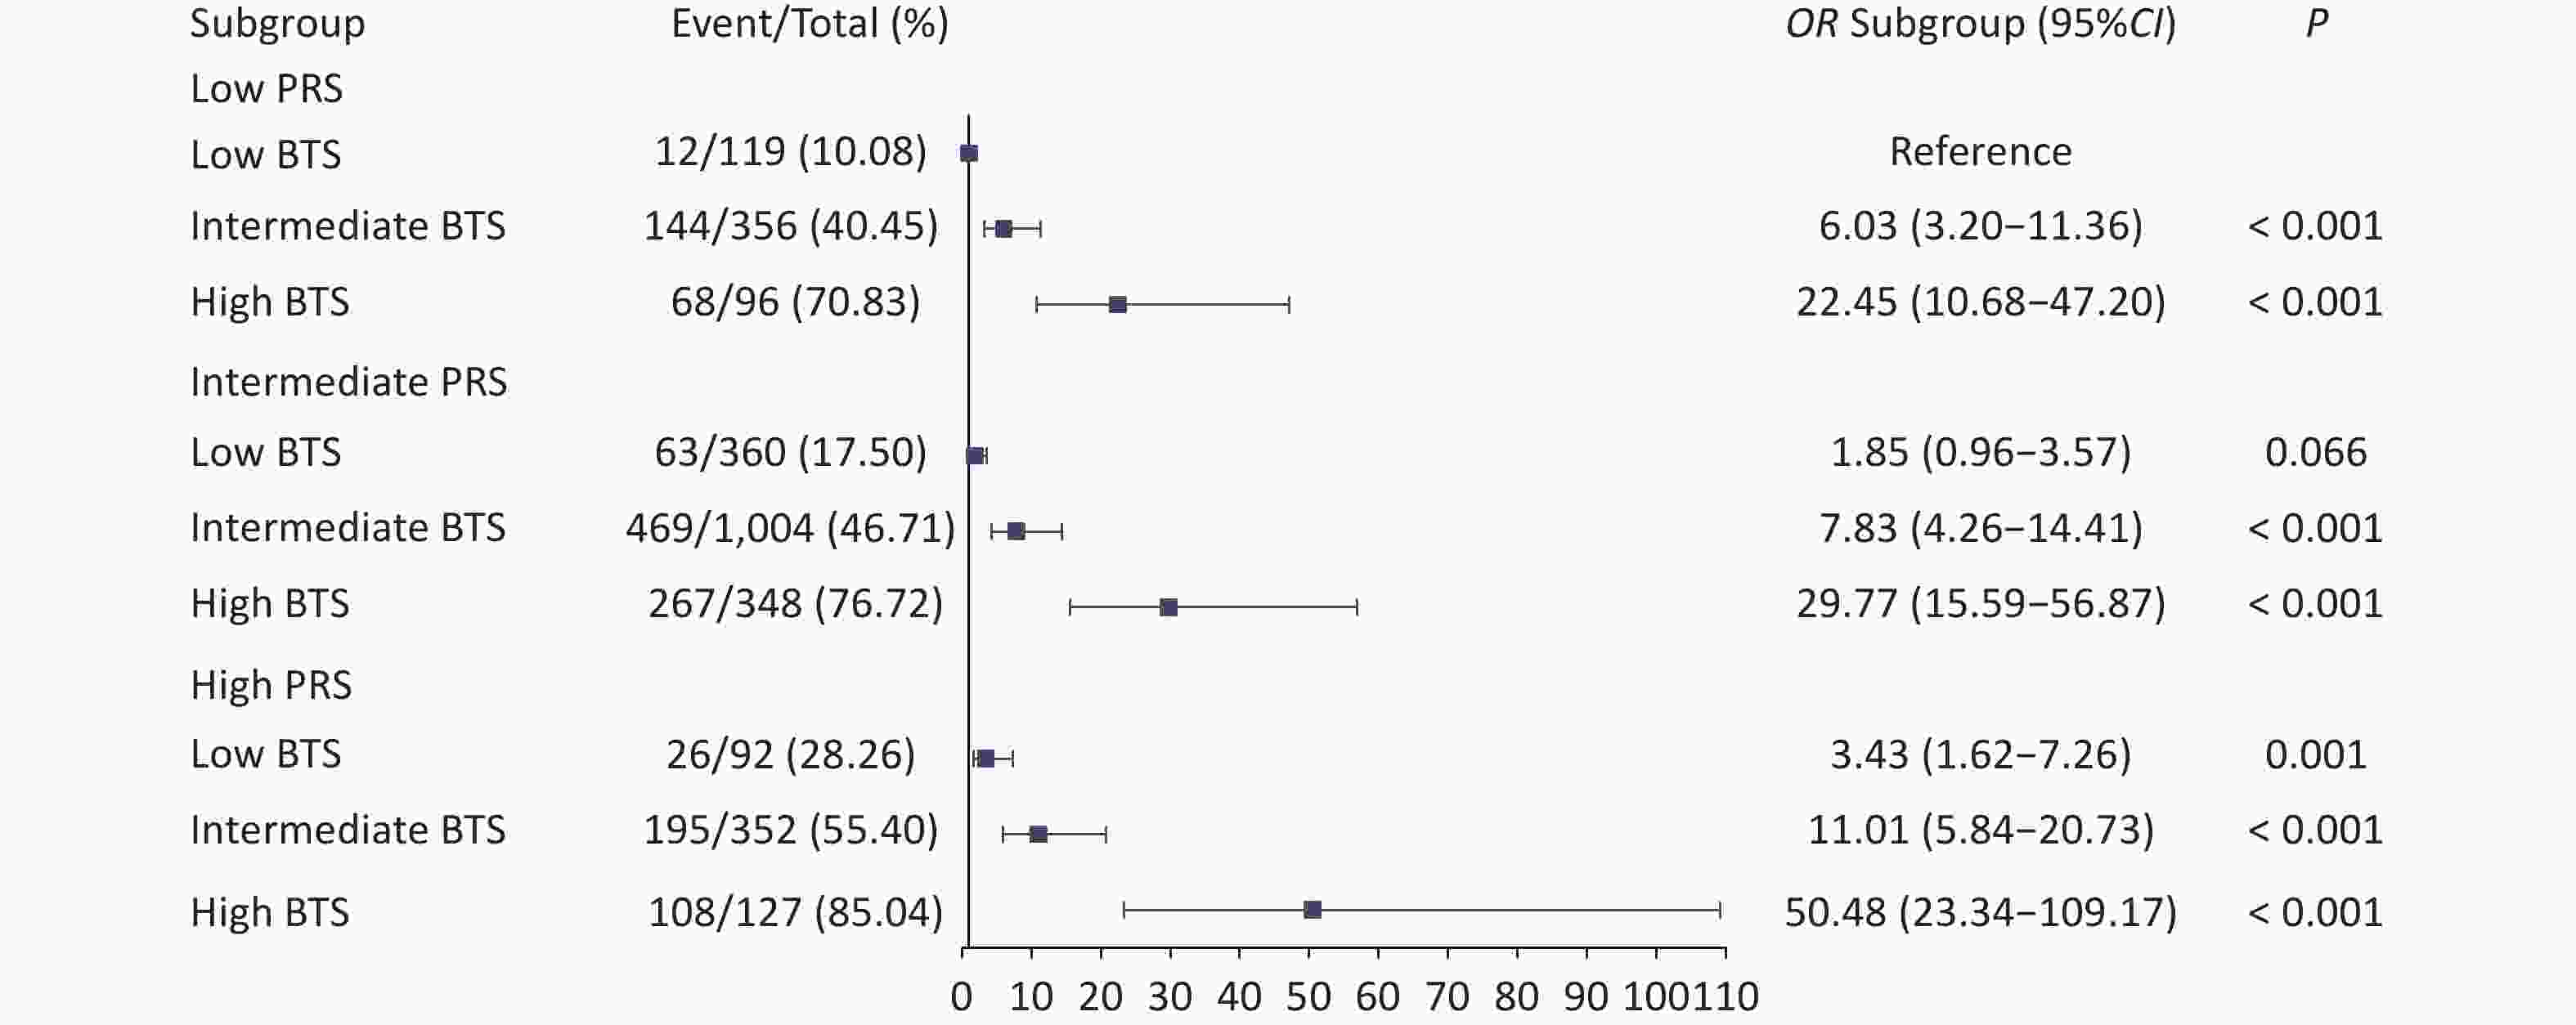
Figure 3. Joint analysis of the BTS and PRS in the combined training and testing sets. BTS, blood test score; PRS, polygenic risk score; CI, confidence interval.
-
Many blood indicators have been evaluated for the prediction of GC in recent years; however, these indicators are not sufficiently comprehensive[14,26]. In the present study, based on blood samples, we identified 14 blood indices associated with GC and constructed a BTS. BTS demonstrated good prediction and population stratification capabilities in both the training and internal validation sets. After grouping the patients according to quintiles, the proportion of patients diagnosed with GC was 78% in the high BTS groups of the training and testing sets. Moreover, after combining BTS with PRS, the proportion of patients in the high BTS group in the high genetic risk population was 85% in the training and testing sets. These findings suggest that the BTS can more accurately identify individuals who are at high risk of GC when an individual’s genetic background is considered in the analysis. To the best of our knowledge, few studies have combined multiple blood indices with the PRS to predict GC.
To date, multiple blood-based risk-prediction models for GC have been developed. For example, Miki[27] combined H. pylori infection status with the measurement of serum PG levels to construct an ABC method and demonstrated that this method could be used to identify individuals who are at high risk for GC development in Japanese populations. However, the predictive effect of this method is limited because the prediction model consists of only two predictor variables and this method does not perform well in the Chinese population. Moreover, two Chinese studies[28,29] constructed prediction models for GC using seven factors (age, sex, PGI/PGII, serum gastrin-17 concentration, H. pylori infection, and consumption of salted and fried foods), with the models demonstrating good predictive efficacy (C-statistic of 0.803 and AUC of 0.76, respectively). These two studies included only several known GC-related markers and did not explore other markers in the blood. In this study, the BTS was constructed by using a variety of objective blood indicators, and these indicators are often available when patients undergo health examinations; moreover, these indicators can be of practical value in helping to assess the risk of incident GC. The BTS demonstrated high discrimination for GC in the training set (AUC = 0.743) and the testing set (AUC = 0.736). Additionally, calibration and decision curve analyses demonstrated that the BTS exhibited good calibration capabilities and clinical utility, suggesting that the BTS has substantial value for screening high-risk populations for GC.
Our study not only considered several traditional GC indicators, but also systematically explored indicators of blood cells, inflammatory levels, coagulation levels, and lipid levels. Among the 14 indices, PGI/PGII, CA19-9, CA72-4, and CEA have been widely used for GC prediction[30-32]. Lymphocyte percentage is an indicator of inflammation in the body, and inflammatory responses play decisive roles in different stages of tumor development, including initiation, promotion, malignant conversion, invasion, and metastasis[33]. Prolonged exposure to an inflammatory response may lead to a decrease in the number of blood cells, thereby promoting the loss of hematopoietic function and accelerating disease progression[34]. In our study, HGB, MCHC, RDW-CV, and MPV were observed to be associated with incident GC, which is consistent with the findings of previous studies[35-37]. Furthermore, cholesterol plays an important role in cellular structure and function; moreover, it functions as a precursor to several biochemical pathways, including the synthesis of vitamin D and steroid hormones[38]. Several studies have demonstrated that low TC levels are associated with an increased risk of incident GC[39,40].
Approximately 10% of patients with GC demonstrate a familial aggregation of the disease and 1%–3% of patients harbor germline mutations[41]. As a quantitative indicator of genetic risk, the PRS can provide an estimate of an individual's risk of GC attributable to genetic factors[17]. In this study, we observed that the combination of the PRS with clinical indicators provided a good predictive effect and that the PRS alone was less effective in identifying high-risk populations, which is consistent with a previous epidemiological study[42]. Elevated BTS values indicate an increased risk of GC development at each genetic risk level. In the joint analysis of the BTS and PRS, the interaction between BTS and PRS was not significant. However, it is possible that this negative result stems from the small sample size of this subgroup[43]. Therefore, additional studies with larger sample sizes are warranted to explore the interactions between genetic risk and clinical indicators. Furthermore, while combining the PRS reflecting genetic risk with clinical biomarkers can enhance predictive accuracy and population stratification, the high cost of genotyping tests associated with PRS implementation for identifying high-risk populations must also be considered.
The present study has several limitations. First, to construct a completely objective scoring model, we did not incorporate subjective factors, such as physical activity or dietary habits, which may limit the predictive effect of the model for GC. Second, although the BTS showed promising performance in the training and testing sets, the lack of external validation and the relatively short follow-up duration of less than two years may limit the assessment of its robustness and generalizability. Further studies in independent populations, in different clinical settings, and with longer follow-up periods are required. In addition, as the present cohort included individuals older than 45 years, caution is needed when applying these findings to the general population.
In conclusion, we developed a BTS for the prediction of GC using 14 blood indices associated with GC and conducted validation and evaluation experiments. Our study demonstrated that the BTS has good predictive and risk stratification capabilities and can be used to identify high-risk populations and guide screening. Additionally, the results of the joint analysis revealed that blood indices and genetic factors were independently associated with the risk of incident GC. However, the interactions between blood indices and genetic risk need to be explored further.
HTML
Study Population
Demographic Characteristics and Blood Indices
Genotyping
Statistical Analysis
Baseline Characteristics
Construction of the BTS
BTS Categories and Assessment in GC Discrimination
Joint Effect of BTS and Genetic Risk
Competing Interests The authors declare that there are no conflicts of interest.
Ethics The TBTB was approved by the Institutional Review Board of Wuxi Center for Disease Control and Prevention (No. 2020(01)).
Author’s Contributions Supervision: Guangfu Jin, Yun Qian and Lu Wang.
Writing – review & editing: Lu Wang.
Formal analysis: Ruobing Wang, Meng Zhu.
Conceptualization: Yun Qian and Lu Wang.
Data curation: Nanxi Wang, Caiwang Yan.
Writing – original draft: Tianhong Han.
The work reported in the paper has been performed by the authors, unless clearly specified in the text.
Methodology: Tianhong Han, Qiufen Sun and Jia Liu.
Data Sharing This research was conducted using the licensed TBTB Resource. The data used in this study complied with the requirements of the TBTB cohort.

 Quick Links

 DownLoad: