



-
Cardiovascular disease (CVD) remains the leading cause of mortality worldwide. In 2019, CVD caused approximately 19 million deaths, accounting for nearly one-third of all premature deaths from noncommunicable diseases[1]. Stroke and ischemic heart disease (IHD) are the two major subtypes of CVD and contribute significantly to the disease burden in China, accounting for 20.55% and 17.59% of total deaths, respectively[2]. Numerous studies have demonstrated that exposure to air pollution adversely affects human health[3-5]. Both gaseous pollutants (e.g., carbon monoxide [CO], nitrogen dioxide [NO2], sulfur dioxide [SO2], and ozone [O3]) and particulate matter with an aerodynamic diameter of ≤ 2.5 μm (PM2.5) or ≤ 10 μm (PM10) are associated with an increased risk of CVD mortality[3-5]. Beyond air pollution, the influence of meteorological factors on human health cannot be overlooked. For instance, non-optimal temperatures (i.e., high and low temperatures) have been linked to an increased mortality risk and represent one of the leading contributors to the global disease burden[6,7]. Furthermore, studies have demonstrated that other meteorological factors, including diurnal temperature range (DTR) and relative humidity (RH), are also associated with an increased risk of CVD mortality[8,9].
Although air pollution and meteorological changes are independent risk factors for CVD, the specific air pollutants and meteorological factors that exert the greatest impact remain unclear, including the magnitude of the disease burden they cause. Elucidating their relative contributions is crucial for guiding public health protection and optimizing resource allocation. Therefore, this study aims to employ a uniform methodological framework to assess and compare the impact of air pollution (i.e., PM10, PM2.5, NO2, SO2, CO, and O3) and meteorological factors (i.e., temperature, DTR, and RH) on CVD mortality in terms of mortality risk and mortality burden.
This study was conducted in Anhui Province, located in eastern China and situated within the climate transition zone between temperate and subtropical climates (Supplementary Figure S1). We also collected daily CVD death data for all regions of Anhui Province (16 cities) from the Anhui Provincial Center for Disease Control and Prevention between January 1, 2016, and December 31, 2019. The data included information on sex, age, and cause of death. All CVD deaths were identified and classified strictly according to the underlying cause of death coded based on the International Statistical Classification of Diseases and Related Health Problems, 10th Revision (ICD-10), including total CVD (I00–I99), stroke (I60–I69), and ischemic heart disease (I20–I25).
Hourly meteorological data were collected from the ERA5-Land dataset, which has a spatial resolution of 9 km × 9 km (
https://cds.climate.copernicus.eu/ ). Additionally, daily air pollution data were collected from the China National Urban Air Quality Real-time Publishing Platform (https://air.cnemc.cn:18007/ ). The daily average concentrations of air pollutants for each city were calculated by averaging the monitoring data for each variable. In this study, we selected nine exposure factors based on previous epidemiological studies investigating air pollution, meteorological factors, and CVD[4,5,8,9].A space-time-stratified case-crossover design was employed to examine the association between multiple environmental exposures and CVD mortality. In brief, for each case, the exposure on the day of death was compared with the exposures on the same day of the week in the same month and area, thus controlling for seasonality, long-term trends, and individual characteristics (e.g., age, sex, occupation, education level, and socioeconomic status)[10].
During data analysis, Spearman's correlation analysis was first performed to assess collinearity among the exposure factors before modeling their relationships with CVD mortality (Supplementary Figure S2). Additionally, variance inflation factor (VIF) analysis was conducted to evaluate the selection of exposure variables included in the final regression model (Supplementary Table S1). Subsequently, a conditional logistic regression model combined with distributed lag nonlinear modeling (DLNM) was used to model the relationship between each exposure and CVD mortality. A natural cubic spline function with three degrees of freedom (df) was employed in the DLNM to capture nonlinear exposure–response relationships, with a maximum lag of seven days to reflect the short-term effects of the exposures; alternative lag periods were tested in the sensitivity analysis. Furthermore, to facilitate comparisons of results across exposures, all exposures were standardized to percentiles ranging from 0% to 100%. We reported odds ratios (ORs) and 95% confidence intervals (CIs) corresponding to the 95th percentile of each exposure distribution based on the fitted exposure–response relationships. For temperature, because both high and low temperatures increase the risk of CVD mortality, we also reported ORs and 95% CIs for the 95th percentile (high temperature) and the 5th percentile (low temperature). The formula used in the analysis is as follows:
$$ \begin{aligned} & logit(P(case=iin{stratum}_{ij}|exposure,covariates))= \\& {\beta }_{0},{stratum}_{ij}+{\beta }_{1}\times cb(exposure)+{\beta }^{w}\times covariates \end{aligned} $$ (1) where stratumij denotes the fixed time stratum i in city j (i.e., matched case and control periods in the same month and year in the same city); $ {\beta }_{0} $, stratumij denotes the intercept for stratum i in city j; cb() denotes the cross-basis function in the DLNM used to model the exposure–response and lag–response relationships between environmental exposures and mortality. β denotes the regression coefficient associated with each explanatory variable. $ {\beta }^{w} $ denotes the regression coefficients for covariates, such as air pollutants and meteorological factors.
For each exposure, we first identified the exposure level associated with the minimum mortality risk from the exposure–response curve, which served as a reference value for calculating the attributable fraction (AF) representing the proportion of deaths attributable to deviations of the observed exposure distribution from this minimum-risk level. We then calculated the attributable number (AN) using the estimated AF values. The equations used to estimate AF and AN are as follows:
$$ {AF}_{i}=\frac{{OR}_{i}-1}{{OR}_{i}} $$ (2) $$ {AN}_{i}={AF}_{i}\times {N}_{i} $$ (3) where AFi and ANi denote the daily AF and attributable number, respectively; ORi represents the daily OR calculated for each exposure; and Ni indicates the daily number of CVD (including total CVD, stroke, and IHD) deaths.
Years of life lost (YLL) was calculated by matching each deceased individual according to age and sex with the 2015 WHO China life table (Supplementary Table S2). The total and cause-specific YLL attributable to each exposure were estimated by multiplying the corresponding YLL by the respective AF for each exposure:
$$ {YLL}_{exposure}={YLL}_{i}\times {AF}_{exposure} $$ (4) Following the methodology used in the Global Burden of Disease (GBD) study, the total disease burden attributable to air pollution was calculated as the sum of the disease burden associated with PM2.5, SO2, NO2, CO, and O3[7]. Given the high collinearity between PM10 and PM2.5, only the contribution of PM2.5 was included in the estimation of the total disease burden to avoid potential overestimation resulting from double counting. For meteorological factors, the total disease burden was defined as the overall burden attributable to high and low temperatures, DTR, and RH combined.
Several sensitivity analyses were performed to evaluate the robustness of our primary findings. We varied the df to 4 and 5 in the cross-basis term for the exposure–mortality association. Additionally, we replaced PM2.5 with PM10 and calculated the total disease burden attributable to air pollution as the sum of the disease burden associated with PM10, SO2, NO2, CO, and O3 to represent the total disease burden of air pollution. Moreover, we examined the impact of each exposure on the disease burden at a lag of 0–14 days. All statistical analyses were conducted using the ‘dlnm’ and ‘survival’ packages in R software (version 4.1.0). All tests were two-sided, and P < 0.05 was considered statistically significant.
This study included 421,448 deaths from CVD across all 16 cities in Anhui Province (Table 1). The primary causes of death were stroke (48.46%) and IHD (26.62%), with substantial variation across cities. Meteorological factors and concentrations of air pollutants varied substantially across cities.
Cities Disease
Count (%)Meteorological
factors
(Mean ± SD)Air pollutants
(Mean ± SD)Total CVD Stroke IHD DTR (°C) RH (%) PM10 (μg/m3) PM2.5 (μg/m3) NO2 (μg/m3) SO2 (μg/m3) CO (μg/m3) O3 (μg/m3) Anqing 23,272 9,103 5,082 7.16 ±
3.0476.62 ±
10.4562.17 ±
33.0141.80 ±
24.8419.32 ±
9.6112.42 ±
5.21774.19 ±
169.1591.25 ±
29.38Bengbu 31,264 15,188 9,198 8.72 ±
3.3572.12 ±
11.5189.01 ±
48.7753.77 ±
34.1822.24 ±
10.2715.21 ±
6.14825.40 ±
274.73100.22 ±
36.83Bozhou 20,860 10,318 7,641 9.25 ±
3.4669.90 ±
12.8491.14 ±
51.1556.93 ±
36.4820.83 ±
9.7214.41 ±
6.86890.39 ±
310.78100.38 ±
37.92Chizhou 9,256 4,667 2,167 7.77 ±
3.6077.10 ±
11.3253.94 ±
29.0236.06 ±
21.7316.30 ±
7.6511.38 ±
4.14745.39 ±
165.8989.01 ±
29.97Chuzhou 28,115 14,060 6,732 8.36 ±
3.3873.81 ±
11.0680.16 ±
42.5146.65 ±
29.6222.65 ±
11.6614.31 ±
5.57842.65 ±
252.7999.54 ±
36.29Fuyang 56,897 27,441 20,937 9.05 ±
3.5670.58 ±
12.4991.88 ±
49.1056.37 ±
35.2720.52 ±
8.9514.34 ±
6.53874.82 ±
301.3898.09 ±
36.86Hefei 44,135 22,911 9,717 7.87 ±
3.2774.02 ±
10.8477.06 ±
40.4649.79 ±
30.4525.05 ±
12.3113.54 ±
5.74865.69 ±
240.2792.98 ±
34.59Huaibei 12,442 3,655 2,398 9.42 ±
3.4269.33 ±
13.0990.04 ±
53.6258.38 ±
38.5722.60 ±
11.5115.79 ±
8.41892.98 ±
328.85101.93 ±
41.99Huainan 23,564 13,554 6,073 8.52 ±
3.4873.15 ±
11.0187.05 ±
47.0754.40 ±
33.8322.46 ±
10.3013.56 ±
4.59804.51 ±
253.13100.26 ±
41.19Huangshan 7,051 2,441 885 7.73 ±
3.3777.10 ±
12.4440.90 ±
21.2425.40 ±
15.4213.53 ±
5.259.70 ±
3.75669.59 ±
141.0381.17 ±
23.97Luan 35,111 18,207 7,710 8.30 ±
3.5775.04 ±
11.4566.58 ±
33.6642.56 ±
22.6619.87 ±
9.569.97 ±
4.04798.96 ±
203.0994.50 ±
32.35Maanshan 22,934 11,238 3,434 8.10 ±
3.4475.41 ±
10.5374.01 ±
40.3946.41 ±
29.7925.42 ±
12.3414.35 ±
6.21957.64 ±
255.8396.98 ±
39.32Suzhou 55,421 27,154 19,875 9.34 ±
3.3669.11 ±
12.7993.60 ±
50.0056.93 ±
36.0121.34 ±
10.7516.60 ±
9.83897.80 ±
319.64101.02 ±
38.76Tongling 7,236 3,828 1,125 7.60 ±
3.3776.76 ±
10.2675.28 ±
40.5048.88 ±
29.5125.60 ±
12.8919.65 ±
10.10898.00 ±
237.4791.24 ±
33.25Wuhu 23,093 10,482 3,834 8.06 ±
3.6175.87 ±
10.5473.01 ±
38.7147.24 ±
28.3925.11 ±
12.8416.95 ±
8.08923.33 ±
232.3886.31 ±
30.23Xuancheng 20,797 9,984 5,401 8.04 ±
3.6977.33 ±
11.1254.61 ±
28.0034.42 ±
19.5418.29 ±
8.9811.78 ±
6.81774.54 ±
177.5087.27 ±
28.56Total 421,448
(100%)204,231
(48.4%)112,209
(26.6%)- - - - - - - - Note. SD, standard deviation; CVD, cardiovascular disease; IHD, ischemic heart disease; DTR, diurnal temperature range (°C); RH, relative humidity (%); Tmean, mean temperature (°C); PM2.5, particulate matter with an aerodynamic diameter of ≤ 2.5 μm (μg/m3); PM10, particulate matter with an aerodynamic diameter of ≤ 10 μm (μg/m3); SO2, sulfur dioxide (μg/m3); NO2, nitrogen dioxide (μg/m3); CO, carbon monoxide (μg/m3); O3, ozone (μg/m3). Table 1. Summary statistics of meteorological factors and air pollutants in Anhui Province, China, from 2016 to 2019
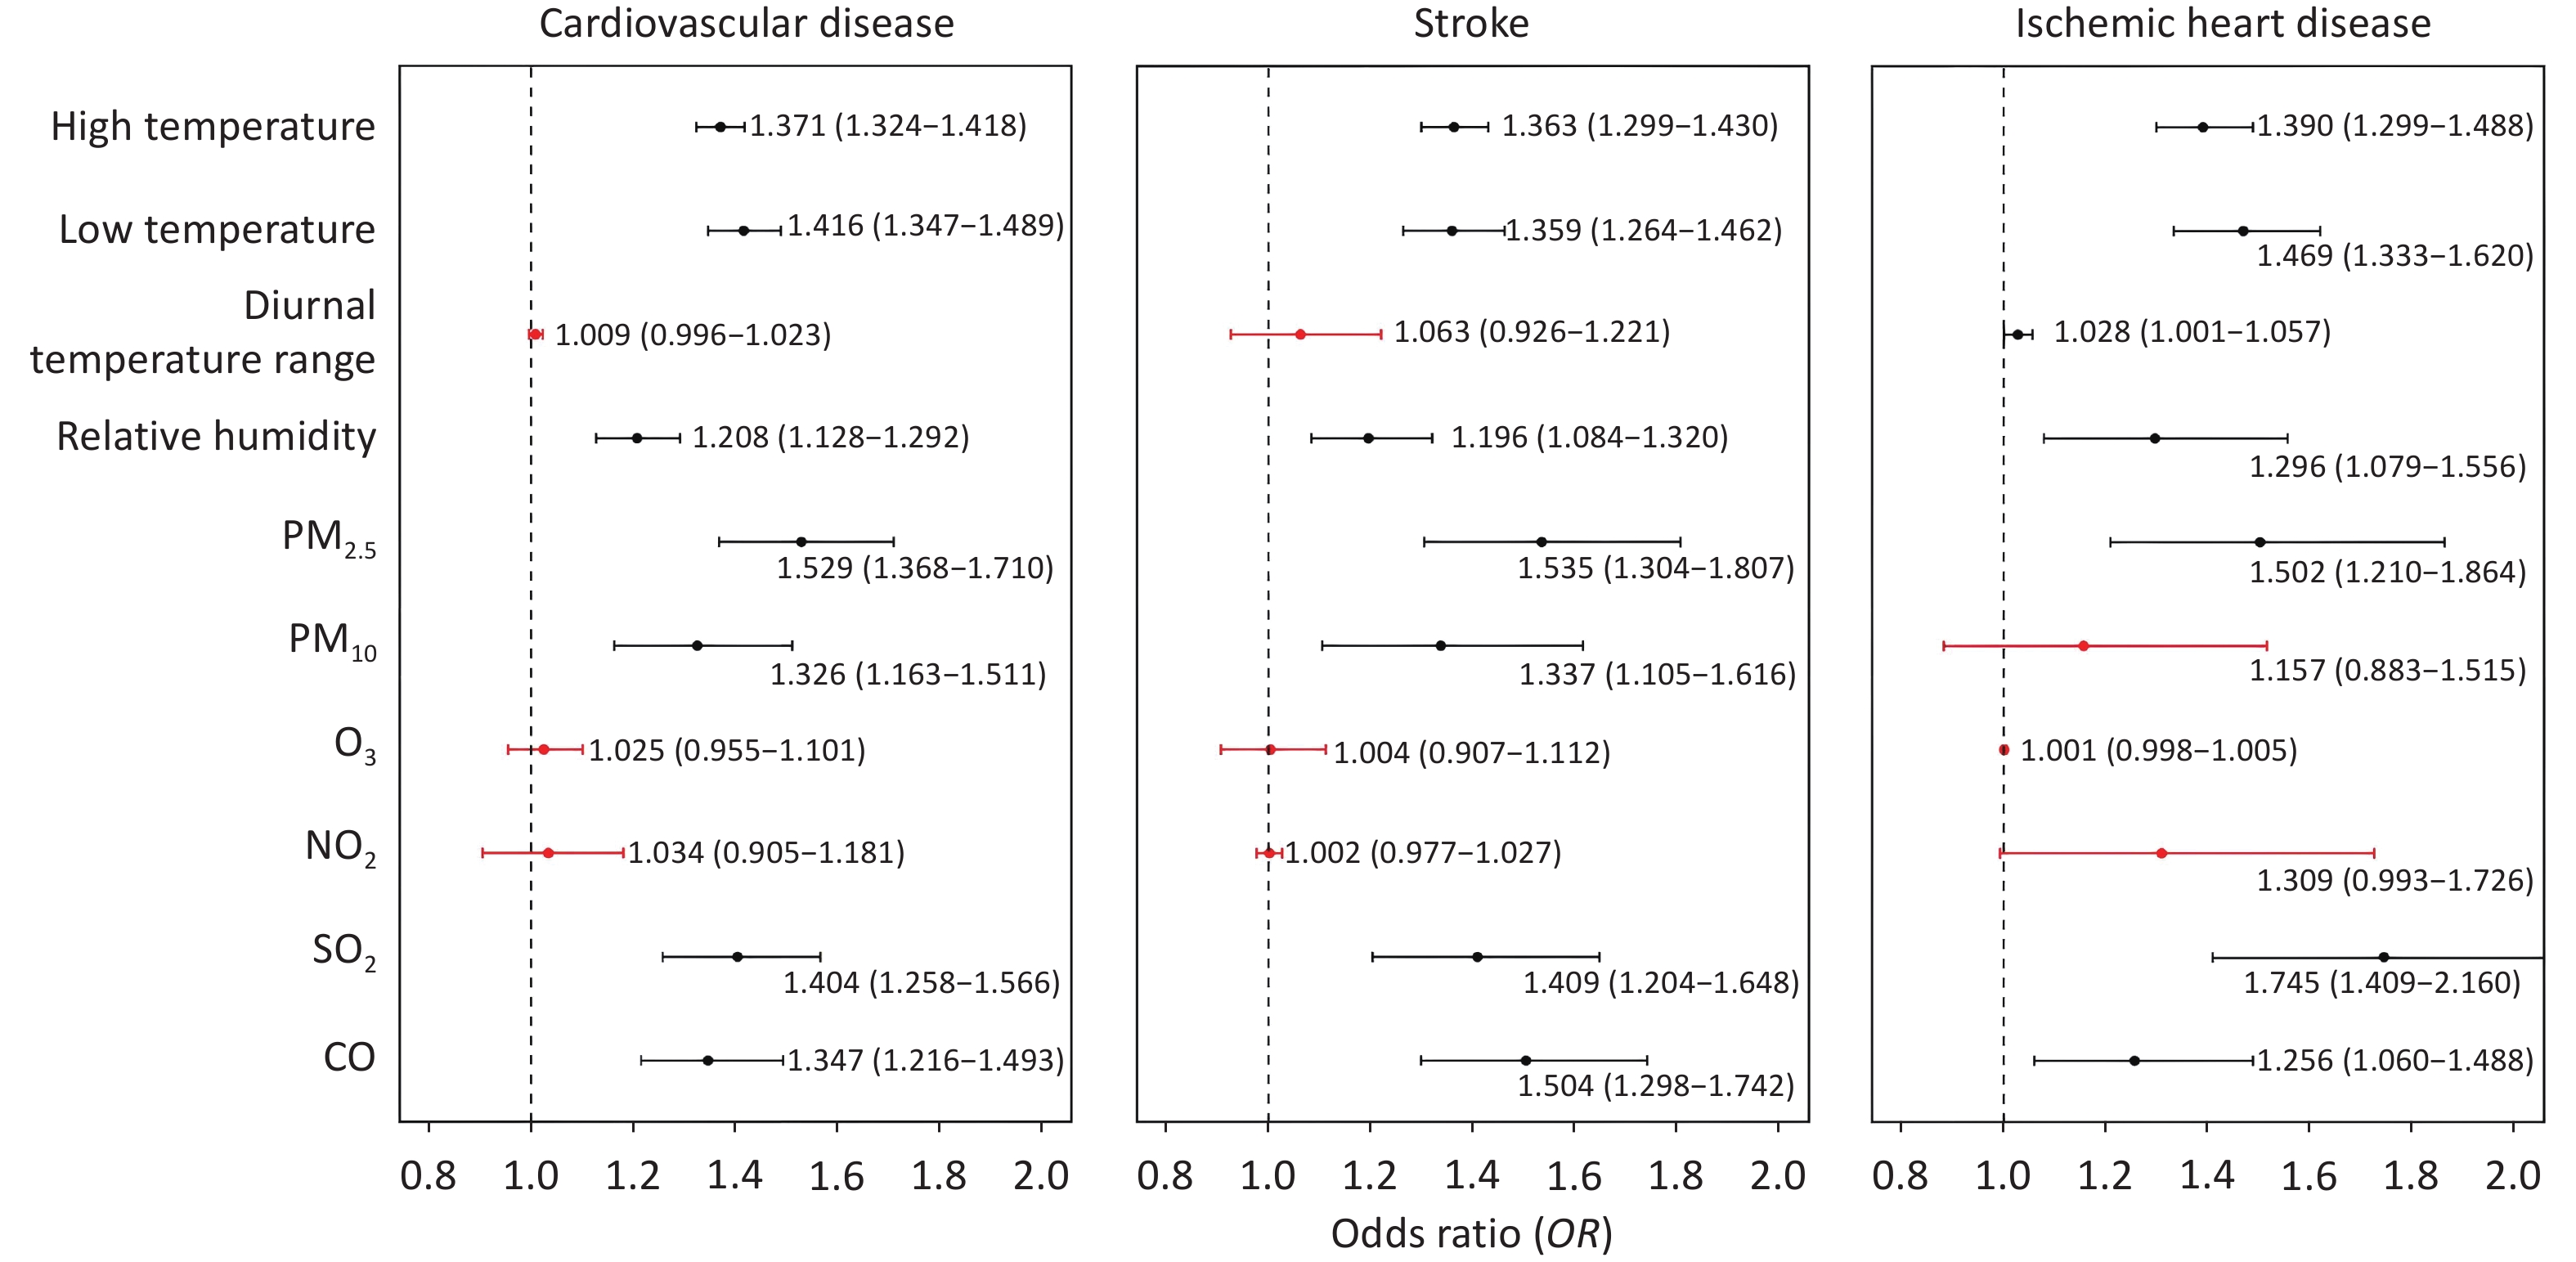
Consistent with previous findings[3-5], we observed that elevated levels of PM2.5, PM10, SO2, and CO were associated with an increased risk of CVD mortality, including cause-specific mortality (Figure 1). Similarly, meteorological factors, including high and low temperatures and elevated DTR, were also associated with an increased risk of CVD, stroke, and IHD mortality[9]. Additionally, we found that PM2.5 was the air pollutant most strongly associated with an increased risk of CVD mortality (OR: 1.529, 95% CI: 1.368–1.710). Among the four meteorological factors, low temperature was associated with the highest mortality risk (OR: 1.416, 95% CI: 1.347–1.489). Notably, although no significant association was observed between RH, O3, or NO2 and the risk of total CVD mortality at the provincial level, we identified significant adverse associations between these exposures and CVD in specific cities (Supplementary Figure S3).
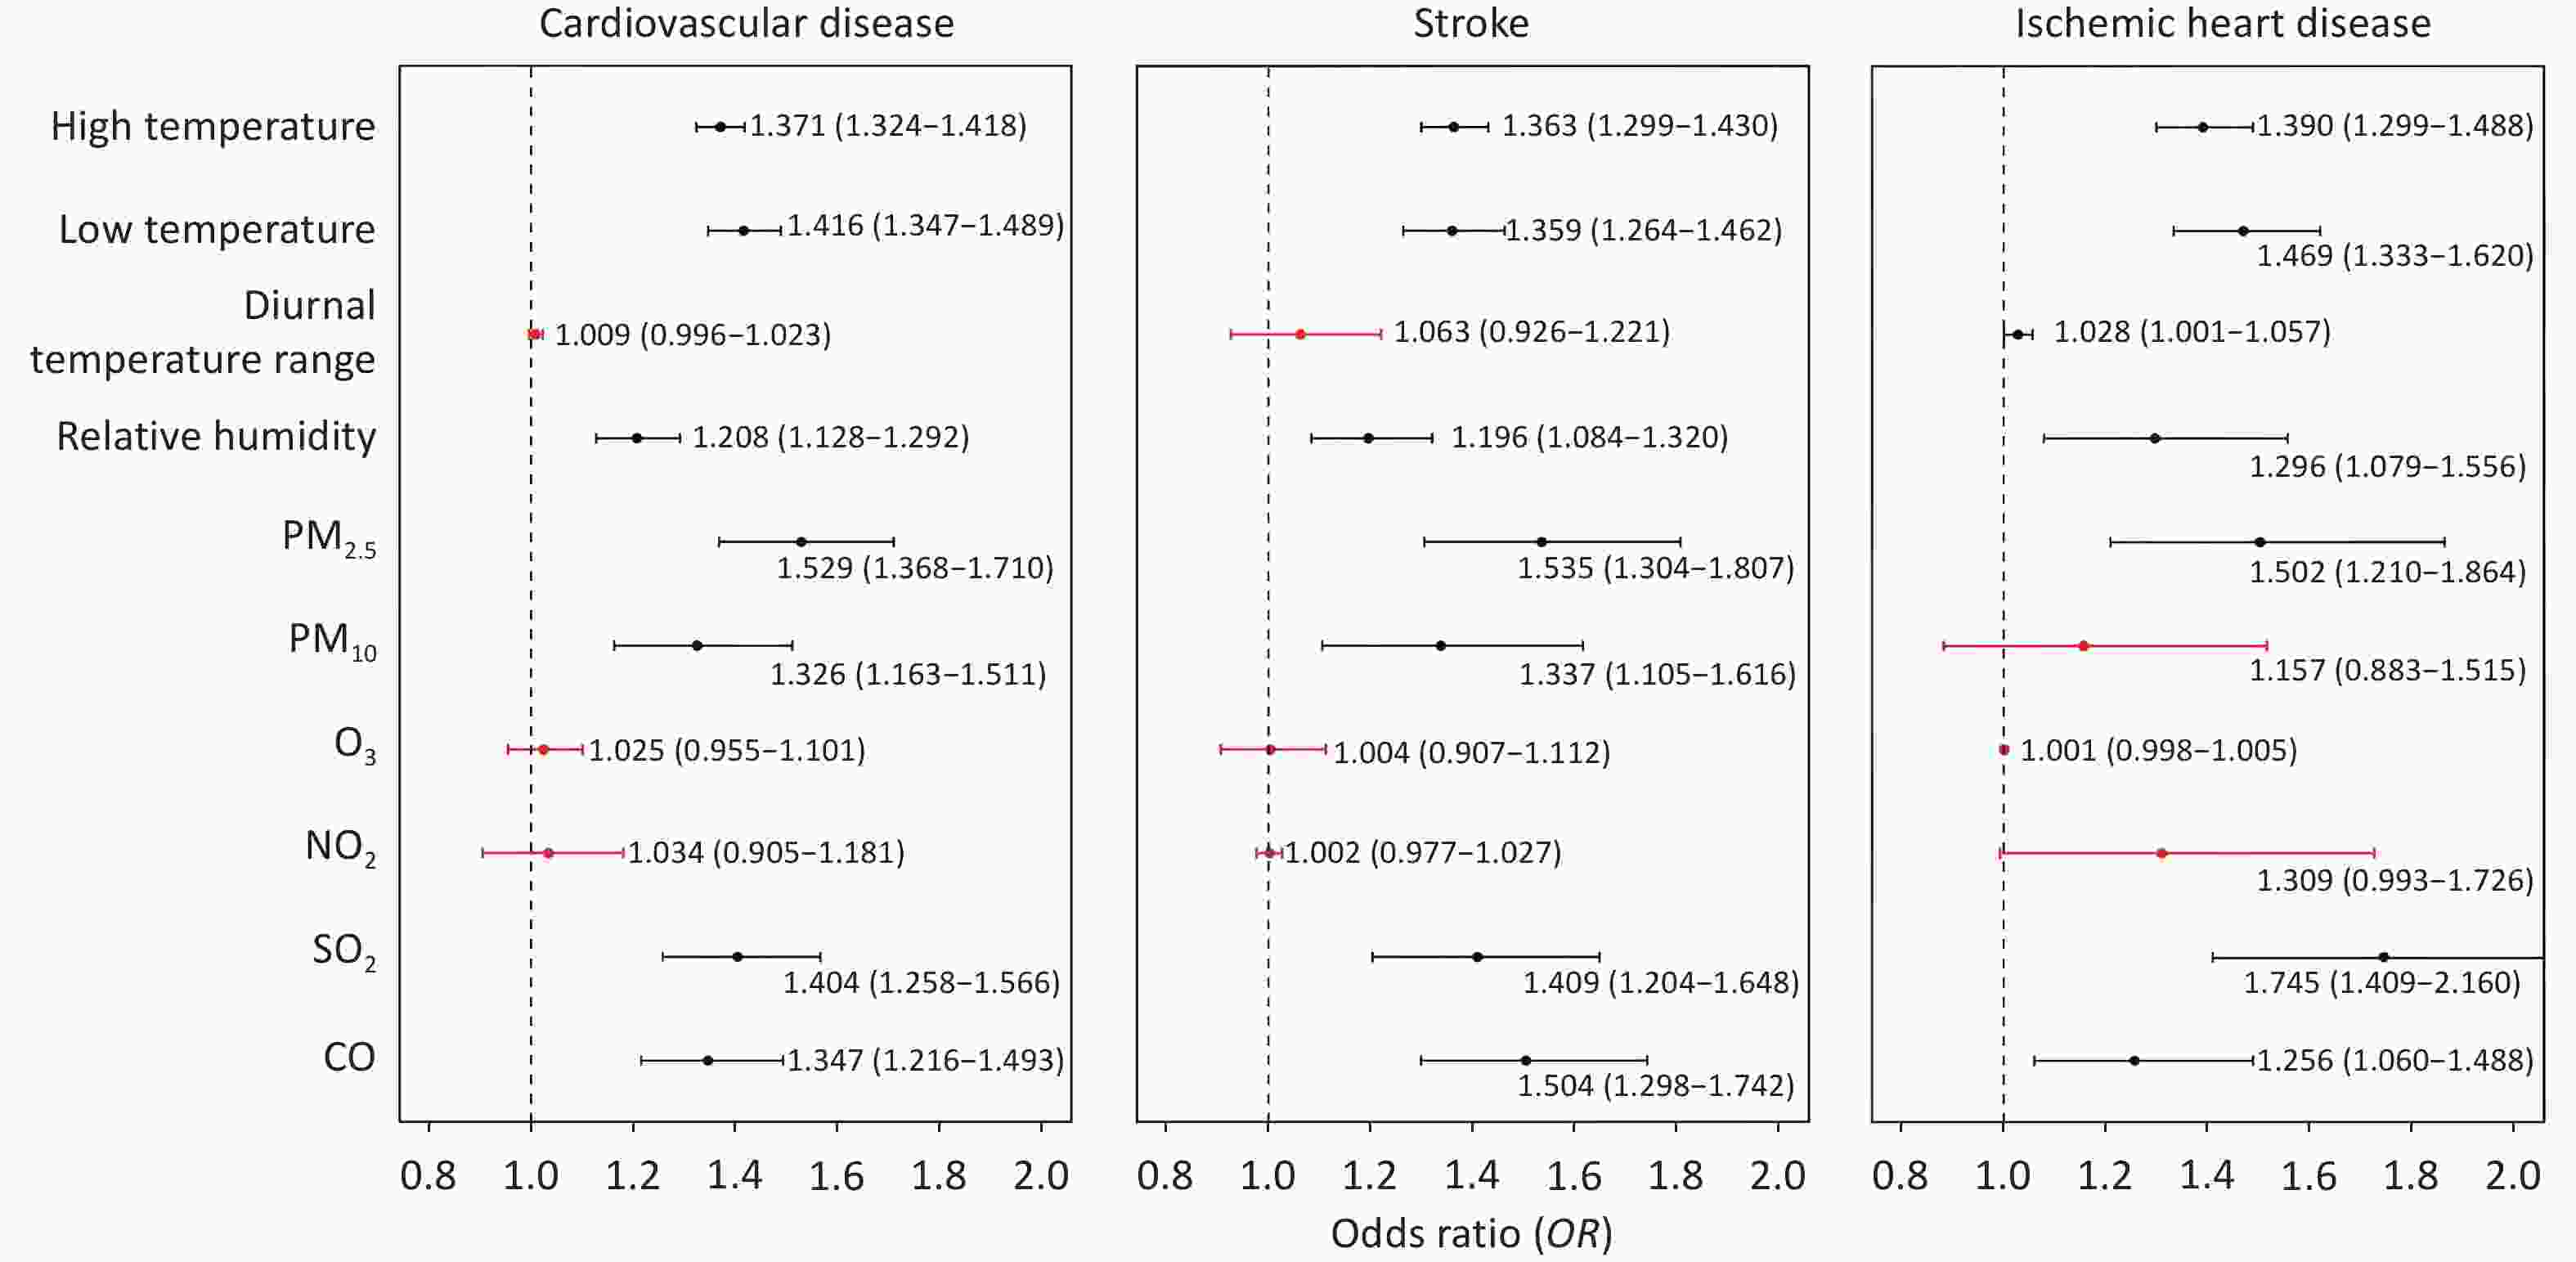
Figure 1. Estimated effects of air pollutants and meteorological factors on total cardiovascular disease and cause-specific mortality in Anhui Province, China. Dots represent the odds ratios (ORs), and the error bars indicate the 95% confidence intervals (CIs) associated with the 95th percentile of the daily distribution of each variable, except for low temperature, which was evaluated at the 5th percentile.
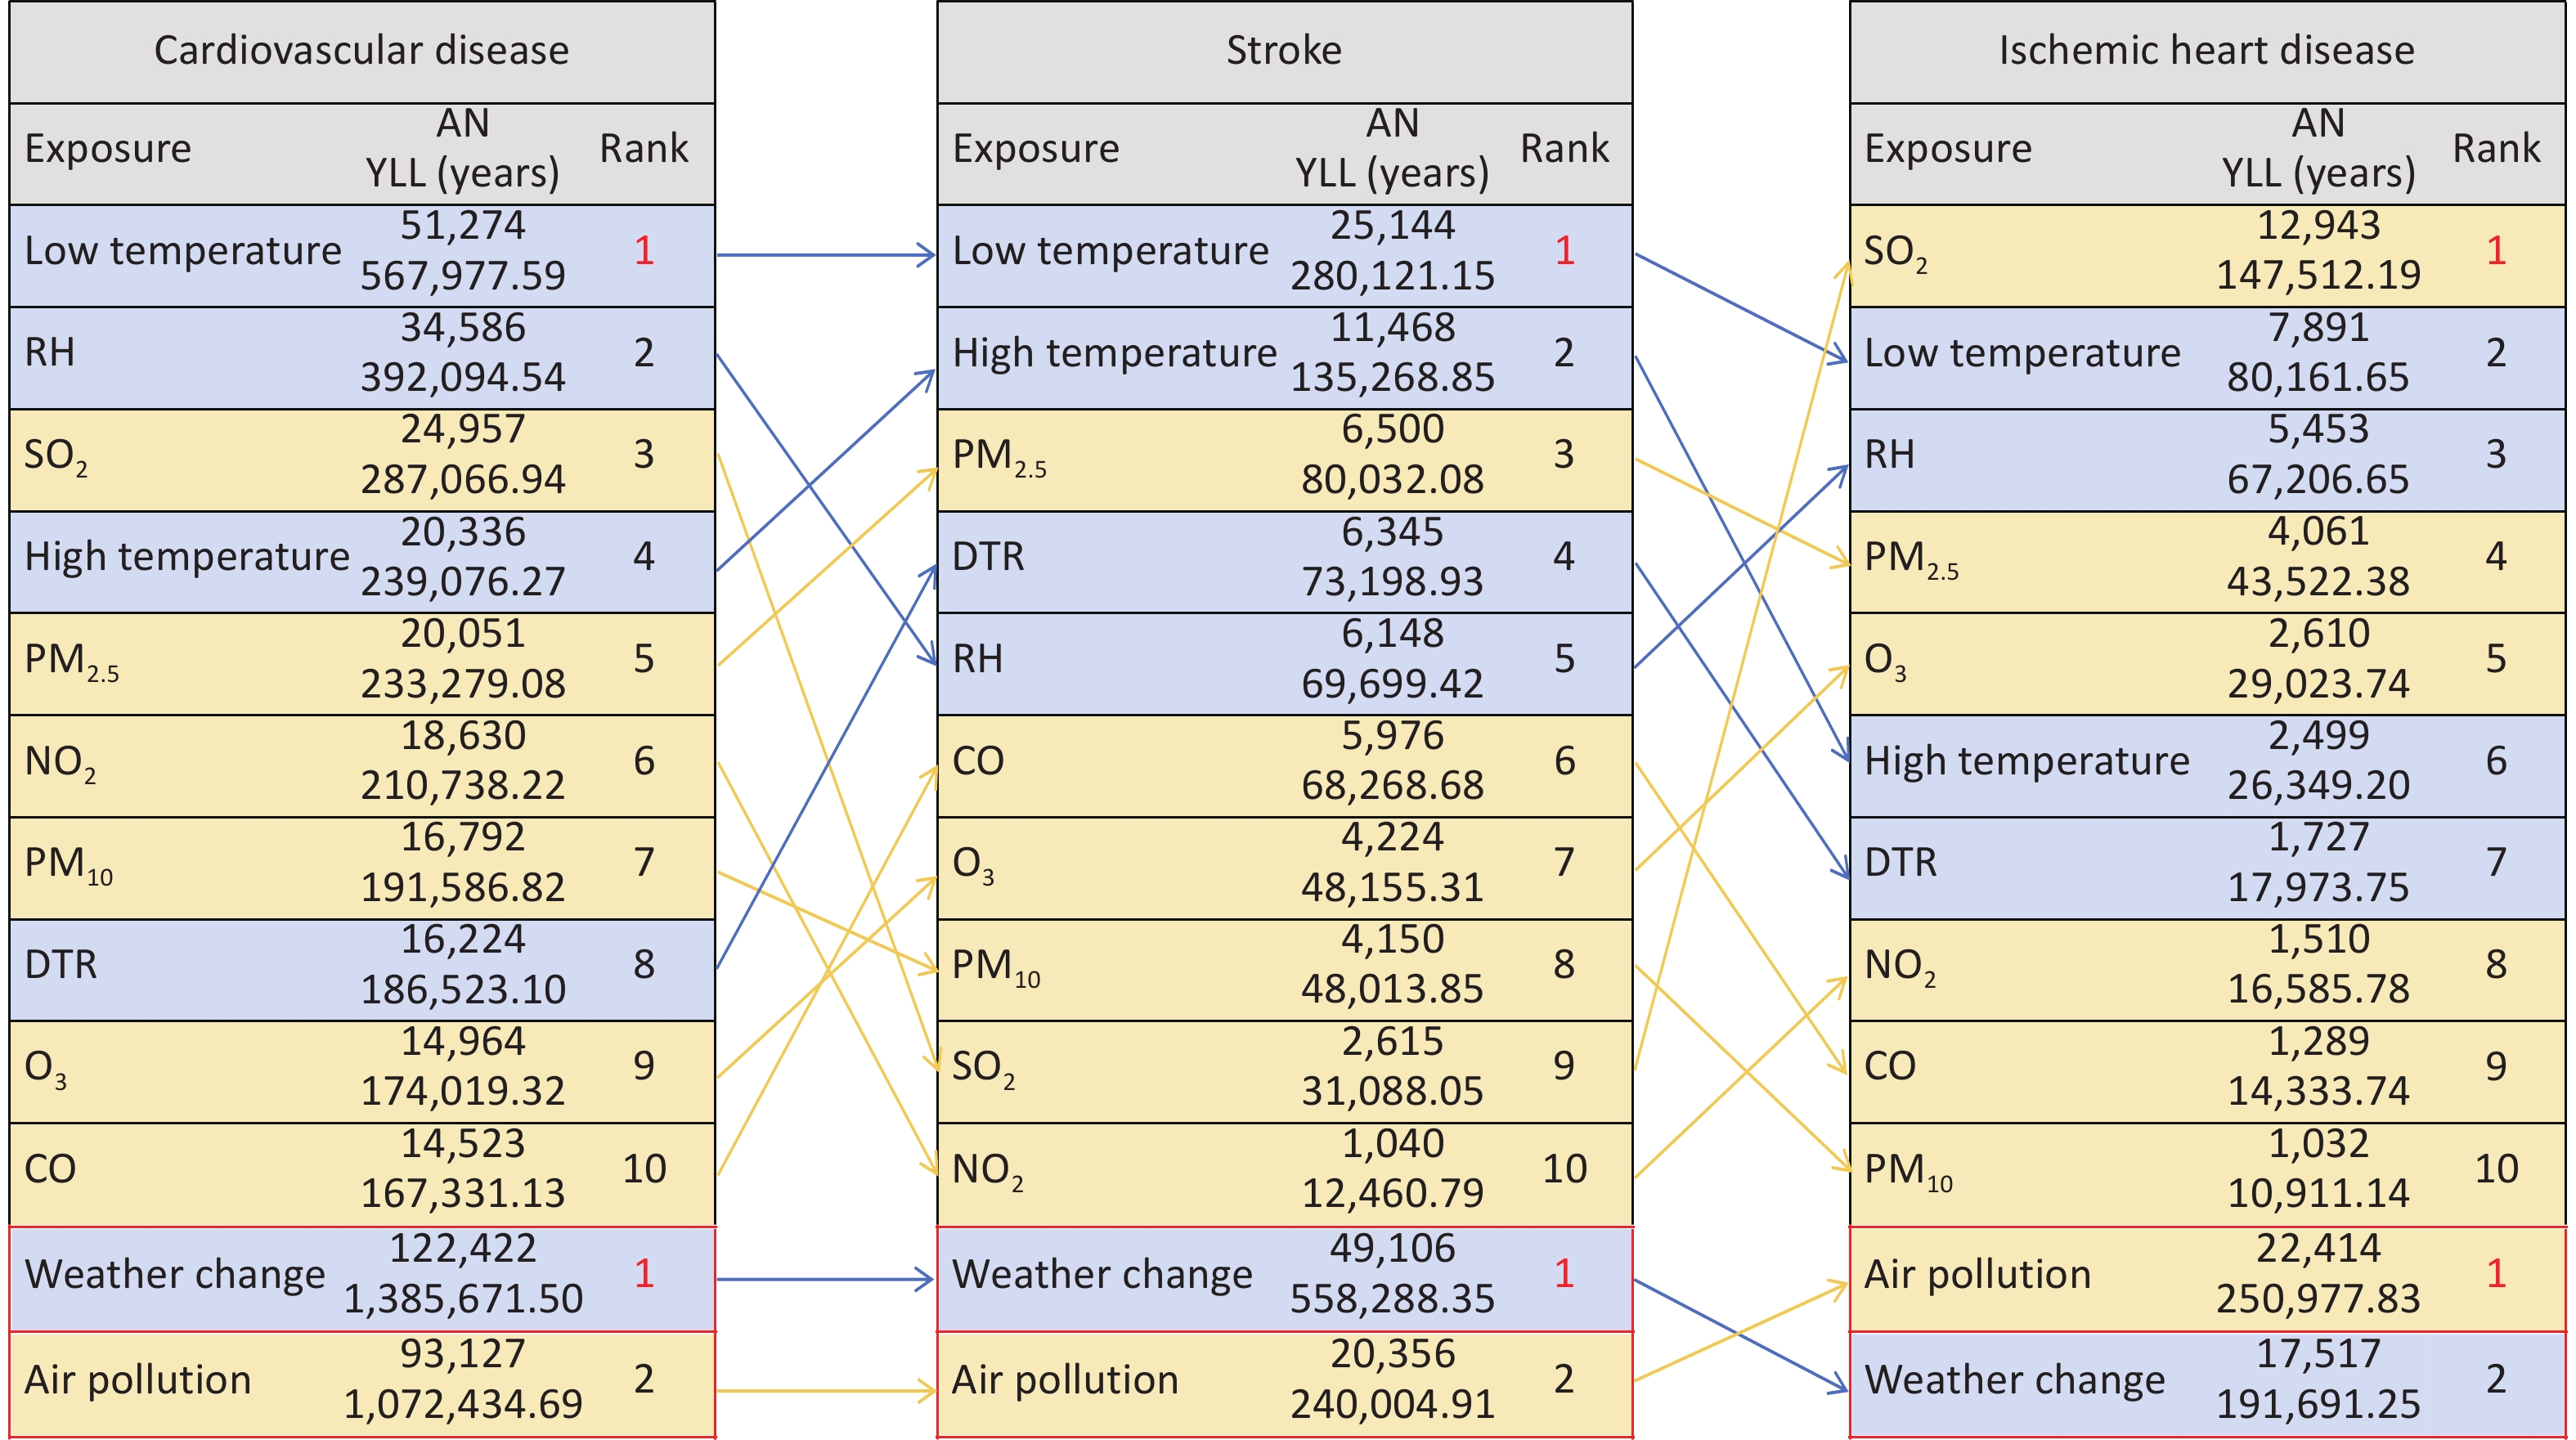
Although air pollutants (particularly PM2.5 and SO2) showed stronger associations with the mortality risk of total CVD, stroke, and IHD, meteorological factors (particularly low temperature) contributed more substantially to the disease burden of total CVD and stroke. This finding may be explained by the fact that a higher mortality risk does not invariably translate into a greater disease burden, as the latter also depends on the frequency of exposure and the size of the at-risk population. Figure 2 illustrates the estimated disease burden attributable to air pollution and meteorological factors. For total CVD, the greatest disease burden was attributable to low temperature (AN: 51,274; YLL: 567,977.59 years), followed by RH (AN: 34,586; YLL: 392,094.54 years) and SO2 (AN: 24,957; YLL: 287,066.94 years). For stroke, low temperature was also the primary contributor to the disease burden (AN: 25,144; YLL: 280,121.15 years). Notably, we found that SO2 surpassed low temperature as the primary contributor to the disease burden of IHD (AN: 12,943; YLL: 147,512.19 years). Although previous studies have shown that SO2 increases the risk of IHD mortality through oxidative stress and systemic inflammation, the mechanistic basis underlying its predominance over other risk factors in determining the disease burden of IHD remains unclear. Overall, meteorological factors contributed to a greater disease burden of total CVD and stroke than air pollution. Conversely, air pollution contributed to a greater disease burden of IHD than meteorological factors.
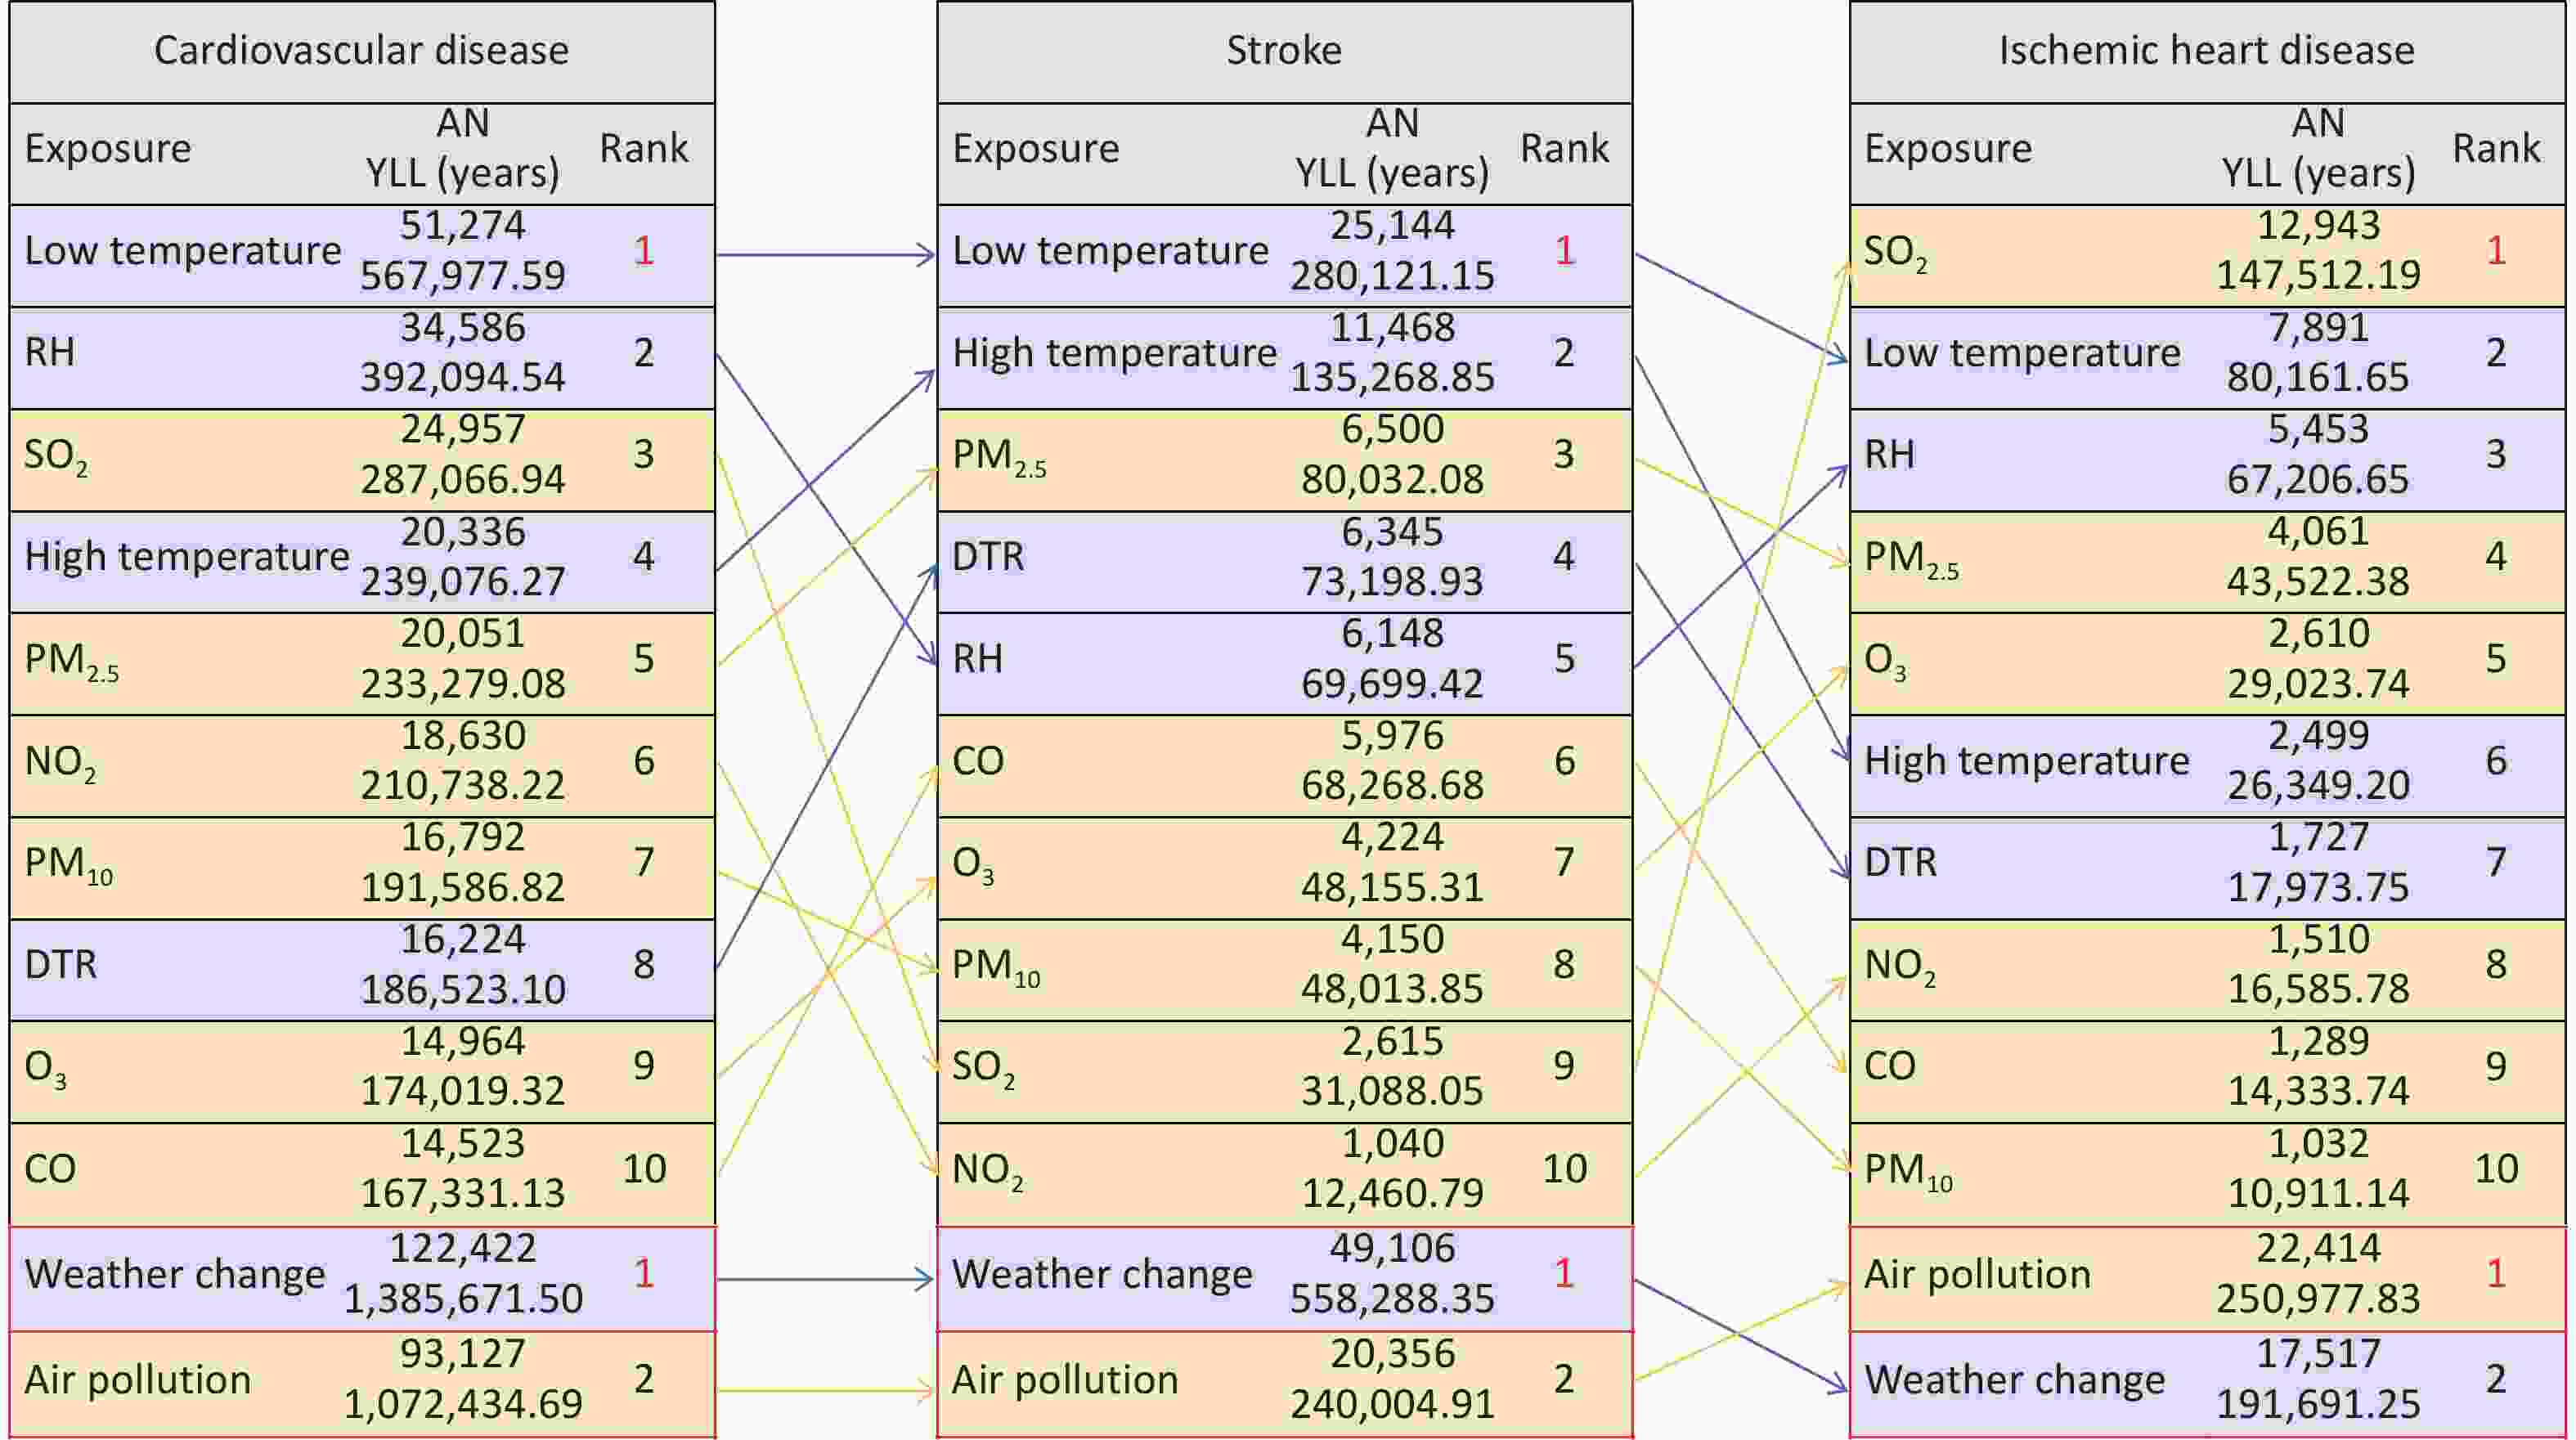
Figure 2. Ranking of the cardiovascular disease burden attributable to air pollution and meteorological factors in Anhui Province, China. YLL, years of life lost; AN, the attributable number of deaths; RH, relative humidity (%); DTR, diurnal temperature range (°C).
Our analysis further demonstrated regional heterogeneity in the relative contributions of air pollution and meteorological factors to the CVD burden (Supplementary Figure S4). For instance, in 11 of the 16 cities in Anhui Province, meteorological factors had a greater impact on the total CVD burden than air pollution, whereas in the remaining five cities, the disease burden attributable to air pollution exceeded that attributable to meteorological factors. Additionally, we found that meteorological factors remained the major contributor to the disease burden of total CVD after classifying the study cities into three geographic regions (i.e., northern, central, and southern regions) (Supplementary Figures S5–S7). These regional differences may be attributed to variations in climate conditions, air quality, population susceptibility, and socioeconomic status across regions. Additionally, we observed a greater CVD burden in northern and central Anhui compared with the southern region. This pattern may be partly attributable to lower air pollution concentrations in southern Anhui (Table 1), as well as colder winters in northern and central Anhui, which expose residents to more prolonged cold conditions than those experienced during the milder winters in the south. Such geographic disparities underscore the existence of distinct pathways or mechanisms through which environmental exposures affect cardiovascular health. Thus, the development of public health interventions require consideration of both province-wide trends and inter-city differences.
Sensitivity analyses showed that the effects of meteorological factors and air pollution on CVD mortality risk remained largely unchanged after altering the parameters of the DLNM (Supplementary Table S3). Additionally, the estimated total disease burden attributable to air pollution remained largely unchanged after replacing PM2.5 with PM10 during the data analysis (Supplementary Figure S8). Furthermore, varying the exposure lag period also yielded similar estimates of the attributable disease burden (Supplementary Figure S9).
To the best of our knowledge, this study is the first to use a uniform methodology with multivariable adjustment to compare the impact of air pollution and meteorological factors on CVD mortality. The comparisons of results were further stratified by specific air pollutants and meteorological factors, disease categories, and region. However, several limitations of this study should be acknowledged. First, we used city-level temperature data as a proxy for individual exposure rather than measuring exposure at the individual level. Although this approach has been widely used in previous studies, it may introduce exposure measurement bias. Second, we considered only the independent effects of each exposure and did not account for potential interactions between them, which may have influenced the assessment of the overall disease burden. Third, the estimation of YLL in this study relied on the national standard life table rather than the provincial life table for Anhui Province. Future studies could adopt a provincial-level life table to improve the accuracy of regional disease burden assessment. Finally, the quality of mortality data and under-reporting rates may vary across cities, and such differential outcome misclassification could bias the estimated exposure-mortality association.
This study demonstrates that meteorological factors have a greater impact on the burden of total CVD than air pollution. Specifically, non-optimal temperatures were the primary contributors to the burden of total CVD, but spatial heterogeneity was observed in the dominant environmental contributors, highlighting the need for localized research to prioritize preventive measures.
HTML
Competing Interests The authors declare that they have no competing interests.
Ethics The study was approved by the Ethics Committee of Anhui Medical University (approval no. 81250374).
Authors’ Contributions Data curation, Formal analysis, Methodology, Software, Visualization, Writing - original draft: Xiuya Xing, and Yiming Gai; Investigation, Writing - review & editing: Jingli Zhu, Qinglian Meng, and Yinguang Fan; Visualization, Writing - review & editing: Wenjun Cheng, Qianyao Cheng, and Hong Su; Conceptualization, Data curation, Formal analysis, Methodology, Project administration, Resources, Software, Supervision, Validation, Visualization, Writing - review & editing: Huadong Wang and Qinghua Xu; Conceptualization, Data curation, Formal analysis, Funding acquisition, Methodology, Project administration, Resources, Software, Supervision, Validation, Visualization, Writing - review & editing: Jian Cheng.
Data Sharing Daily mortality data were obtained from the Anhui Provincial Center for Disease Control and Prevention. Daily meteorological data on mean temperature and relative humidity for each city across Anhui Province were obtained from the ERA5-Land dataset (
&These authors contributed equally to this work.
Reference

 Quick Links

 DownLoad: