



-
Cardiovascular disease (CVD) continues to be a major problem in Chinese public health, and air pollution is a secondary risk factor[1]. Although the overall air quality has improved since 2013, the trend between certain pollutants has diverged substantially; population-weighted fine particulate matter (PM2.5) and nitrogen dioxide (NO2) have decreased, but ozone (O3) has increased dramatically[2,3]. Such opposing trends, along with the rapid aging of the population and great heterogeneity across regions, imply that the CVD burden due to air pollution exhibits very complicated spatiotemporal dynamics. Nevertheless, earlier evaluations were mostly conducted on a national or provincial scale, based on a standardized rate of baseline incidence, which does not reflect city-level differences. Thus, an integrated, high-resolution city-level assessment of this burden, its inequities, and the factors underlying its temporal evolution are urgently required to shape accurate and equitable environmental health policies.
We calculated exposure-response relationships using single-subject data of two nationwide prospective cohorts, China Health and Retirement Longitudinal Study (CHARLS), which included adults aged 45 and over in 28 provinces, and Chinese Longitudinal Healthy Longevity Survey (CLHLS), which involved individuals aged 65 and over in 23 provinces (Supplementary Figure S1). Both cohorts received ethical approval for this study. The CHARLS and CLHLS studies were approved by the Biomedical Ethics Committee of Peking University (IRB numbers: IRB00001052-11015 and IRB00001052-13074, respectively), and written informed consent was obtained from all participants at enrollment. Detailed cohort descriptions are provided in the Supplementary Materials.
We included five waves of the CHARLS (2011, 2013, 2015, 2018, and 2020) and four waves of the CLHLS (2008, 2011, 2014, and 2018), which involved follow-up surveys every 2–3 years. Participants lacking essential sociodemographic data (e.g., age, sex) were excluded (n = 3,301; 9.55% of the total sample). After applying these criteria, the analytical sample comprised 22,877 individuals with 141,825 person-years of follow-up and a mean follow-up duration of 6.20 years, during which 4,802 (20.9%) patients developed CVD. The baseline characteristics of the cohort are summarized in Supplementary Table S1, and a participant flow diagram is presented in Supplementary Figure S2.
Air pollutant exposure data were derived from the China High Air Pollutants (CHAP) dataset, which integrates satellite retrievals, ground-based observations, atmospheric reanalysis, and emission inventories with a high predictive performance (10-fold cross-validation R2: 0.92 for PM2.5, 0.89 for O3, 0.84 for NO2) at a spatial resolution of 1–10 km[4]. The participants’ annual average exposure concentrations for PM2.5 and NO2, and average maximum daily 8-hour ozone (MDA8 O3) were assigned based on their city-level residential addresses for each survey year. Multi-pollutant models were constructed to control for mutual confounding: for PM2.5, we adjusted for O3; for O3, we adjusted for PM2.5 and NO2; for NO2, we adjusted for O3 (PM2.5 and NO2 were not included simultaneously due to collinearity, Spearman r = 0.72)[5]. The covariates included age, sex, region (north/south divided by the Qin-Huai line), residence (urban/rural), education, marital status, smoking status, drinking status, body mass index (BMI), and self-rated health. Following directed acyclic graph (DAG) guidance (Supplementary Figure S3), we incorporated unmeasured theoretical confounders (genetic susceptibility, noise exposure, psychological stress, and dietary quality), shown as dashed nodes in the DAG. We conducted a series of sensitivity analyses to validate the robustness of the association between air pollutants and CVD. In addition to modifying the covariate adjustment sets, we extended our exposure window definition by replacing the concurrent year-averaged pollutant concentration with a lagged 1-year average concentration. The results are presented in Supplementary Table S2.
The outcome measure was incident CVD during follow-up, defined as a self-reported history of heart disease or stroke. We used time-dependent Cox proportional hazards models to estimate hazard ratios (HRs) and 95% confidence intervals (CIs) per interquartile range increase in pollutant concentration, with natural spline functions to test for nonlinearity. To estimate city-level CVD incidence rates while accounting for individual-level risk factors and spatial autocorrelation, we developed a Bayesian spatiotemporal model with city-specific random effects using the Besag-York-Mollié prior for structured spatial dependence and a first-order random walk for national temporal trends, with inference via an integrated nested Laplace approximation.
Attributable number (AN) of incident CVD cases due to three air pollutants was calculated by multiplying incident CVD cases by population attributable fraction (PAF), using the following formula:
$$ {AN}_{i,t}={IR}_{t}×{Pop}_{i,t} \times PAF\left({C}_{i,t}\right) $$ (1) $$ PAF\left({C}_{i,t}\right)=\left(1-{e}^{-\beta \times max\left({C}_{i,t}-TMREL,0\right)}\times 100\% \right) $$ (2) where IRt denotes the incidence rate of CVD among middle-aged and older individuals aged 45 and above in year t; Popi,t represents the population size of city i in year t, estimated using WorldPop data (provided in Geotiff format with a spatial resolution of 1 km); Ci,t represents the annual average concentrations of PM2.5, O3, and NO2 in city i during year t; β denotes the ln(HR) corresponding to a 1 µg/m3 increase in the respective pollutant concentration.
Following the World Health Organization (WHO) 2021 Air Quality Guidelines (2021 AQG), we set the Theoretical Minimum Risk Exposure Levels (TMREL) for PM2.5, O3, and NO2 at 5 µg/m3, 60 µg/m3, and 10 µg/m3, respectively. Absolute inequality was assessed using percentile differences (P99–P1, P95–P5, P90–P10), and relative inequality using Gini coefficients and Lorenz curves. Decomposition analysis was used to quantify the independent contributions of changes in pollutant concentrations, population aging, and baseline CVD incidence rates to the temporal change in the attributable burden. The analytical process comprised four key steps, as shown in Supplementary Figure S4.
The R software (V4.4.0, R Development Core Team) was used for all analyses. All statistical analyses were two-sided, and statistical significance was defined as P-value < 0.05.
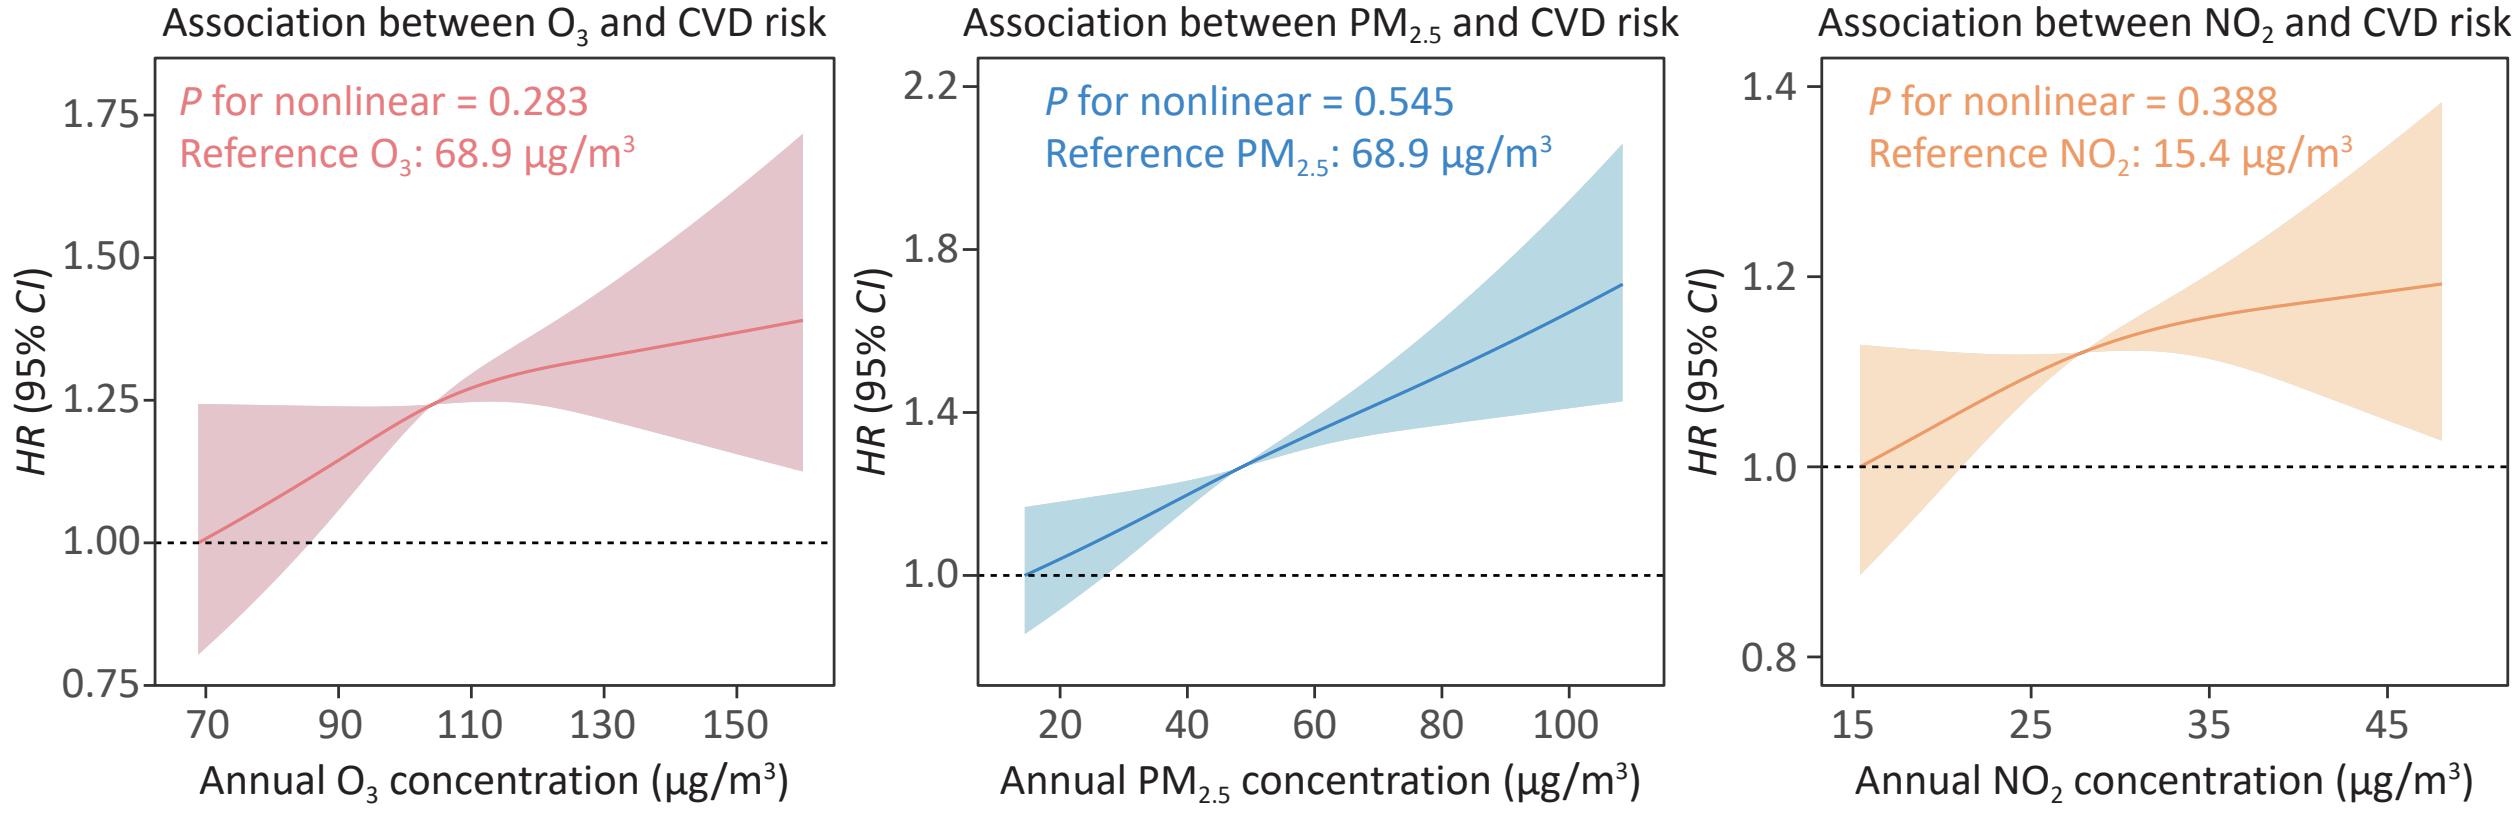
Each interquartile range increase in PM2.5 (HR = 1.15, 95% CI: 1.09–1.22), O3 (HR = 1.06, 95% CI: 1.00–1.13), and NO2 (HR = 1.07, 95% CI: 1.00–1.14) was associated with increased CVD risk in multi-pollutant adjusted time-dependent Cox models. Linear exposure-response relationships were found in the restricted cubic spline analysis of all three pollutants (P for nonlinearity: 0.545, 0.283, and 0.388, respectively), and there were no apparent thresholds (Figure 1 and Supplementary Figure S5). These HR are similar to those of previous longitudinal studies in China[6]. The linear and no-threshold models are supported by the statement of the American Heart Association that health risks related to PM2.5 remain at low levels and that even a small exposure has the potential for harm. This means that the control of air pollution should not only meet the existing standards, but also be aimed at reducing the concentrations to the lowest possible level to achieve further health gains.
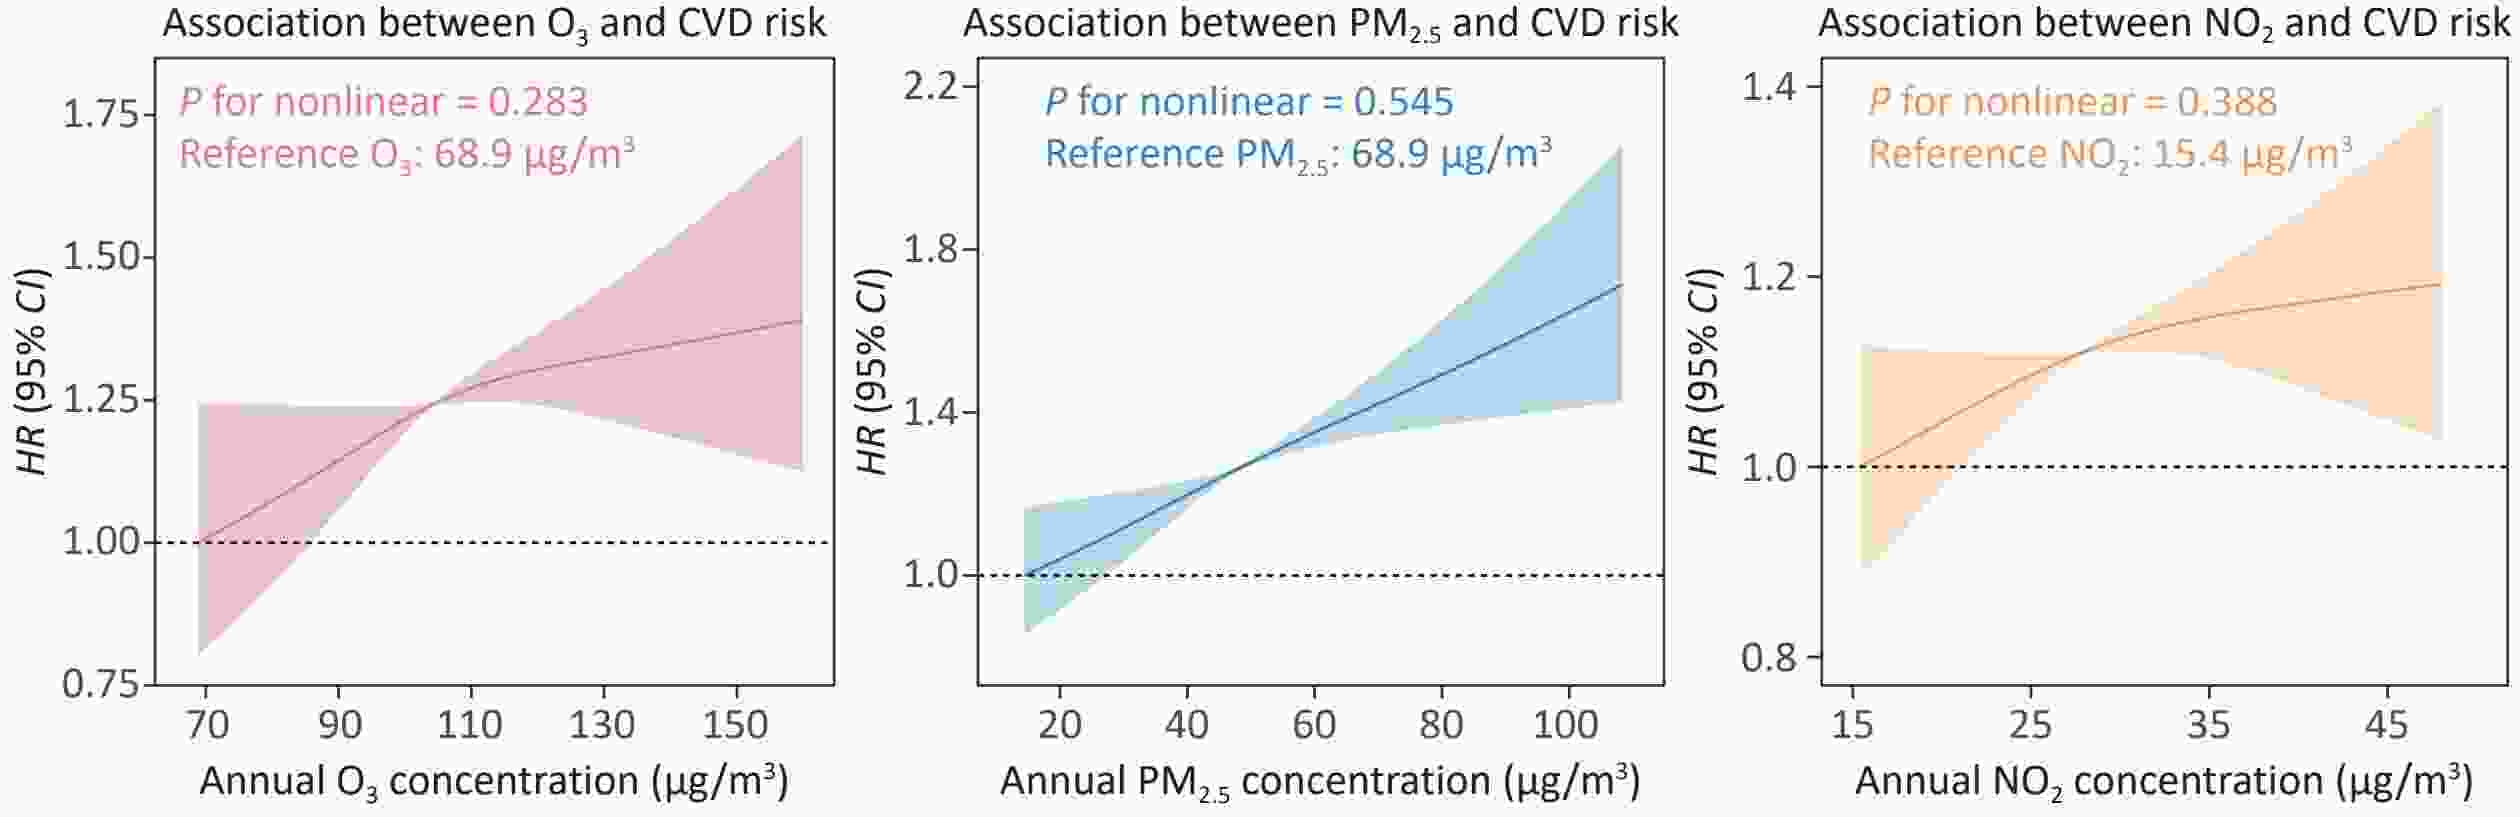
Figure 1. Linear dose–response relationships between long-term exposure to O3 (A), PM2.5 (B), and NO2 (C) and incident CVD risk. For all three pollutants, each 1 μg/m3 increase was associated with a linear increase in CVD risk, with no discernible thresholds (P for non-linearity > 0.05 for all). CVD, cardiovascular disease; PM2.5, fine particulate matter; NO2, nitrogen dioxide; O3, ozone.
The mean incidence rate in 212 cities in 2019 was 2.28% (95% CI: 1.07%–4.32%), which is close to the national CVD incidence rate of 2.07% (95% CI: 1.71%–2.78%) recorded for the Global Burden of Disease (GBD). Cities with higher incidence rates were mostly in northern China, whereas those with lower rates were mostly in southern China (Supplementary Figure S6). Such north-south disparities are also reflected in the spatial distribution of pollutants and can be explained by regional differences in the industrial structure and urban planning that define the level of emissions and CVD risk factors.
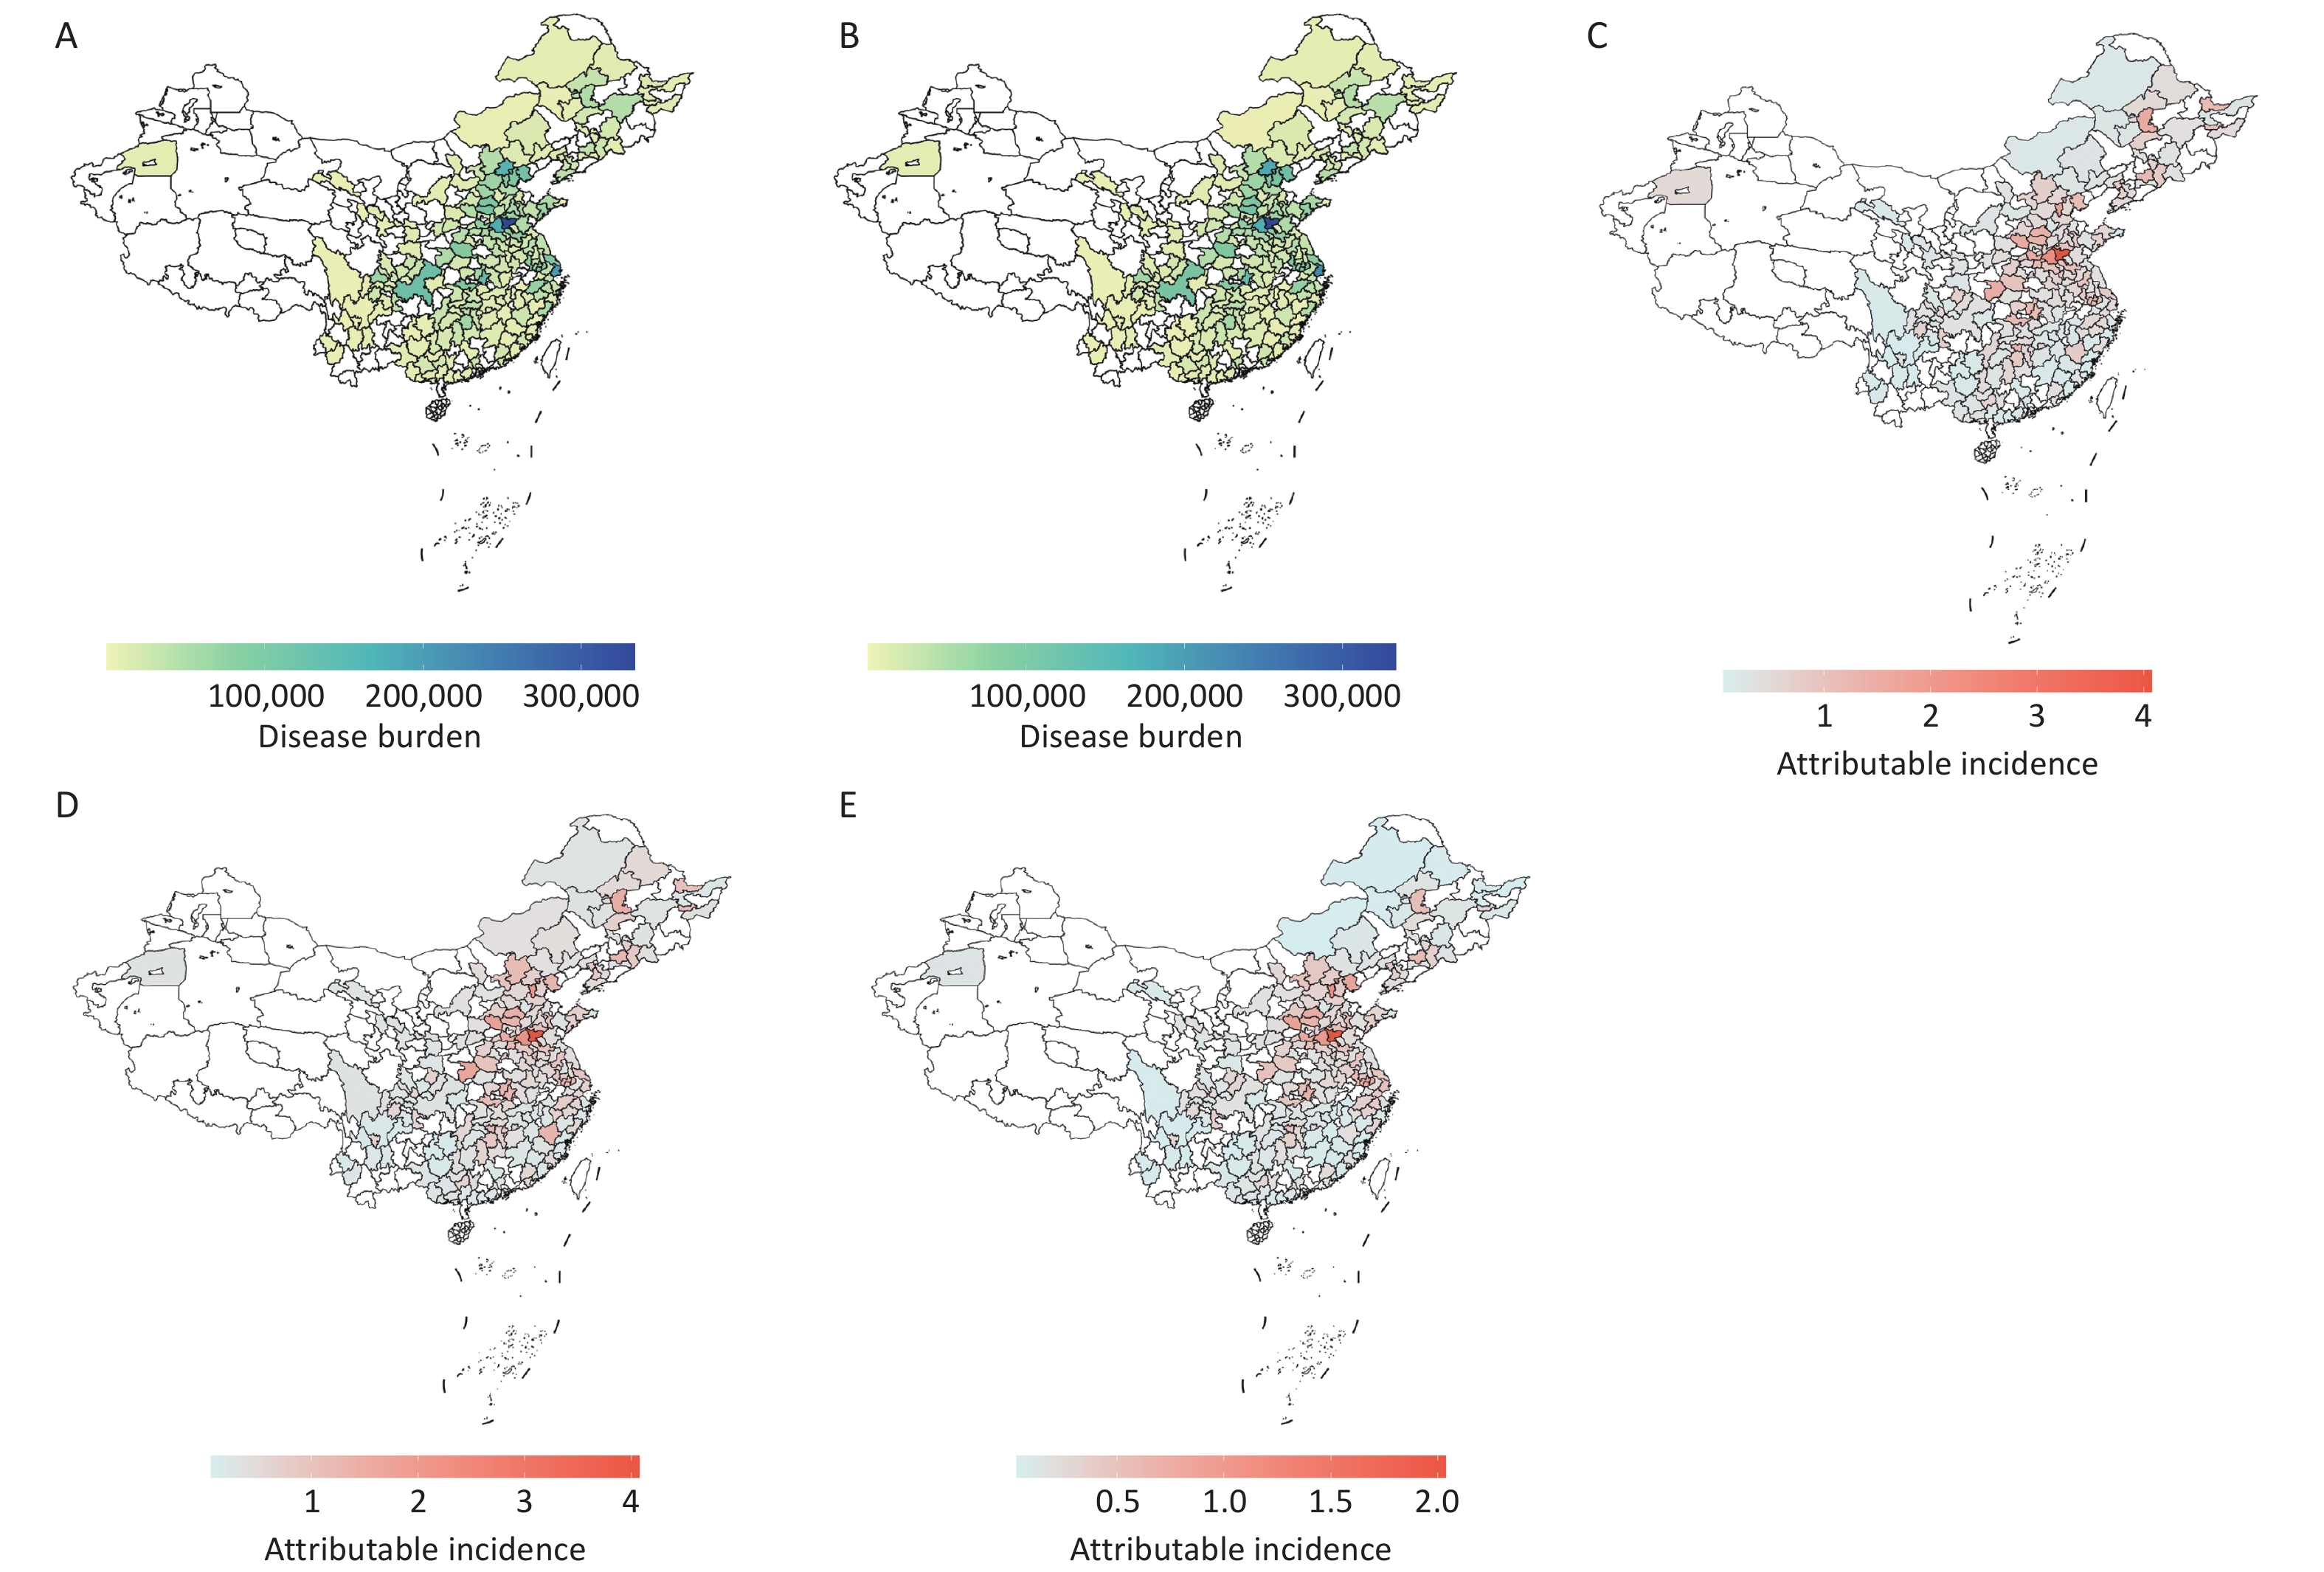
The burden of CVD related to these three air pollutants in 212 cities was estimated at 6.81 million cases in 2019, which was 14.8% higher than that in 2013. O3 was the largest contributor (43%) to the pollution-related CVD burden, followed by PM2.5 (37%) and NO2 (20%). From 2013 to 2019, the PM2.5-related CVD burden decreased by 22.4%, whereas the NO2 and O3-related burdens increased by 14.1% and 96.3%, respectively (Figure 2 and Supplementary Figure S7). Of the attributable incidence rates of three air pollutants in 2019, O3 had the highest attributable incidence rate (0.64%), PM2.5 approached this value (0.55%), and NO2 was the lowest (0.30%). Spatially, the attributable incidence rates of all three air pollutants in the Beijing-Tianjin-Hebei area and its surroundings were greater than those in the Yangtze River Delta and Fenwei Plain. We also conducted geographical subgroup analysis. The pollutant-specific and combined attributable burden estimates of the regions are shown in Supplementary Table S3. Attainment of the WHO 2021 AQG target concentrations for all three pollutants could have prevented approximately 6.81 million cardiovascular events in 2019. As China is currently experiencing far higher ambient concentrations than the reference values, the relative patterns and trends remain strong. The WHO 2021 AQG counterfactual will maintain consistency with the global GBD framework and allow international comparability. However, more studies using China-specific thresholds will be useful in making policy decisions locally.
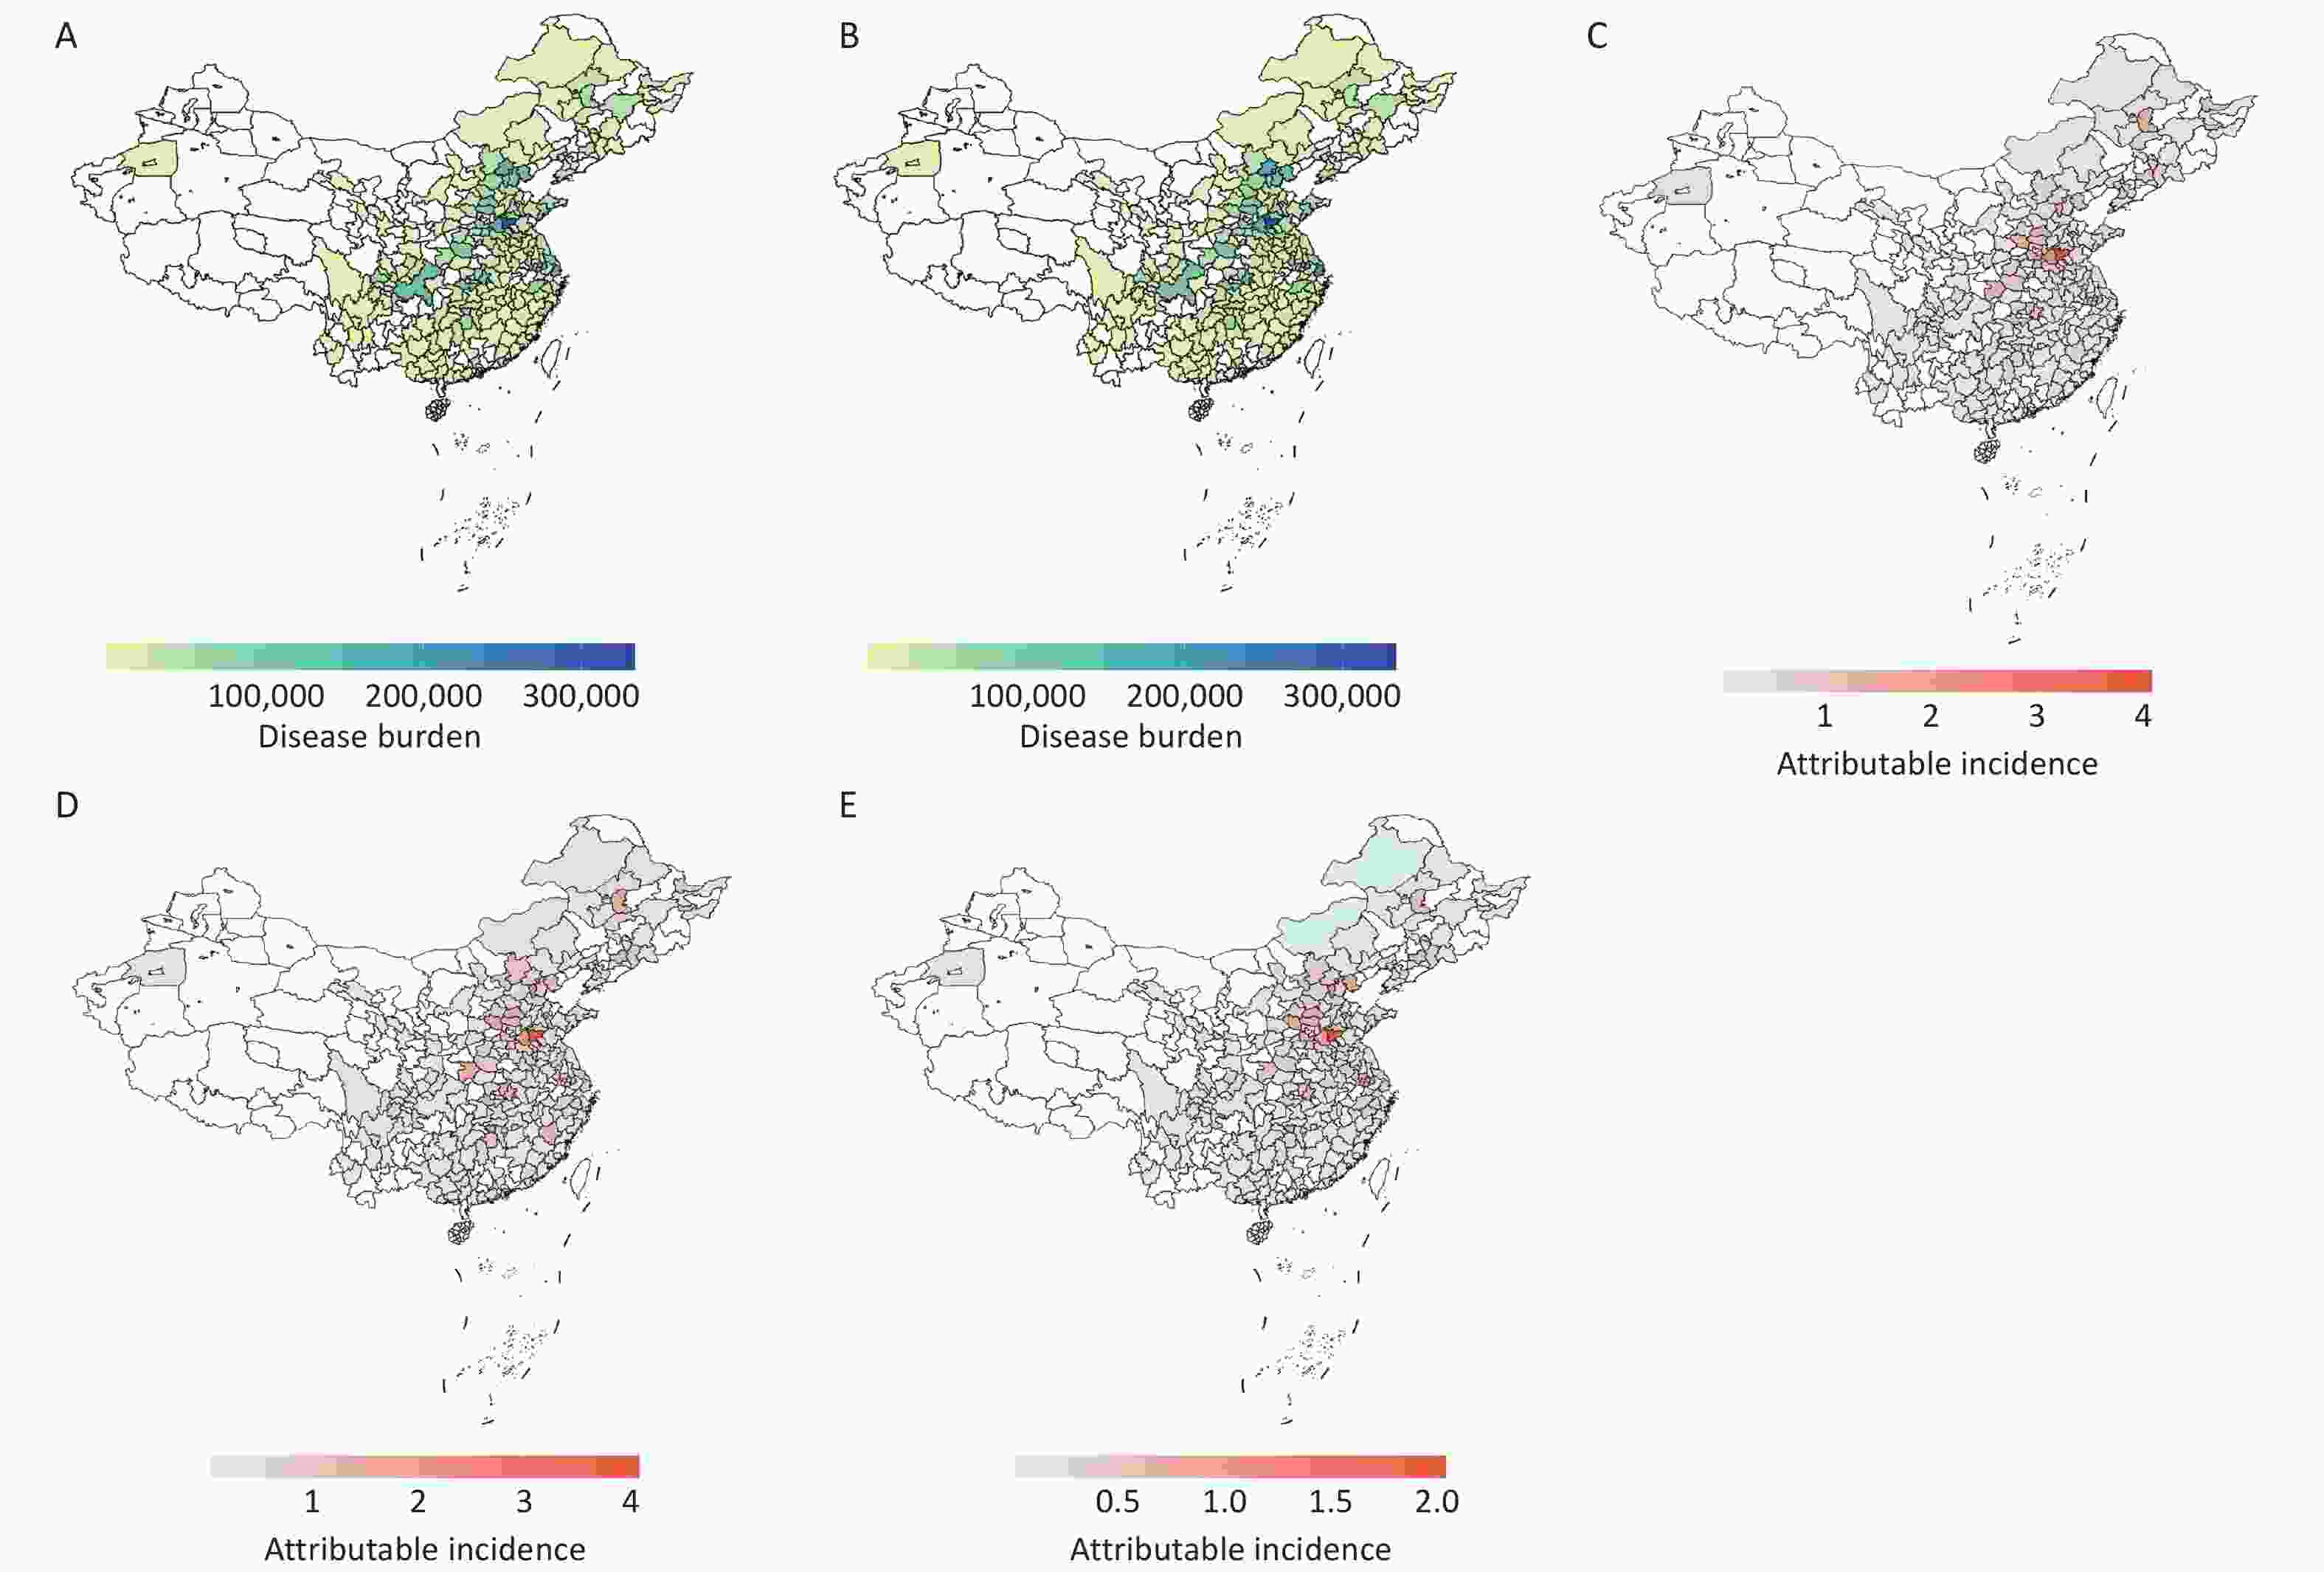
Figure 2. Spatial distribution of the total CVD burden (number of cases) attributable to the three air pollutants combined in 2013 (A) and 2019 (B), and the city-level attributable incidence rates for PM2.5 (C), O3 (D), and NO2 (E) in 2019. The total burden increased by 14.8% from 2013 to 2019, reaching 6.81 million cases, with O3 contributing the largest share (43%), followed by PM2.5 (37%) and NO2 (20%). CVD, cardiovascular disease; PM2.5, fine particulate matter; NO2, nitrogen dioxide; O3, ozone.
The inequality analysis showed growing absolute differences in the total CVD burden between cities. The gap between the 99th and 1st percentile of CVD burden caused by three air pollutants remained high and rose by 0.16 million cases in 2013 to 0.19 million cases in 2019. Other analyses that used different percentiles yielded similar results. The same results were noted when exposed to O3 and NO2 separately, and the absolute inequality in PM2.5 displayed a decreasing trend (Supplementary Figure S8).
The relative inequality, as measured by Gini coefficients, was consistently high and relatively unchanged (0.53–0.55). The rankings of the attributable CVD burden at the city level were temporally consistent between 2013 and 2019 (Supplementary Figures S9–S12). Chinese cities had a relatively constant disparity in CVD burden during the years 2013–2017 which increased rapidly since 2017, corresponding to the rapid growth in the O3 concentration levels of pollution. In this regard, these disparities can be reduced with the help of region-specific policy interventions and focusing on reducing emission rates and protecting health conditions in regions with a high burden of disease where vulnerable groups are exposed to the cumulative risks of pollution and aging[7–9].
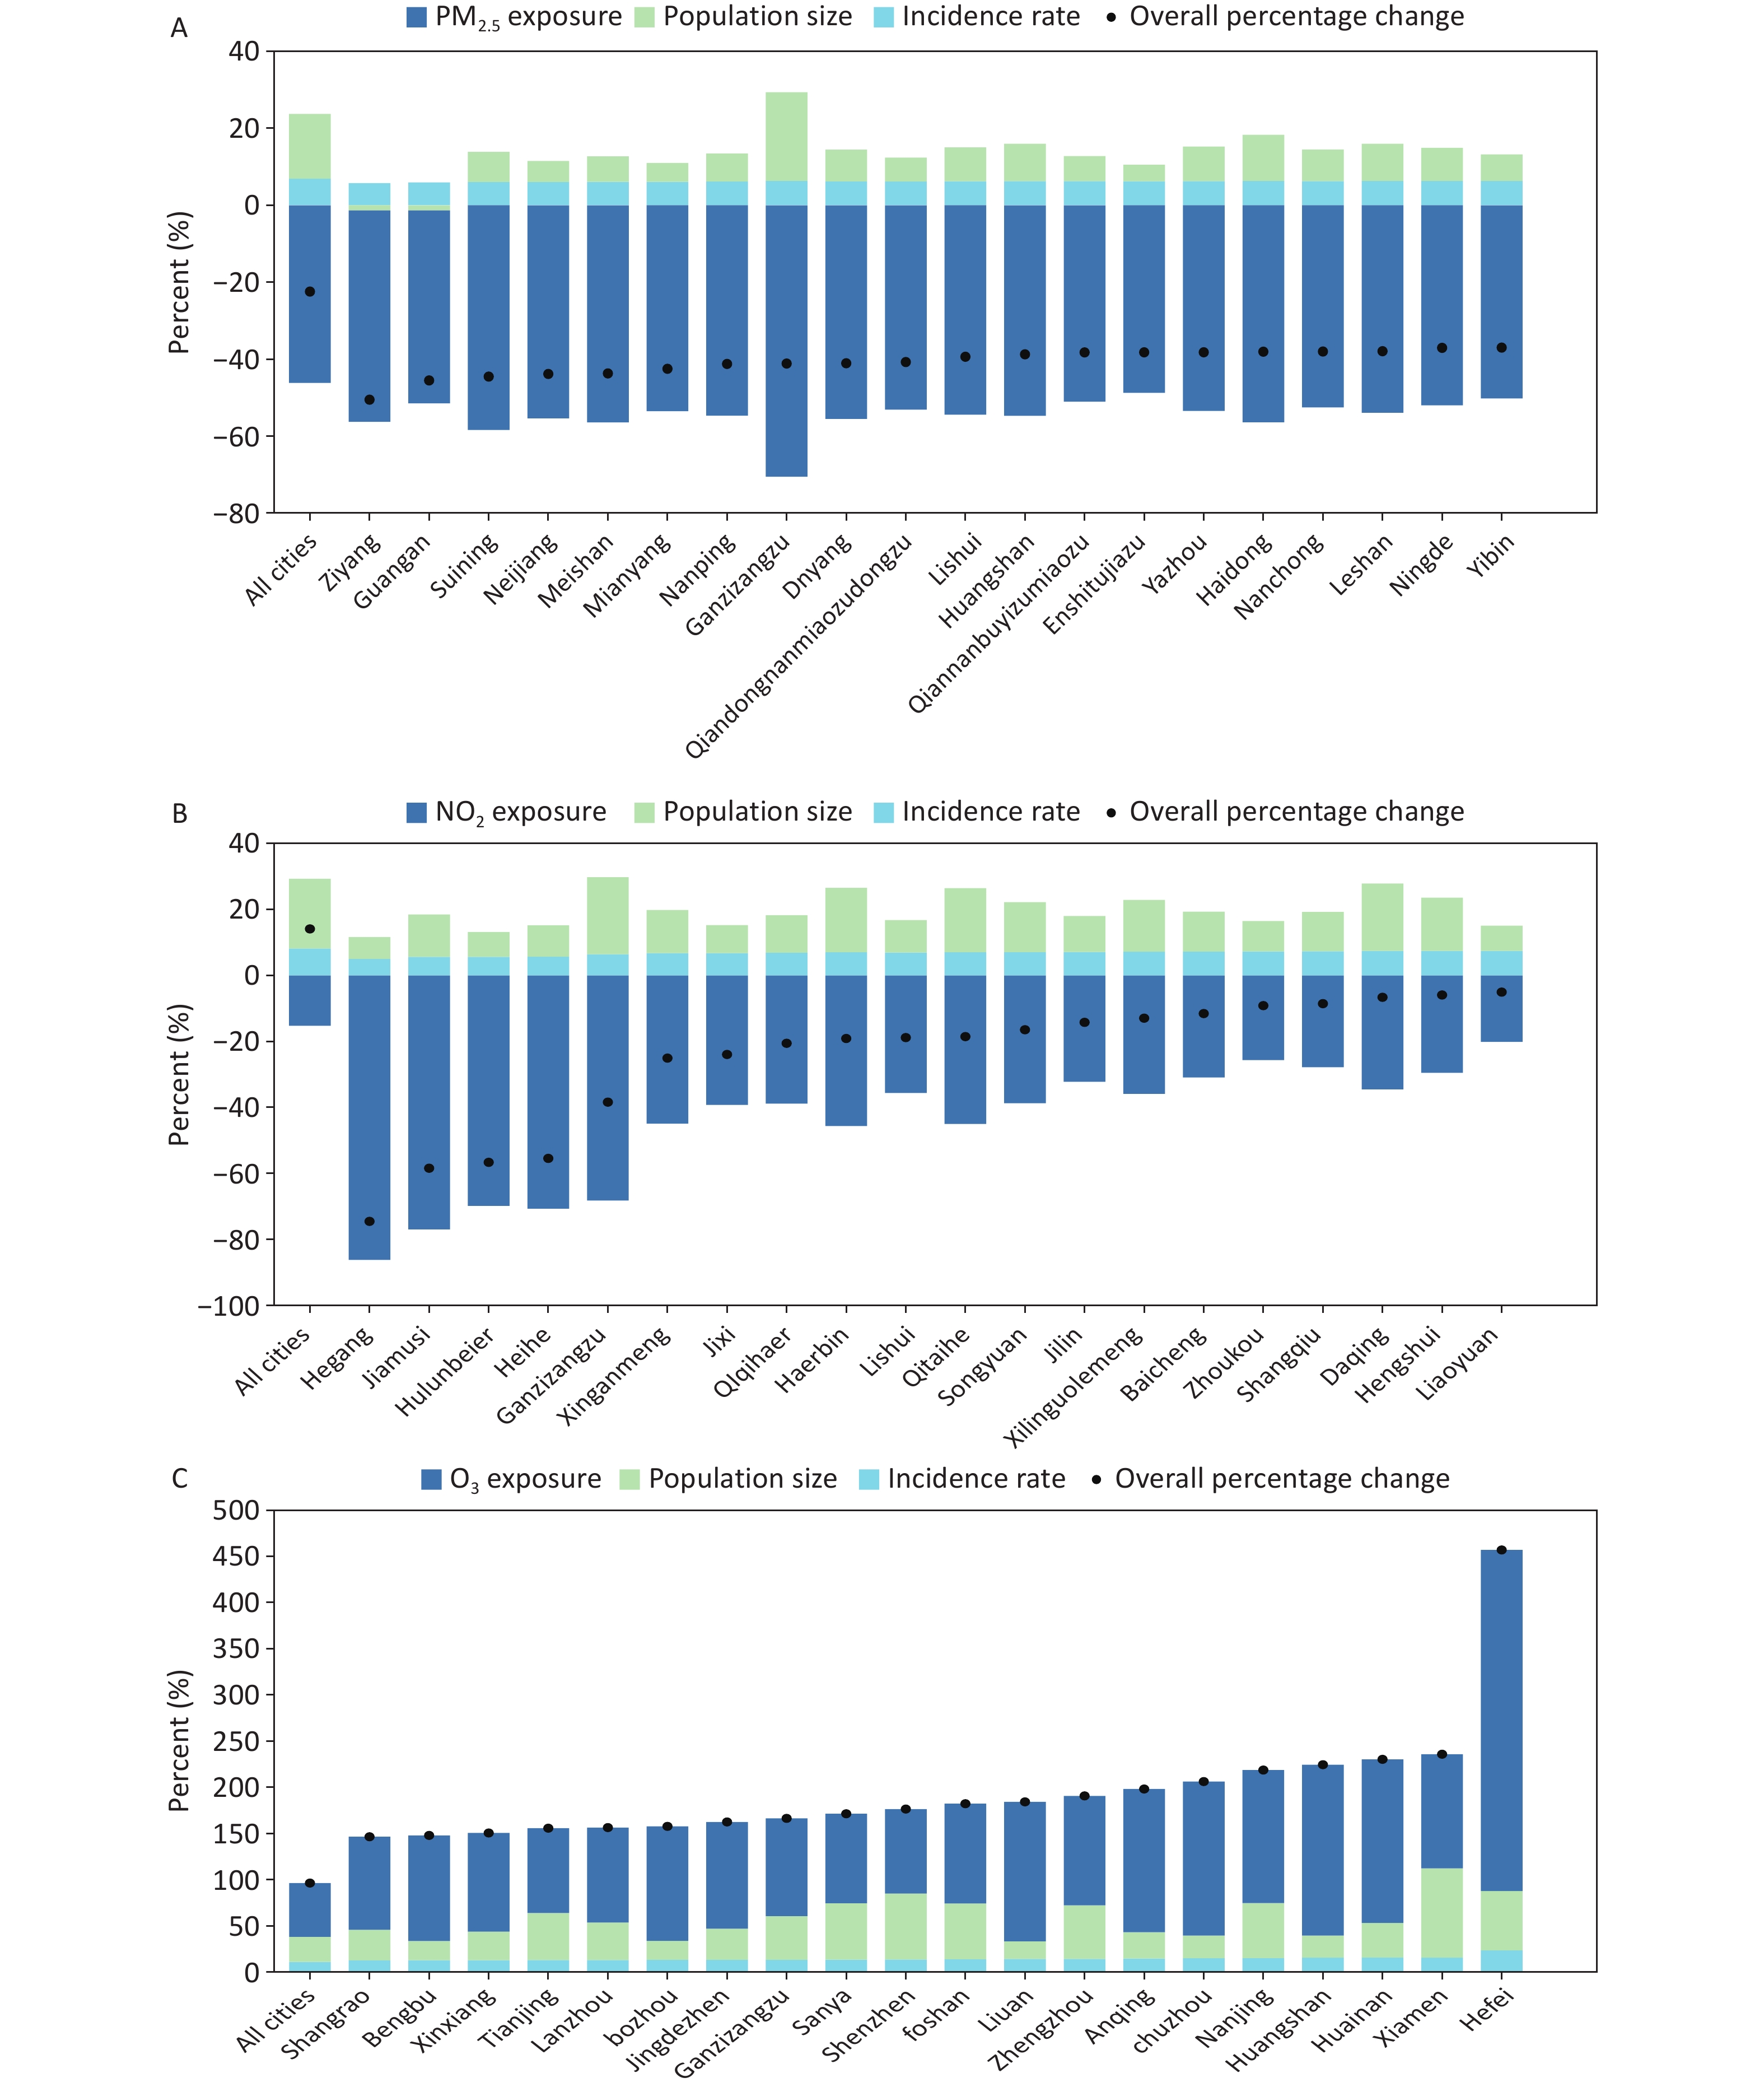
Decomposition analysis revealed significant heterogeneity in the drivers of these divergent trends (Figure 3). The total CVD mortality caused by PM2.5 declined by 22.4%, mainly because of a significant decrease in the level of PM2.5 (-46.1%), which eliminated the increase in the number of cardiovascular cases (+6.9%) and population aging (+16.8%). This is a very good indication that the stringent clean air policies enforced in China over the last ten years have positive implications for health. Conversely, the CVD burden related to NO2 increased by 14.1%, whereas the decrease in its concentration (−15.2%) could not balance the total impacts of increased incidence (+8.2%) and aging populations (+21.1%). The most significant contributors to this increase were increasing O3 levels (+58.3%) and a combination of increased incidence (+11.0%), and population aging (+27.0%). Decomposition findings of all three pollutants are shown in Supplementary Tables S4–S6. Since the chemical interaction between PM2.5 and O3 exists because of common precursors (Nox [nitrogen oxides] and VOCs [volatile organic compounds])[10] and single-pollutant regulation might produce limited efficacy, it is implied that future regulations would be moving toward a combined approach to reducing these interrelated pollutants. There was also a considerable degree of heterogeneity in the results of the decomposition analysis, depending on whether the cities were divided into northern or southern regions (Supplementary Figure S13).
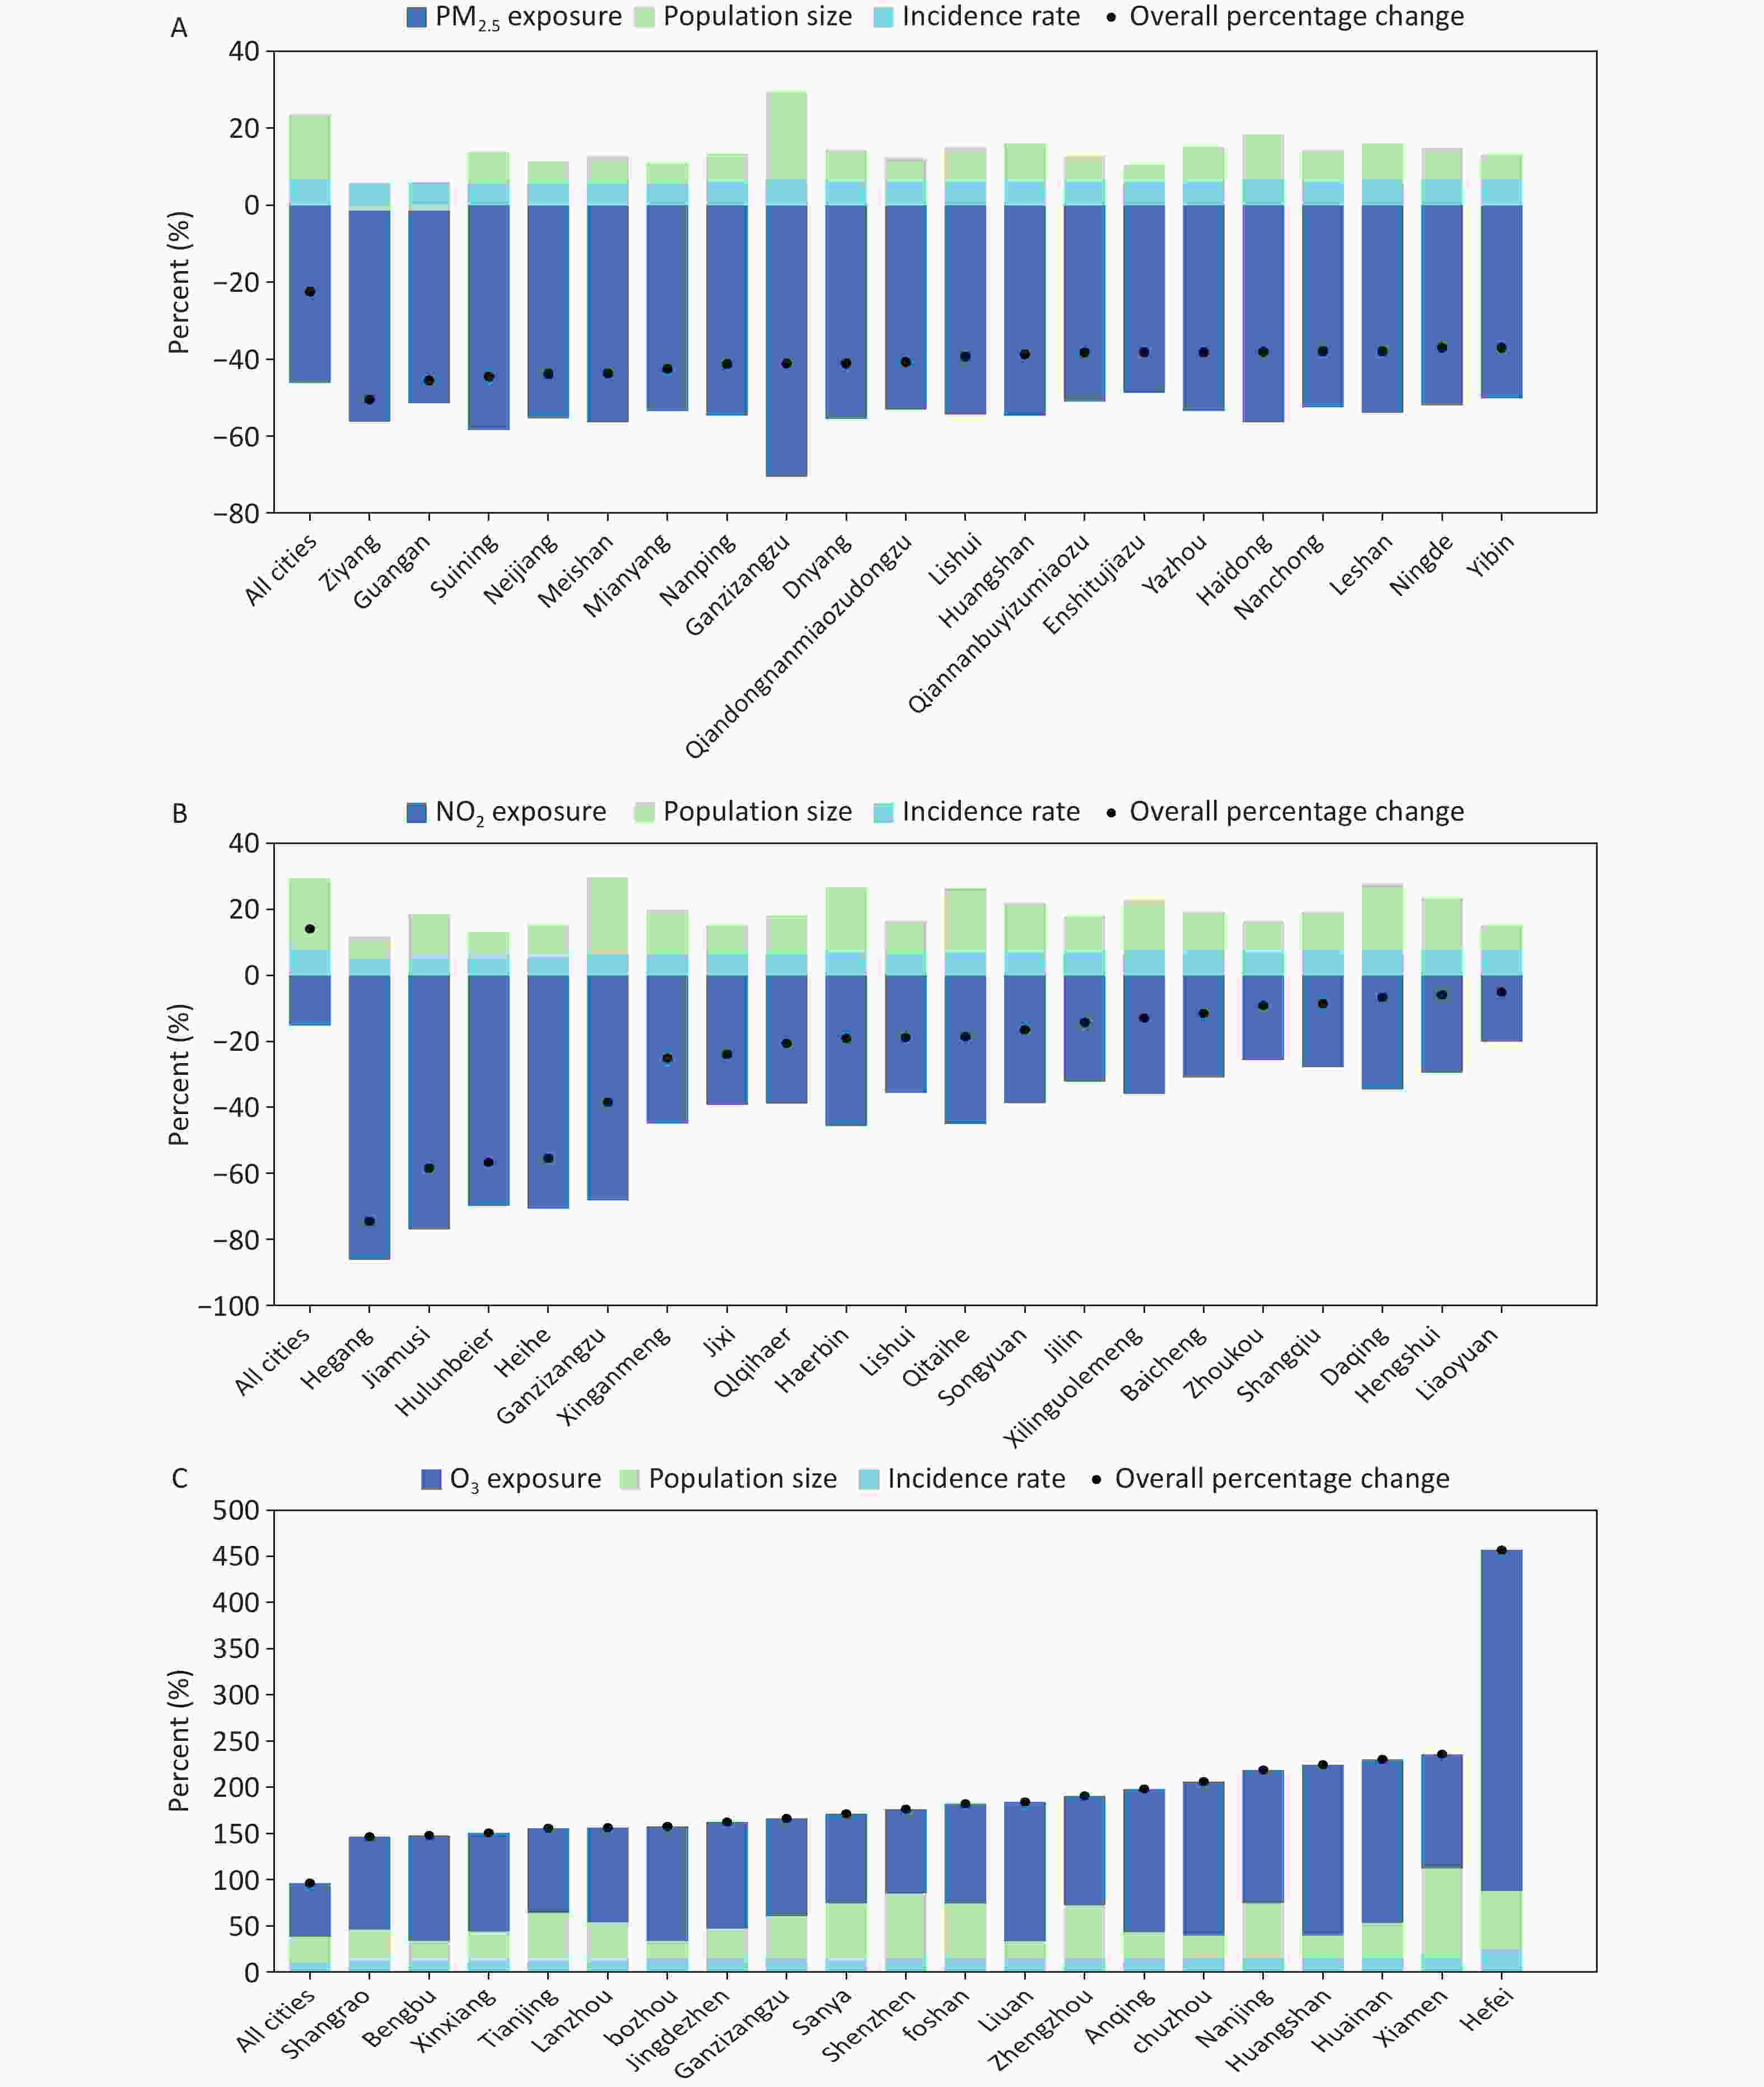
Figure 3. Decomposition of the net percentage change in city-level incident CVD cases attributable to PM2.5 (A), NO2 (B), and O3 (C) from 2013 to 2019, showing the independent contributions of changes in pollutant concentration, population aging, and baseline CVD incidence rate. The overall decline in PM2.5-attributable burden (-22.4%) was driven by reduced concentrations (-46.1%), whereas the surge in O3-attributable burden (+96.3%) was primarily due to increased O3 concentrations (+58.3%). CVD, cardiovascular disease; PM2.5, fine particulate matter; NO2, nitrogen dioxide; O3, ozone.
This study has several limitations. Initially, exposure was measured at the city average using residential addresses, which may not reflect within-city space variability or individual movement behavior; the absence of indoor and transportation time information may result in exposure misclassification. Second, the CVD results were based on self-reports instead of verification through hospital records; hence, they are prone to recall bias. Third, we considered annual average pollutant concentrations, which do not account for within-year seasonal variations (e.g., O3 peak in summer, PM2.5 in winter). Because CVD incidences also show seasonality, residual confounding can occur, but the direction of the bias is unknown and may vary across pollutants. As our main interest was long-term chronic effects, we believe that this weakness will not threaten our overall conclusions. Fourth, even though the covariate adjustment was performed following a DAG, unobserved confounding caused by unmeasured factors (e.g., traffic noise and dietary practices) and possible misspecification of the causal framework cannot be completely ruled out. Fifth, although sensitivity analysis was performed with lagged exposure, reverse causation could not be completely eliminated.
In summary, this study offers strong information in light of the multi-pollution approach that long-term exposure to PM2.5, O3, and NO2 is a major modifiable risk factor for CVD in China. Our first high-resolution city-level disease burden and inequality map measured the independent effects of pollution, population aging, and incidence changes. These results highlight the need to act quickly and specifically on increasing levels of O3 pollution and continuing health disparities, as well as to further intensify control of PM2.5. It is necessary to ensure that every citizen has a fair chance of living in a healthy environment as China moves toward its goals of Healthy China 2030 and Common Prosperity.
HTML
Competing Interests The authors declare that they have no known competing financial interests or personal relationships that could have appeared to influence the work reported in this paper.
Authors’ Contributions Data curation, formal analysis, and writing of the original draft: Xunrong Cheng. Formal analysis and visualization: Jiyan Xu. Data curation and visualization: Jiayuan Yang. Formal analysis: Xin Yu. Investigation: Yanhong Fang. Methodology: Chuan Li. Project administration: Zhiyuan Tang. Resources: Shaoqi Wang. Software: Rong Song. Supervision: Rubing Pan and Hong Su. Validation: Weizhuo Yi. Conceptualization, funding acquisition, writing, reviewing, and editing: Jian Song.
Data Sharing The supplementary materials will be available in www.besjournal.com.
&These authors contributed equally to this work.
Reference

 Quick Links

 DownLoad: