




-
Hypertension remains a major public health challenge and an important risk factor for cardiovascular diseases. Increasing evidence indicates that short-term exposure to ambient fine particulate matter (PM2.5) is associated with elevated blood pressure levels[1]. PM2.5 is a complex mixture of multiple chemical components. A previous longitudinal study in hypertensive adults reported component-specific associations with blood pressure[2]. This heterogeneity is relevant because different PM2.5 components may reflect distinct sources and physicochemical properties, and hypertensive adults may have limited cardiovascular reserves and greater vulnerability to transient environmental stressors. Particulate pollution can affect cardiovascular regulation through interconnected pathways involving inflammation, oxidative stress, autonomic imbalance, and endothelial dysfunction[3]. Lifestyle-related factors, including adiposity, smoking, alcohol consumption, and dietary behavior, may further influence these pathways or the baseline susceptibility of exposed individuals[4-6]. However, whether these factors modify the association between short-term exposure to PM2.5 and its components and blood pressure in adults with hypertension remains unclear. Identifying lifestyle-defined subgroups with larger pollution-related blood pressure responses may help characterize susceptibility and inform targeted prevention among hypertensive adults. Therefore, we investigated whether lifestyle-related factors modify these associations in a Jinchang Cohort.
We analyzed 8,748 hypertensive adults from the Jinchang Cohort, including 6,847 participants with hypertension at baseline and 1,901 identified during follow-up[7]. In this cohort, hypertension was defined as a systolic blood pressure (SBP) ≥ 140 mmHg and/or diastolic blood pressure (DBP) ≥ 90 mmHg on three separate visits in participants not receiving antihypertensive medication or by a verified previous diagnosis of hypertension. After a 30-min seated rest, SBP and DBP were measured twice using an electronic sphygmomanometer (BP705, AMPall Co., Ltd., Seoul, Republic of Korea), and the mean of the two readings was used. Participants with elevated blood pressure underwent repeat measurements using a mercury sphygmomanometer. Daily concentrations of PM2.5 and five major chemical components (sulfate, nitrate, ammonium, black carbon, and organic matter) during 2011–2015 were obtained from the Tracking Air Pollution in China (TAP) dataset[8,9] .Residential addresses were matched to the nearest 10-km grid, and the same TAP framework was used for the PM2.5 mass and its components to maintain consistency in the data source and spatial resolution. Linear mixed-effects models with random intercepts for the participants and examination occasions were used to account for repeated measurements. Short-term exposure was evaluated across single-day and moving-average lag windows, and pollutant–outcome-specific lag windows identified in the single-pollutant analyses were carried forward to the subsequent interaction and stratified analyses. Models were adjusted for demographic, lifestyle, meteorological, and hypertension-related covariates, and for each interaction model, the main effect of the corresponding lifestyle factor was retained among the model covariates. Multiplicative pollutant × lifestyle factor terms were used to evaluate effect modification. The interaction coefficient represents how the pollutant–blood pressure association varies according to the corresponding lifestyle factor, whereas subgroup-specific $ \beta $ coefficients represent the change in blood pressure per interquartile range (IQR) increase in pollutant concentration. Longitudinal lifestyle pattern analyses were performed using lifestyle status at baseline and follow-up. Between-group differences in the stratified effect estimates were evaluated using a Z-test, with |Z| > 1.96, indicating statistical significance at a two-sided level of 0.05. Participant characteristics, pollutant distributions, complete interaction results, longitudinal-pattern results, and definitions of the lifestyle-pattern groups are provided in Supplementary Tables S1–S9.
The characteristics of participants with hypertension at baseline are presented in Supplementary Table S1, and the distributions of PM2.5 and its components are presented in Supplementary Table S2. The most consistent modification patterns were observed for body mass index (BMI), smoking, alcohol consumption, and fruit intake (Table 1), while complete interaction results for all prespecified lifestyle factors are provided in Supplementary Tables S3–S5. In these models, the interaction coefficient reflected how the pollutant–blood pressure association differed according to the corresponding lifestyle factor; the stratified analyses were therefore used to clarify the direction and magnitude of these differences within specific subgroups. Interaction and stratified analyses were interpreted to characterize both the statistical evidence for effect modification and the magnitude and direction of pollutant associations within the lifestyle-defined subgroups.
Lifestyle factor Outcome PM2.5 SO42- NO3- NH4+ BC OM BMI SBP 0.14 (0.00, 0.28) 0.13 (−0.04, 0.31) 0.14 (0.01, 0.27) 0.12 (−0.02, 0.27) 0.08 (−0.04, 0.20) 0.09 (0.01, 0.18) DBP 0.13 (0.03, 0.23) 0.16 (0.06, 0.27) 0.16 (0.06, 0.25) 0.15 (0.06, 0.25) 0.11 (0.01, 0.22) 0.11 (0.05, 0.17) MAP 0.13 (0.04, 0.23) 0.15 (0.03, 0.27) 0.15 (0.05, 0.24) 0.14 (0.05, 0.23) 0.09 (−0.01, 0.20) 0.10 (0.05, 0.16) Smoking SBP 0.44 (−0.25, 1.14) 0.80 (0.00, 1.60) 0.79 (0.17, 1.41) 0.70 (0.01, 1.39) 0.59 (−0.32, 1.49) 0.50 (0.04, 0.96) DBP 0.39 (−0.03, 0.80) 0.68 (0.14, 1.23) 0.49 (0.06, 0.93) 0.52 (0.12, 0.91) 0.64 (0.02, 1.25) 0.30 (0.01, 0.59) MAP 0.40 (0.00, 0.80) 0.70 (0.16, 1.25) 0.59 (0.16, 1.01) 0.55 (0.10, 1.01) 0.60 (0.00, 1.19) 0.36 (0.05, 0.68) Alcohol consumption SBP 0.64 (0.00, 1.29) 1.00 (0.13, 1.88) 0.95 (0.27, 1.63) 0.94 (0.21, 1.68) 0.53 (−0.32, 1.37) 0.55 (0.08, 1.02) DBP 0.69 (0.21, 1.16) 0.81 (0.15, 1.46) 0.56 (0.08, 1.04) 0.65 (0.10, 1.19) 0.50 (0.03, 0.97) 0.43 (0.10, 0.76) MAP 0.67 (0.21, 1.13) 0.84 (0.21, 1.48) 0.68 (0.22, 1.15) 0.72 (0.25, 1.20) 0.47 (0.02, 0.92) 0.47 (0.15, 0.79) Fruit intake SBP 0.08 (−0.69, 0.86) 0.00 (−0.72, 0.72) −0.01 (−0.81, 0.79) 0.04 (−0.68, 0.77) 0.05 (−0.69, 0.78) 0.18 (−0.29, 0.64) DBP −0.77 (−1.43, −0.12) −1.03 (−1.82, −0.24) −0.69 (−1.34, −0.04) −0.82 (−1.47, −0.17) −0.94 (−1.82, −0.06) −0.51 (−0.95, −0.07) MAP −0.67 (−1.32, −0.02) −0.89 (−1.66, −0.13) −0.61 (−1.21, 0.00) −0.71 (−1.30, −0.13) −0.14 (−0.65, 0.36) −0.09 (−0.42, 0.24) Note. Values are coefficients of the pollutant × lifestyle-factor interaction term (β, 95% CI), mmHg. PM2.5, fine particulate matter ≤ 2.5 μm; SO42-, sulfate; NO3-, nitrate; NH4+, ammonium; BC, black carbon; OM, organic matter; BMI, body mass index; SBP, systolic blood pressure; DBP, diastolic blood pressure; MAP, mean arterial pressure. Bold values indicate P < 0.05. Table 1. Modification of associations between PM2.5 and its components and blood pressure by lifestyle factors among hypertensive adults
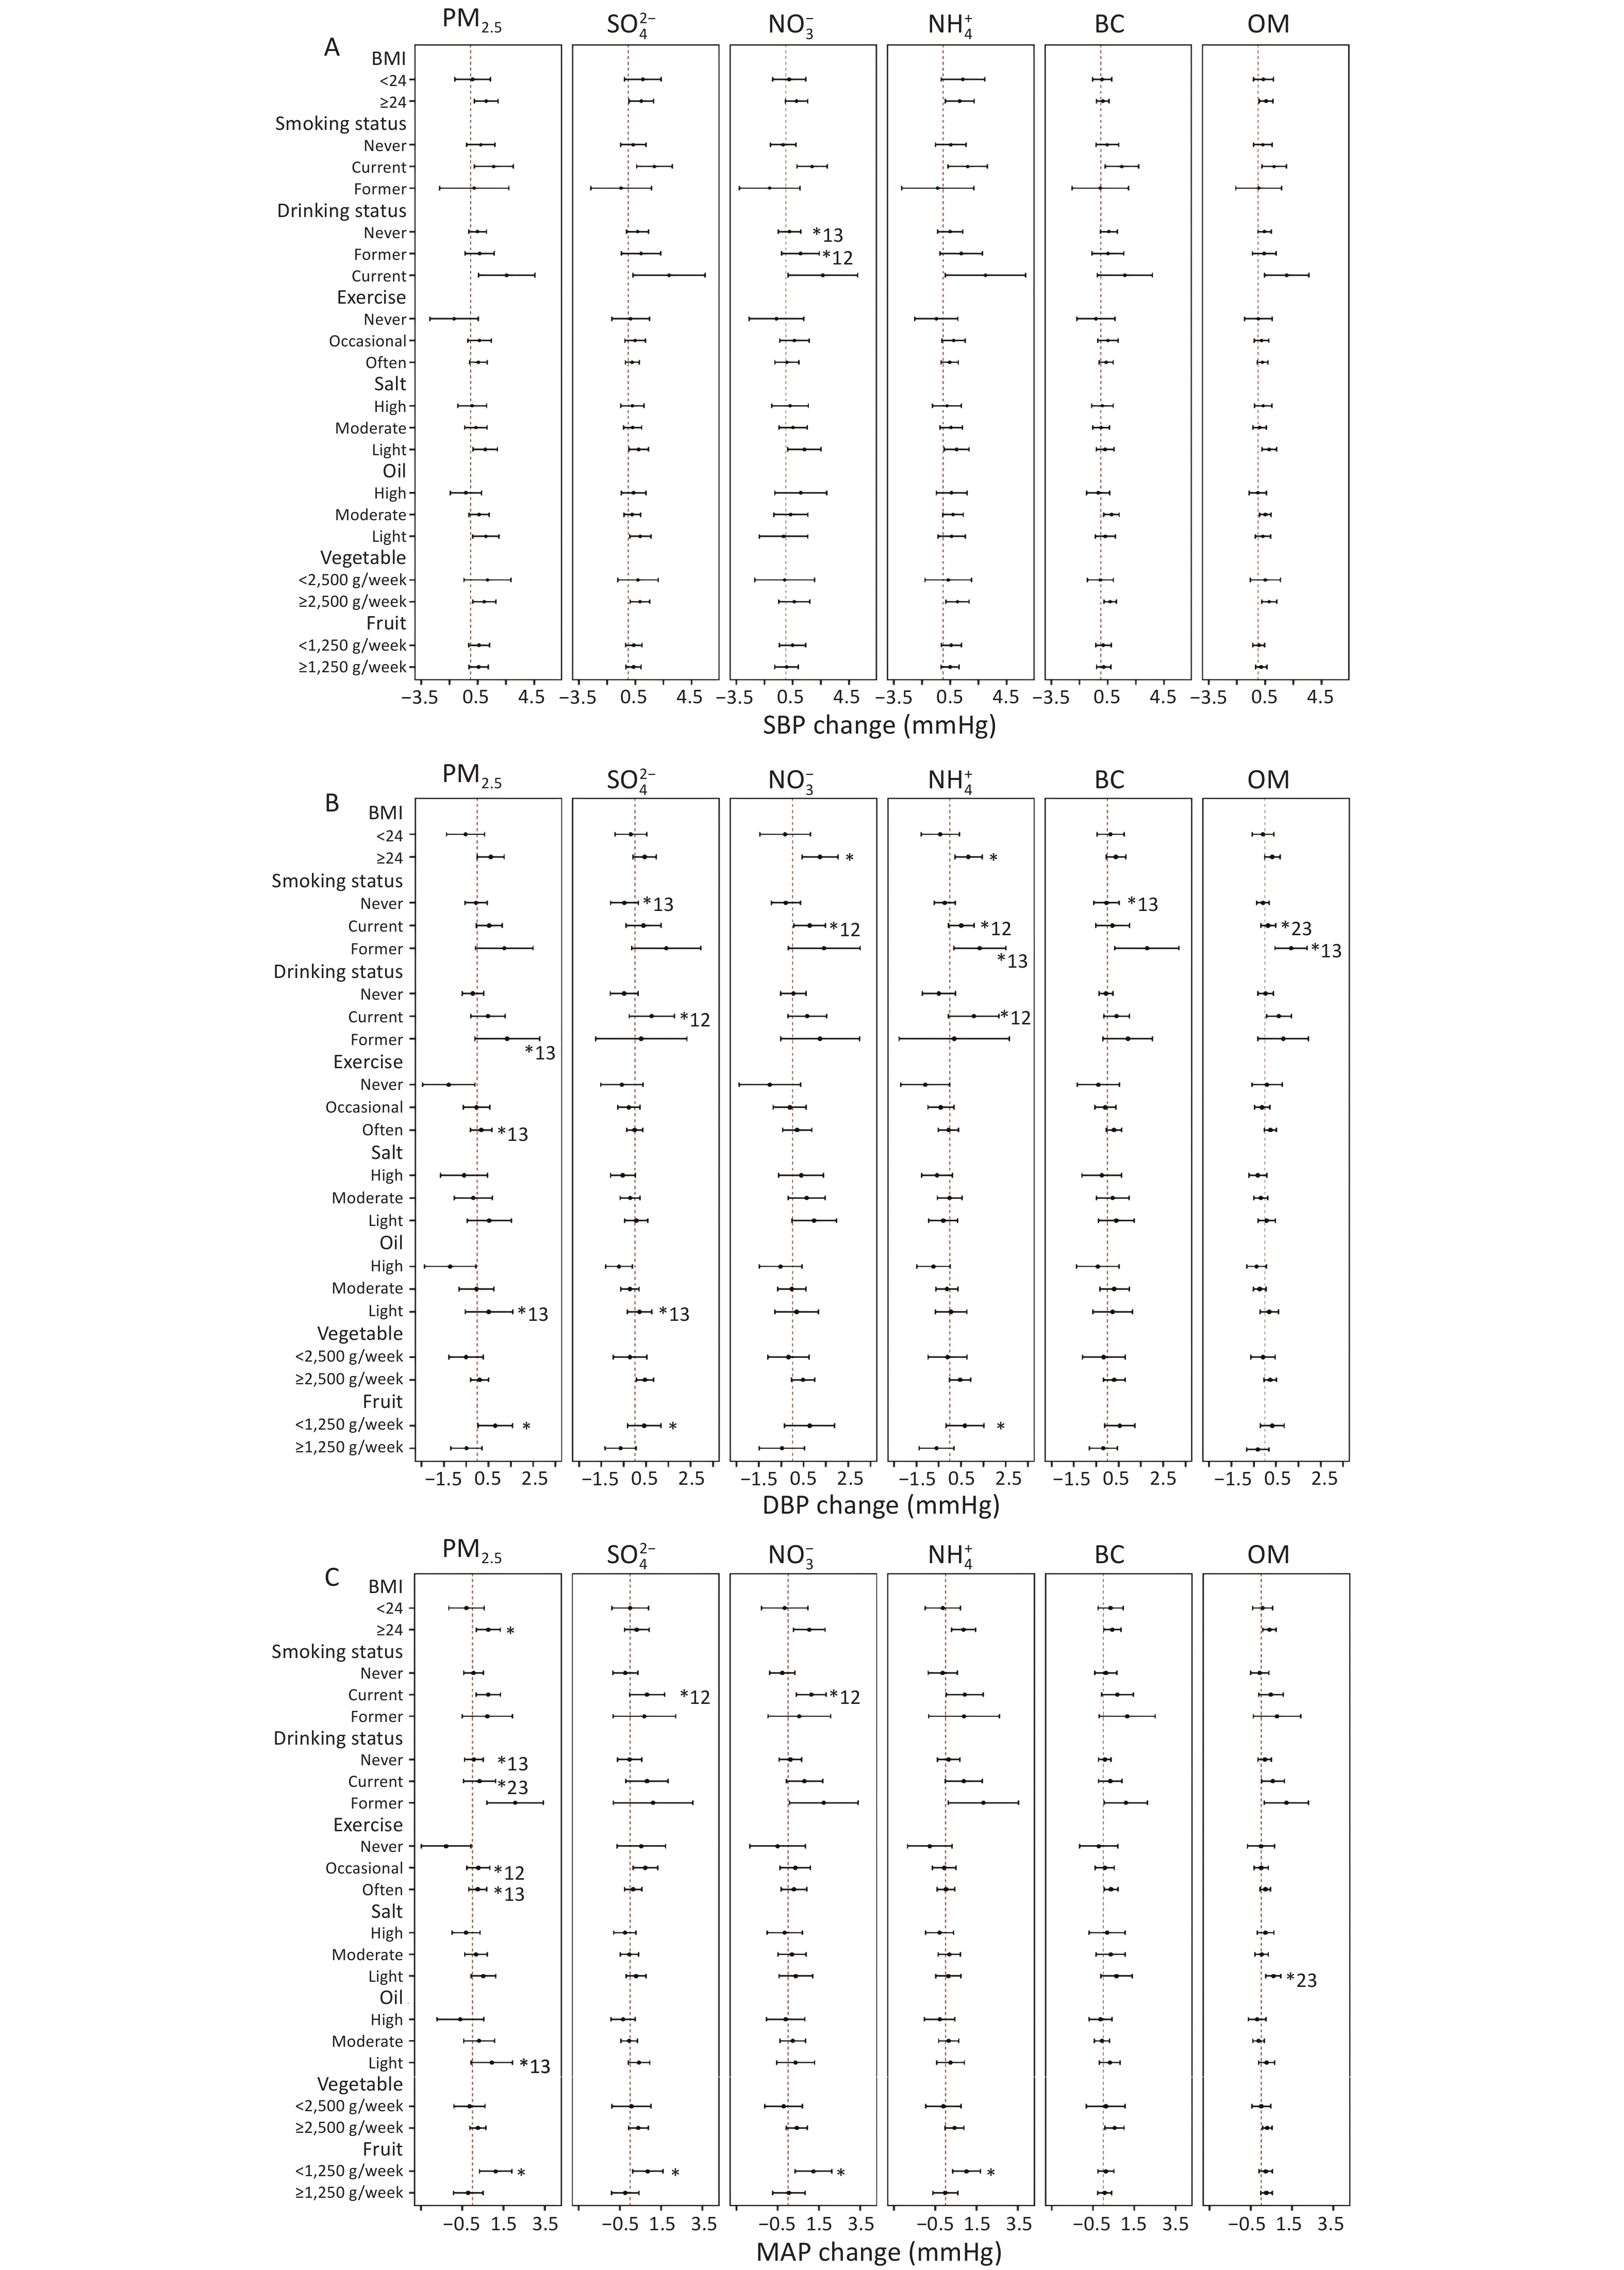
BMI showed the most consistent effect. For DBP, significant positive interactions were observed for PM2.5 and all five components, with interaction coefficients ranging from 0.11 to 0.16 mmHg (Table 1). The stratified analyses supported this pattern; the associations of nitrate (NO3-) and ammonium (NH4+) with DBP were stronger among participants with a BMI ≥ 24 kg/m2 than among those with a BMI < 24 kg/m2, and each IQR increase in PM2.5 was associated with a 0.77 mmHg increase in mean arterial pressure (MAP) (95% CI: 0.19–1.34) in the higher-BMI group (Figure 1). A large study of long-term air pollution exposure in a rural Chinese cohort similarly found that obesity amplified the association of air pollutants with blood pressure and hypertension[5]. Excess adiposity is accompanied by chronic low-grade inflammation, metabolic dysfunction, and impaired vascular regulation, whereas particulate pollution promotes systemic inflammation, oxidative stress, autonomic imbalance, and endothelial dysfunction[3]. The coexistence of these processes provides a plausible basis for greater pollution-related blood pressure responses among participants with higher BMI. Taken together, the interaction and stratified findings consistently indicated greater pollution-related blood pressure responses among participants with a higher BMI. Although BMI does not capture all dimensions of adiposity and metabolic status, it is a readily available clinical metric that may help identify heterogeneity in the susceptibility to short-term particulate pollution among hypertensive adults.
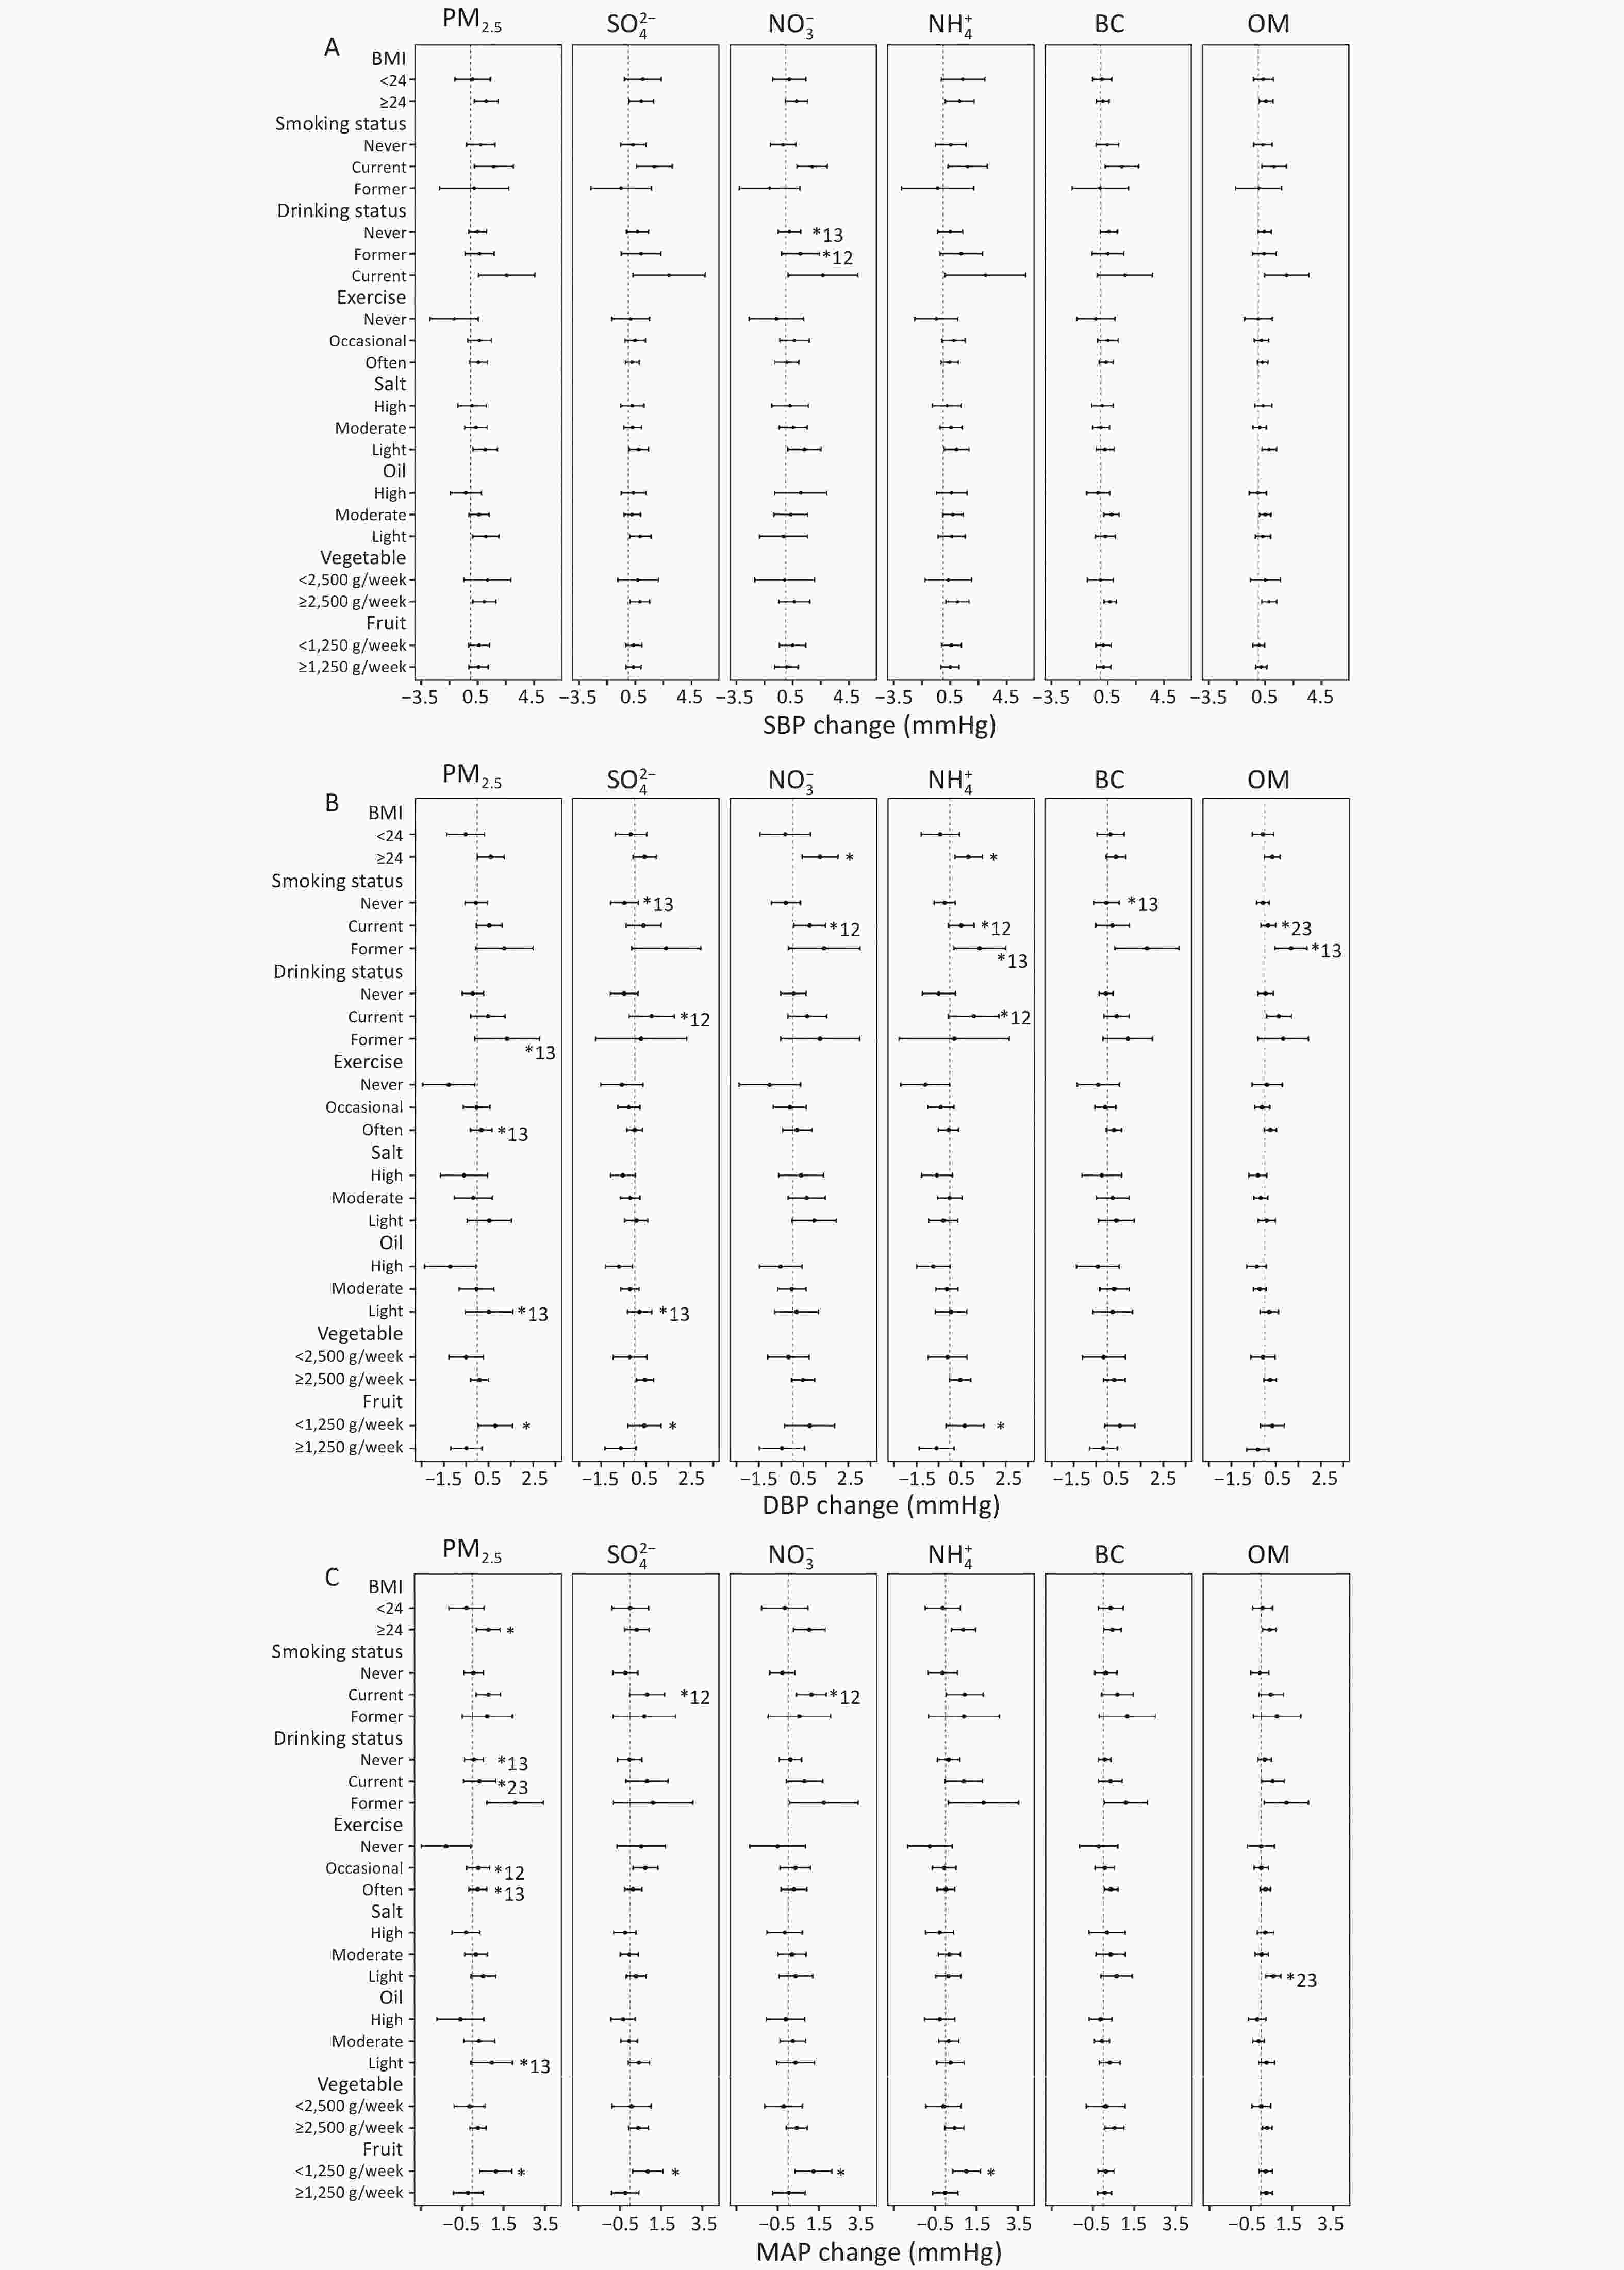
Figure 1. Stratified associations of PM2.5 and its components with blood pressure according to lifestyle-related factors. (A) Systolic blood pressure (SBP); (B) diastolic blood pressure (DBP); (C) mean arterial pressure (MAP). Values are β coefficients (95% CI), expressed as changes in blood pressure (mmHg) per interquartile-range (IQR) increase in pollutant concentration. * indicates a statistically significant between-group difference (P < 0.05); 12, 13, and 23 indicate significant pairwise differences between subgroups 1–2, 1–3, and 2–3, respectively. PM2.5, fine particulate matter ≤ 2.5 μm; SO42-, sulfate; NO3-, nitrate; NH4+, ammonium; BC, black carbon; OM, organic matter; BMI, body mass index; CI, confidence interval; IQR, interquartile range. Subgroup numbers correspond to the order in which categories are displayed from top to bottom within each lifestyle factor.
Smoking and alcohol consumption also modified several pollutant–blood pressure associations. For DBP, significant interaction coefficients for smoking ranged from 0.30 to 0.68 mmHg across several PM2.5 components, while alcohol consumption showed positive interaction coefficients across multiple pollutants and blood pressure outcomes (Table 1). In the stratified analyses, NO3- was more strongly associated with DBP in current smokers, whereas NH4+, black carbon (BC), and organic matter (OM) showed stronger associations in former smokers. Among current smokers, each IQR increase in NO3- and NH4+ was associated with MAP increases of 1.13 mmHg (95% CI: 0.41–1.86) and 0.92 mmHg (95% CI: 0.03–1.82), respectively. Similarly, a previous population study on long-term air pollution exposure reported stronger blood pressure associations among smokers and drinkers[6]. The effects of smoking and particulate pollution may occur through overlapping pathways involving oxidative stress, inflammation, autonomic imbalance, and endothelial dysfunction[3], which can increase vascular responsiveness to short-term pollution exposure. For alcohol consumption, the interaction coefficients were generally positive; however, the subgroup-specific pattern was not uniform across pollutants or drinking categories. Alcohol can influence blood pressure regulation and cardiovascular function via several dose- and pattern-dependent pathways[10]. Collectively, these findings suggest that smoking and drinking status may contribute to differential cardiovascular responses to short-term particulate pollution, although the magnitude of modification varies across pollutants and blood pressure outcomes.
Fruit intake showed contrasting patterns. Significant negative interaction coefficients were observed for DBP for PM2.5 and all five components, ranging from −1.03 to −0.51 mmHg, with similar inverse modification for several pollutants in relation to MAP (Table 1). Consistently, the longitudinal analyses showed larger pollutant-related blood pressure responses among participants with persistently low fruit intake. For example, among those with persistently low fruit intake, each IQR increase in PM2.5 and NH4+ was associated with DBP increases of 1.45 mmHg (95% CI: 0.36–2.54) and 1.62 mmHg (95% CI: 0.25–2.98), respectively (Supplementary Table S7). Additionally, among participants with persistently low fruit intake, IQR increases in sulfate, nitrate, and ammonium were associated with MAP increases of 1.41 mmHg (95% CI: 0.27–2.55), 2.79 mmHg (95% CI: 0.98–4.59), and 2.07 mmHg (95% CI: 0.66–3.49), respectively (Supplementary Table S8). A Chinese study found that healthier dietary patterns, including high consumption of fruits and other antioxidant-rich foods attenuated the association between long-term particulate matter exposure and elevated blood pressure[4]. The agreement between the interaction findings and the longitudinal low-fruit intake pattern strengthens the interpretation that diet may contribute to heterogeneity in pollution-related blood pressure responses. The consistency between the interaction results and the longitudinal low-fruit intake pattern supports the potential role of dietary behavior in modifying pollution-related blood pressure responses. As fruit intake was assessed using weekly intake categories, future studies incorporating more detailed dietary and nutritional measurements could further clarify the underlying pathways.
Additional stratified analyses showed significant between-group differences for several pollutant-lifestyle combinations (Figure 1). For SBP, the association with NO3- was stronger among former drinkers than among never-drinkers. For DBP, stronger associations were observed for NO3- and NH4+ among participants with a BMI ≥ 24 kg/m2, whereas stronger associations with several PM2.5 components were observed among current or former smokers. These subgroup-specific estimates complement the multiplicative interaction analyses by showing where the observed heterogeneity occurred, while Figure 1 presents the complete set of stratified results. Notably, the direction of modification was not identical for every pollutant or blood pressure outcome, emphasizing that the findings are more appropriately interpreted as a pattern of heterogeneous susceptibility than as a uniform lifestyle effect across all PM2.5 components.
Longitudinal lifestyle pattern analyses broadly reinforced these cross-sectional effect-modification patterns. Participants who smoked showed increases in SBP of 2.78 mmHg (95% CI: 0.51–5.05) and 1.46 mmHg (95% CI: 0.11–2.81) per IQR increase in PM2.5 and OM, respectively, and positive pollutant–SBP associations were also observed among participants with habitual alcohol consumption (Supplementary Tables S6–S8). Lifestyle status at both baseline and follow-up provides information beyond a single measurement, because habitual behaviors and behavioral transitions may reflect different periods of susceptibility. Therefore, longitudinal pattern analyses provide complementary evidence to the interaction and stratified analyses by showing that persistent lifestyle characteristics and behavioral transitions are accompanied by different pollution-related blood pressure responses. Together, these three analytical approaches suggest that susceptibility to short-term particulate pollution may vary according to current lifestyle characteristics and longitudinal patterns.
This study has several strengths, including repeated blood pressure measurements in a well-established cohort, simultaneous evaluation of PM2.5 and multiple chemical components, and assessment of effect modification using interaction models, stratified analyses, and longitudinal lifestyle patterns. The use of a common TAP framework for PM2.5 mass and chemical components also reduced the heterogeneity in exposure data sources and spatial resolution across the evaluated pollutants. This study also has several limitations that should be considered. Exposure estimates were assigned according to residential location and, therefore, may not fully reflect individual time–activity patterns or personal exposure. Detailed information on antihypertensive medication use was unavailable, and the metal components of PM2.5 were not included in the TAP component dataset used in this analysis. In addition, the evaluation of multiple exposure windows and lifestyle interactions requires a cautious interpretation of isolated subgroup findings. Nevertheless, the broadly consistent patterns observed across the interaction, stratified, and longitudinal analyses strengthened the evidence for heterogeneity in pollution-related blood pressure responses. Even modest short-term blood pressure changes may be relevant when exposure is widespread and recurrent. More importantly, the observed between-subgroup differences helped identify characteristics associated with greater physiological responsiveness to particulate pollution.
Overall, the consistency across interaction, stratified, and longitudinal pattern analyses indicated that BMI, smoking, alcohol consumption, and fruit intake contributed to the heterogeneity in pollution-related blood pressure responses among hypertensive adults. These readily identifiable lifestyle characteristics may help characterize subgroups with greater short-term cardiovascular responsiveness to PM2.5 and its components. These findings support the integration of individual susceptibility with environmental exposure assessments when refining risk communication and targeted prevention strategies for hypertensive populations. This integrated environmental and lifestyle perspective may be particularly relevant for identifying hypertensive populations that warrant greater attention during periods of elevated particulate pollution. Further studies in independent populations with more detailed personal exposure and repeated lifestyle information would be valuable to extend these findings.
HTML
Competing Interests The authors declare no competing interests.
Ethics This study was approved by the Ethics Committee of the School of Public Health at Lanzhou University (No. 2015-01). All the participants provided written informed consent.
Authors’ Contributions Methodology and investigation: Yan Sun and Rui Wang; supervision and project administration: Yana Bai and Minzhen Wang; conceptualization, methodology, supervision, validation, and writing—review and editing: Shan Zheng; methodology, software, formal analysis, and writing—original draft: Xiuqian Li; methodology, formal analysis, and writing—original draft: Beibei Wang. All the authors have read and approved the final version of the manuscript.
Data Sharing Data are available from the corresponding author upon reasonable request. The supplementary materials will be available in www.besjournal.com.
&These authors contributed equally to this work.
Reference

 Quick Links

 DownLoad: