

 下载:
下载:

-
Body composition information, including the percentage of body fat (%BF) and fat free mass (FMM), is widely used to evaluate the nutrition condition and the risk factors related to obesity. In the last decades, with the rapidly rising prevalence of obesity worldwide, there is a more and more urgent need for a simple and rapid method to assess accurately the body composition for population with obese.
Several technologies have been developed to measure the body composition information, such as the underwater weighting method[1] and the dual-energy X-ray absorptiometry (DXA). The DXA was a new developed reference method to measure the body composition[2]. However, due to the inaccessibility and the high cost of the equipment, DXA was hardly used in the large epidemiological survey. Thus, general methods such as the bioelectrical impedance analysis (BIA) were still the most common methods in epidemiological studies[3-4]. Since the BIA was firstly validated a commercially available by Lukaski, et al.[5], it has been widely used in the clinical practices, epidemiological surveys, and sports medicine. However, studies found that the accuracy were good for non-obese individuals, but not for obese individuals[6-7].
Due to the BIA manufacturers often based on the population with certain race and nutrition condition to establish the prediction equations, which might not apply to all individuals, such as individuals with obese. However, the BIA was more commonly applied in individuals with overweight or obese than that with normal weight to measure body fat percentage. Several studies have found that the MF-BIA significantly underestimated %BF of obese adults[6], but the sample sizes of these studies were very limited. Thus, whether the MF-BIA could accurately predict the body composition in Chinese adults with obese was still unclear. Therefore, we performed the parallel measurements of body composition (including %BF and FFM) by the MF-BIA and DXA in adults with obese from Beijing, China, to evaluate the accuracy between the two methods and provide correction equations to more accurately measure the body composition in Chinese adults with obese by the MF-BIA.
-
A total of 749 participants were voluntarily recruited through recruitment poster from Beijing, China. According to the inclusion and exclusion criteria for participants in the study design, the participants aged 25-55 years who lived in Beijing for more than 1 year, with BMI ≥ 28.0 kg/m2, and without suffering from severe organic diseases were included in the current study. The medical ethical committee of Peking University approved the study (IRB00001052-13086) and all procedures were carried out with adequate understanding and written consent of all the participants.
-
All the measurements were performed after ≥ 8-h fasting. The TANITA MC-180 Body Composition Analyzer (TANITA, MC-180, Japan) was used to measure body composition, including the %BF and FFM. Participants were asked to stand on the Body Composition Analyzer with bare feet, remove all the accessories, and make sure there's no metal in the body. Body composition was measured by the prediction equations of manufacturer within the Analyzer. After assessed by the MF-BIA, the DXA method was also used to assess body composition within 2 hours. DXA measurements were conducted in the Institute of Sports Medicine, Peking University Third Hospital by professional technician using the General Electric Lunar Prodigy Scanner (GE Healthcare, Lunar iDXA ME+ 210205, USA) with standard model (The dose of X-ray was 0.4 LGy, and the supporting current was 0.15 A) in a supine position. All the metal objects must be removed from participants to ensure accuracy.
-
All the statistical analyses were performed by the SPSS 17.0 for Windows statistical package (SPSS, Chicago, IL). Independent sample t-test was used to compare the gender differences in age, height, weight, and body composition including %FM and FFM. Paired sample t-test was used to examine differences of body composition parameters between the MF-BIA and the DXA. The Lin's concordance correlation and Bland-Altman plot were used to test the accuracy between the two methods. To establish correction equations of the MF-BIA (TANITA, MC-180), we randomly divided all participants into two groups, the first group (n = 374) was used to establish correction equations using the simple linear regression model with gold standard of DXA, stratified by sex. The second group (n = 375) was used to evaluate the effect of the correction equations through the Lin's concordance correlation and paired sample t-test. A P < 0.05 for two-sided was considered statistically significant.
-
The results of consistency analysis between the MF-BIA and DXA for Chinese adults with obese were showed in Table 1. The average %BF measured by the MF-BIA was significantly lower (4.33%) than that measured by the DXA method among men (P < 0.001). However, it was significantly higher (0.50%) than the DXA among women (P < 0.001). The CCC between %BF measured by the MF-BIA and DXA for men and women were 0.560 and 0.669, respectively. The average of FFM (kg), measured by the MF-BIA, is significantly higher 3.8% than the DXA among men (P < 0.001), however it is significantly lower 5.1% than the DXA among women (P < 0.001). The CCC between the FFM measured by the MF-BIA and DXA among men and women were 0.866 and 0.632, respectively.
Table 1. The Results of %BF and Fat Free Mass in kg Predicted by the MF-BIA and DXA method before and after correction
Men (n = 178) Women (n = 196) MF-BIA DXA d ρc MF-BIA DXA d ρc Before correction %BF 31.75 ± 4.83 36.09 ± 4.41 -4.33 ± 2.88 0.560 44.50 ± 4.44 44.00 ± 3.38 0.50 ± 3.19 0.669 FFM 62.43 ± 6.08 60.16 ± 7.11 2.27 ± 3.57 0.866 42.11 ± 3.04 44.36 ± 4.83 -2.25 ± 2.96 0.632 After correction %BF 36.18 ± 3.25 36.10 ± 4.50 0.09 ± 2.62 0.780 44.13 ± 2.13 44.00 ± 3.30 0.09 ± 2.41 0.627 FFM 60.50 ± 6.02 60.50 ± 6.64 0.01 ± 2.67 0.911 43.05 ± 3.69 44.50 ± 4.73 -1.46 ± 2.58 0.770 Note.%BF, percentage of body fat; FFM, fat free mass; MF-BIA, multi-frequency bio-impedance; DXA, dual energy X-ray absorptiometry; d, mean difference of MF-BIA from DXA; ρc, concordance correlation coefficient. -
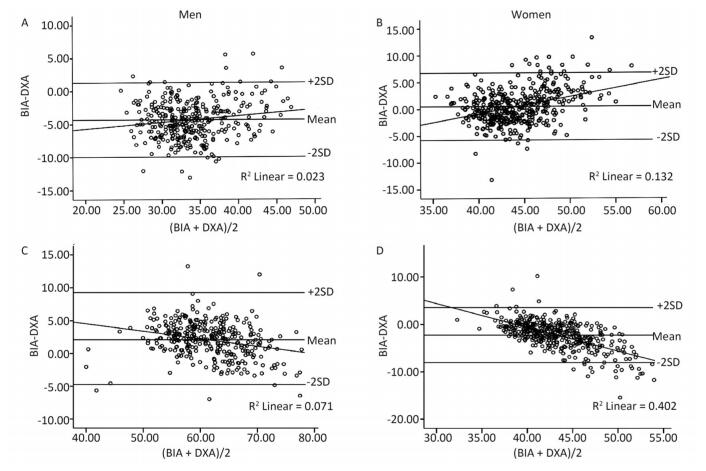
As shown in Figure 1. The mean %BF for men is 36.09% (Table 1), the 2SD (standard error) LOA (limit of agreement) is around 12% (Figure 1A), thus the LOA is around 38%. The mean %BF for women is 44.00% (Table 2), the 2SD LOA is around 13% (Figure 1B), and thus the LOA is around 30%. The mean FFM for men is 60.16 kg (Table 2), the 2SD LOA (Limit of Agreement) is about 14 kg (Figure 1C), and thus the LOA are around 23%. The mean FFM for women is 44.36 kg (Table 2), the 2SD LOA is about 10 kg (Figure 1D), and thus the LOA is around 23%. These results clearly showed that the agreement between the MF-BIA and DXA was poor in individuals with obese.

Figure 1. (A) Bland-Altman Plots analysis showing %BF difference between the MF-BIA and DXA among men. (B) Bland-Altman Plots analysis showing %BF difference between the MF-BIA and DXA among women. (C) Bland-Altman Plots analysis showing FFM in kg difference between the MF-BIA and DXA stratified among men. (D) Bland-Altman Plots analysis showing FFM in kg difference between the MF-BIA and DXA stratified among women.
Table 2. The Correction Equations of the MF-BIA with the DXA as Reference
Models B SE t P R2 Men Constant 14.098 1.258 %BF (MF-BIA) 0.694 0.039 17.68 < 0.001 0.640 Constant -3.263 2.085 FFM (MF-BIA) 1.019 0.033 30.597 < 0.001 0.842 Women Constant 21.214 1.630 %BF (MF-BIA) 0.513 0.037 14.036 < 0.001 0.504 Constant -8.595 3.049 FFM (MF-BIA) 1.255 0.072 17.361 < 0.001 0.606 Note.%BF, percentage of body fat; FFM, fat free mass; MF-BIA, multi-frequency bio-impedance; SE, standard error. -
To improve the accuracy of the MF-BIA, the correction equations were modeled by the sample linear regression model (the values of DXA were used as dependent variable, and the values of MF-BIA were used as independent variable), which were presented in Table 2. Men: %BF (DXA) = 14.098 + 0.694 × %BF (MF-BIA), R2 = 0.640; FFM (DXA) = -3.263 + 1.019 × FFM (MF-BIA), R2 = 0.842. Women: %BF (DXA) = 21.214 + 0.513 × %BF (MF-BIA), R2 = 0.504; FFM (DXA) = -8.595 + 1.255 × FFM (MF-BIA), R2 = 0.606.
-
As showed in Table 1. Significant lower differences than original differences were observed among all the correction equations (P < 0.001). These findings suggested that the correction equations established in the current study could more accurately estimate body composition in the Chinese adults with obese.
Body composition is widely used in clinics, weight-loss programs, and other health-related fields to evaluation of risk factors related to obesity, which is important for early detection of metabolic syndrome, type 2 diabetes and proposed monitoring could indicate early metabolic problems like elevated glycated hemoglobin (HbA1c), insulin resistance, sedentary lifestyle consequences etc.[3, 8]. Although the reference methods such as DXA can accurately measure body composition, these methods were too expensive to accessible to the public[1]. However, due to availability, the BIA was more often used to measure the body composition in many situations, such as large epidemiological survey, sports medicine. Good accuracy between the BIA and DXA has been observed among individuals with normal weight, but not among overweight and obese population[6, 8]. In this study, we found that correlations between the MF-BIA and DXA were generally good for measurements of body composition, but the LOA was wide (around 30%) for BF% and FFM both in men and women. Indicating that the agreement of body composition parameters was limited between the MF-BIA and DXA for Chinese adults with obese. After corrected by the correction equations established in this study, the differences were significantly lower than the raw differences between the MF-BIA and DXA indicating that the correction equations were valuable to more accurately predict the body composition among adults with obese. However, the validity of the present study may be limited to the Chinese adults with obese in scientific research settings.
In conclusion, the MF-BIA might need to be adjusted to more accurately measure the body composition of the Chinese adults with obese.
doi: 10.3967/bes2018.008
Comparative Analysis of the Multi-Frequency Bio-impedance and Dual-energy X-ray Absorptiometry on Body Composition in Obese Subjects
-
Abstract: To examine accuracy of body composition predicted by the Multi-Frequency Bioelectric Impedance Analysis (MF-BIA) compared with the Dual-energy X-ray Absorptiometry (DXA) in adults with obese. We measured body composition of 749 adults with obese both by the MF-BIA and DXA. The Lin's concordance correlation and the Bland-Altman plots were used to examine the consistency. The concordance correlation coefficient of %BF between the MF-BIA and DXA in men and women was 0.560, and 0.669, respectively. Compared with the DXA, the MF-BIA significantly underestimated %BF by 4.33% in men (P < 0.001), however overestimated %BF by 0.50% in women (P < 0.001). After corrected by the correction equations established in this study, the differences were significantly decreased. Therefore, the MF-BIA (TANITA MC-180) may need to be corrected in estimating body composition for adults with obese.
-
Figure 1. (A) Bland-Altman Plots analysis showing %BF difference between the MF-BIA and DXA among men. (B) Bland-Altman Plots analysis showing %BF difference between the MF-BIA and DXA among women. (C) Bland-Altman Plots analysis showing FFM in kg difference between the MF-BIA and DXA stratified among men. (D) Bland-Altman Plots analysis showing FFM in kg difference between the MF-BIA and DXA stratified among women.
Table 1. The Results of %BF and Fat Free Mass in kg Predicted by the MF-BIA and DXA method before and after correction
Men (n = 178) Women (n = 196) MF-BIA DXA d ρc MF-BIA DXA d ρc Before correction %BF 31.75 ± 4.83 36.09 ± 4.41 -4.33 ± 2.88 0.560 44.50 ± 4.44 44.00 ± 3.38 0.50 ± 3.19 0.669 FFM 62.43 ± 6.08 60.16 ± 7.11 2.27 ± 3.57 0.866 42.11 ± 3.04 44.36 ± 4.83 -2.25 ± 2.96 0.632 After correction %BF 36.18 ± 3.25 36.10 ± 4.50 0.09 ± 2.62 0.780 44.13 ± 2.13 44.00 ± 3.30 0.09 ± 2.41 0.627 FFM 60.50 ± 6.02 60.50 ± 6.64 0.01 ± 2.67 0.911 43.05 ± 3.69 44.50 ± 4.73 -1.46 ± 2.58 0.770 Note.%BF, percentage of body fat; FFM, fat free mass; MF-BIA, multi-frequency bio-impedance; DXA, dual energy X-ray absorptiometry; d, mean difference of MF-BIA from DXA; ρc, concordance correlation coefficient.  下载: 导出CSV
Table 2. The Correction Equations of the MF-BIA with the DXA as Reference
Models B SE t P R2 Men Constant 14.098 1.258 %BF (MF-BIA) 0.694 0.039 17.68 < 0.001 0.640 Constant -3.263 2.085 FFM (MF-BIA) 1.019 0.033 30.597 < 0.001 0.842 Women Constant 21.214 1.630 %BF (MF-BIA) 0.513 0.037 14.036 < 0.001 0.504 Constant -8.595 3.049 FFM (MF-BIA) 1.255 0.072 17.361 < 0.001 0.606 Note.%BF, percentage of body fat; FFM, fat free mass; MF-BIA, multi-frequency bio-impedance; SE, standard error.
下载: 导出CSV
-
[1] KATCH, Frank I. Practice curves and errors of measurement in estimating underwater weight by hydrostatic weighing. Medicine & Science in Sports & Exercise, 1969; 1. https://www.researchgate.net/publication/232177951_Practice_curves_and_error_of_measurement_in_estimating_underwater_weight_by_hydrostatic_weighing [2] Salamone LM, Fuerst T, Visser M, et al. Measurement of fat mass using DEXA:a validation study in elderly adults. J Appl Physiol, 2000; 89, 345-52. doi: 10.1152/jappl.2000.89.1.345 [3] Tinsley GM, Morales FE, Forsse JS, et al. Impact of Acute Dietary Manipulations on DXA and BIA Body Composition Estimates. Med Sci Sports Exerc, 2017; 49, 823-32. http://journals.lww.com/acsm-msse/Abstract/publishahead/Impact_of_Acute_Dietary_Manipulations_on_DXA_and.97343.aspx [4] Bryan CL, Solmon MA, Zanovec MT, et al. Body mass index and skinfold thickness measurements as body composition screening tools in Caucasian and African American youth. Res Q Exerc Sport, 2011; 82, 345-9. doi: 10.1080/02701367.2011.10599762 [5] Lukaski HC, Johnson PE, Bolonchuk WW, et al. Assessment of fat-free mass using bioelectrical impedance measurements of the human body. Am J Clin Nutr, 1985; 41, 810-7. doi: 10.1093/ajcn/41.4.810 [6] Li YC, Li CI, Lin WY, et al. Percentage of body fat assessment using bioelectrical impedance analysis and dual-energy X-ray absorptiometry in a weight loss program for obese or overweight Chinese adults. Plos One, 2013; 8, e58272. doi: 10.1371/journal.pone.0058272 [7] Sun G, French CR, Martin GR, et al. Comparison of multifrequency bioelectrical impedance analysis with dual-energy X-ray absorptiometry for assessment of percentage body fat in a large, healthy population. Am J Clin Nutr, 2005; 81, 74-8. https://www.researchgate.net/profile/Guang_Sun/publication/8091804_Comparison_of_multifrequency_bioelectrical_impedance_analysis_with_dual-energy_X-ray_absorptiometry_for_assessment_of_percentage_body_fat_in_a_large_healthy_population1-3/links/0046351bb3426e409b000000.pdf [8] Faria SL, Faria OP, Cardeal MD, et al. Validation study of multi-frequency bioelectrical impedance with dual-energy X-ray absorptiometry among obese patients. Obes Surg, 2014; 24, 1476-80. doi: 10.1007/s11695-014-1190-5 -

 点击查看大图
计量
- 文章访问数: 1691
- HTML全文浏览量: 199
- PDF下载量: 123
- 被引次数: 0

 Quick Links