

 下载:
下载:


-
Pneumoconiosis is a restrictive lung disease mostly caused by occupational exposure to dust, including silica dust, asbestos, and other fibers. Inhalable particles smaller than 10 μm can enter the bronchioles, injure lung cells, and induce lung fibrosis. This hard-to-cure disease places a substantial burden on patients and society[1]. Although preventive measures have been taken for years in occupational environments, pneumoconiosis is still one of the most important occupational diseases in the world. Relative to developed countries, low- and middle-income countries have a higher prevalence of pneumoconiosis[2]. China has a high prevalence of pneumoconiosis, which accounted for 90% of all occupational diseases reported[3]. Pneumoconiosis accounted for the largest proportion of all occupational diseases in Guangdong in 2011–2013[4]. In Guangdong, silicosis is the most prevalent type of pneumoconiosis, followed by welder’s pneumoconiosis, potter’s pneumoconiosis, and coal worker’s pneumoconiosis. However, little is known about the spatial and temporal variations in the occurrence of pneumoconiosis[3].
In this study, we firstly explored the tendency of pneumoconiosis incidence to change from 2006 to 2015 in the Pearl River Delta region and describe the spatial and temporal features of pneumoconiosis using a geographic information system (GIS), which can store, maintain, imitate, and analyze geographic information, and can further provide more insight into the spatial attributes of patients affected by a certain disease[5]. As pneumoconiosis is a rarely fatal but highly crippling disease, years lived with disability (YLD) represents the main part of the disability-adjusted life years (DALY) and was used in this study to evaluate the contributions of different districts/counties. This information may be beneficial in the occupational prevention of the disease and in establishing an administrative incident database.
The pneumoconiosis database covering the Pearl River Delta region for 2006–2015 was established using the China Disease Prevention and Control Information System, pneumoconiosis report card, and hospital medical records of pneumoconiosis in Guangdong Province. A total of 1,675 cases of new incidence pneumoconiosis during the studied period were identified in 53 counties/districts in the Pearl River Delta region, Guangdong; their spatial and temporal variations were analyzed using ArcGIS 10.2 software in this study. The case level of pneumoconiosis is classified using the Jenks natural breaks optimization, which has shown good adaptability and high accuracy for units of the geographical environment[6]. GIS was used to locate each case of pneumoconiosis, and the coordinates were derived to express the original residential location of each case in the format of latitude (denoted as X point east) and longitude (denoted as Y point north). With the number of cases in each node of the projected grid matrix represented by the Z axis, directional trend curves were produced using the ordinary least square (OLS) technique[7].
YLD was estimated using the methods used to capture the Global Burden of Disease (GBD)[8]. Default parameters were applied and disability weights were set according to the stage of pneumoconiosis (Supplementary Table S1 available in www.besjournal.com). The total YLD was based on the life expectancy and age at onset in each patient, and the average YLD was calculated by dividing the total YLD by the number of cases. Detailed methods of YLD estimation have been described in GBD studies[9].
Table S1. The disability weight of each gradation of pneumoconiosis-induced disability
Gradation of disability Disability weight Stage I pneumoconiosis 0.30 Stage I pneumoconiosis with tuberculosis or Stage II pneumoconiosis 0.55 Stage II pneumoconiosis with tuberculosis or Stage III pneumoconiosis 0.65 Stage III pneumoconiosis with tuberculosis 0.75 Finally, the general information in each category was analyzed using the chi-squared test. The average YLD of each category was analyzed using two-way ANOVA. A statistically significant difference was set at P < 0.05. For spatial statistical analysis, the Global Moran’s Index was applied to analyze whether an autocorrelation trend existed for pneumoconiosis[10], which reveals the aggregation of pneumoconiosis incidence.
General information regarding the 1,675 pneumoconiosis cases was analyzed and is presented in Supplementary Table S2 available in www.besjournal.com. The number of cases of pneumoconiosis rapidly increased during 2006–2015, except for a decrease in 2012. The distribution among age groups varied from 2006 to 2015. The percentage of 30–40-year-old workers with the disease decreased slightly from 2011, while the percentage in the 40–50 age group and 50–60 age group increased and reached a maximum in 2015. Private enterprise and manufacturing accounted for more than 65% of all cases. The differences in the proportion of cases among age groups, enterprise scales, enterprise economic types, and industries were statistically significant. Age groups, an ordered categorical dataset, correlated with the year and number of years worked (χ2 = 398.1 for age group and χ2 = 89.7 for working-year group). This relation was not a simple linear relation because the partial linear regression χ2 values were statistically significant as well.
Table S2. General information on pneumoconiosis occurrence in the Pearl River Delta region each year from 2006 to 2015
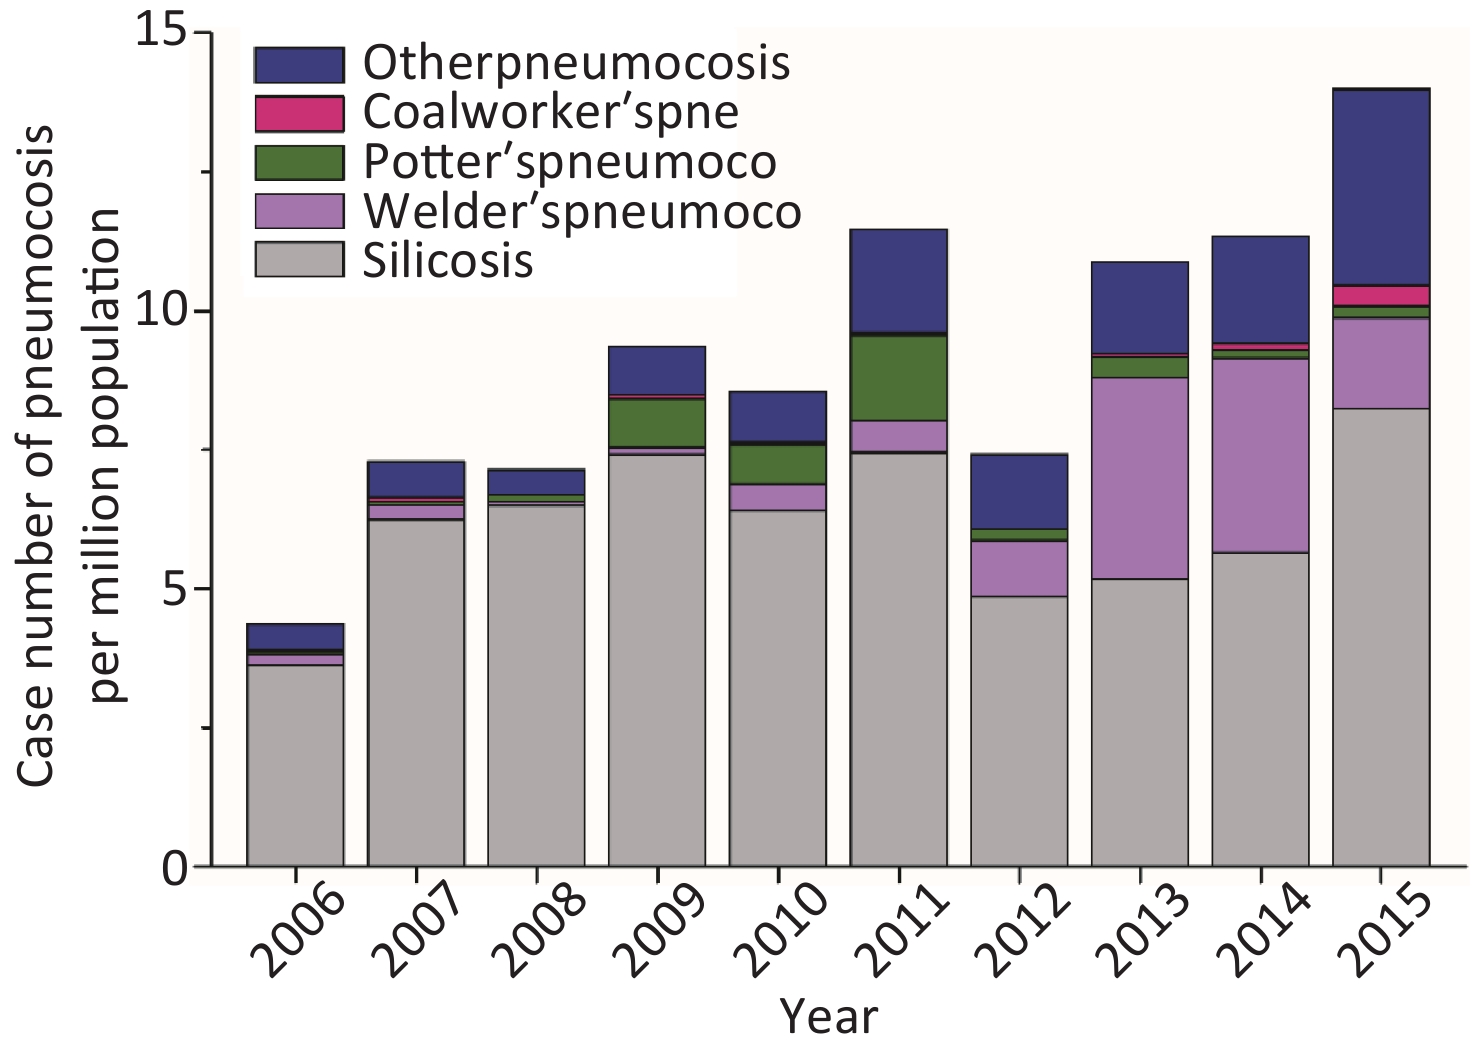
General information 2006 2007 2008 2009 2010 2011 2012 2013 2014 2015 Total χ2 P Gender Male 62 112 111 148 160 213 141 210 217 263 1,637 6.5 0.668 Female 4 2 1 3 5 7 2 5 4 5 38 Age 20–30 13 16 8 8 1 1 1 3 3 2 56 398.1 < 0.01* 30–40 29 63 61 52 67 62 40 51 41 29 495 40–50 20 31 32 75 77 134 85 116 130 132 832 50–60 2 1 10 15 17 17 14 43 43 91 253 ≥ 60 1 3 4 2 3 2 0 5 3 16 39 Working-year 0–5 13 28 21 26 32 41 29 36 31 60 317 89.7 < 0.01* 5–10 38 58 50 61 68 81 47 67 82 79 631 10–20 13 25 39 62 61 87 52 91 85 106 621 20–30 1 2 2 2 4 9 15 17 22 21 95 ≥ 30 1 1 0 0 0 2 0 4 1 2 11 Enterprise scale Large 9 26 48 14 11 36 17 67 26 31 285 207.8 < 0.01* Middle 19 23 10 37 40 60 43 72 91 135 530 Small 20 56 50 71 93 115 64 64 85 75 693 Miniature 0 0 0 0 0 0 0 0 1 3 4 Unknown 18 9 4 29 21 9 19 12 18 24 163 Enterprise economic type State-owned 4 4 3 12 8 3 3 44 15 26 122 234.1 < 0.01* Collective 14 3 3 4 9 9 0 11 6 17 76 Private 34 71 47 106 130 146 101 111 171 177 1,096 Foreign &HMT 14 36 59 29 18 62 39 47 29 48 381 Industry Electronics 2 1 0 0 2 0 3 5 4 3 20 544.3 < 0.01* Machinery 9 12 6 13 27 37 44 87 81 65 381 Building materials 22 17 14 49 65 87 31 57 85 127 554 Manufacturing 2 4 1 35 27 13 16 11 3 2 114 Mining 4 34 21 27 11 23 10 2 5 12 149 Others 21 20 18 15 23 30 24 29 25 20 225 Light 6 26 52 12 10 30 15 24 18 39 232 Note. HMT, Hong Kong, Macao, and Taiwan. *P value < 0.01. Pneumoconiosis was classified into five types in this study: silicosis (S), coal-worker’s pneumoconiosis (CWP), welder’s pneumoconiosis (WP), potter’s pneumoconiosis (PP), and other pneumoconiosis (OP). Silicosis accounted for a great proportion of the total pneumoconiosis incidence (47.55%–91.07%, Supplementary Figure S1 available in www.besjournal.com). Potter’s pneumoconiosis accounted for a high proportion–approximately 10%–in 2009–2011, whereas the rate of welder’s pneumoconiosis increased remarkably in 2012 and 2014 and accounted for a sizeable proportion of pneumoconiosis cases (13.67%–30.87%).
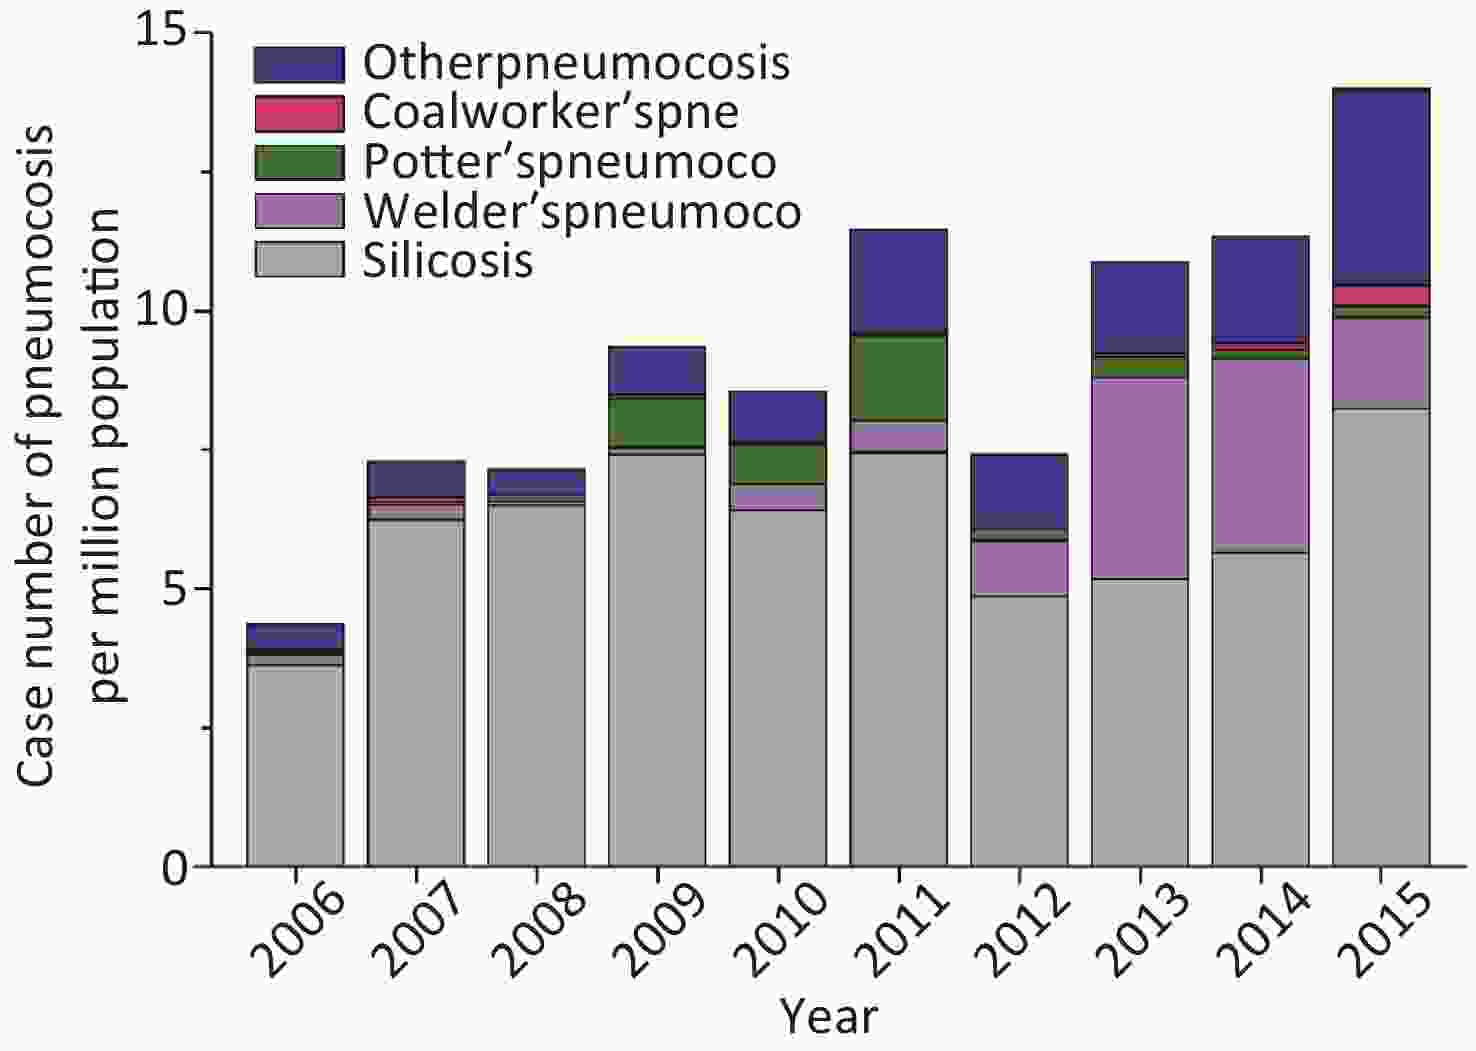
Figure S1. Number of cases of each pneumoconiosis type during 2006-2015.
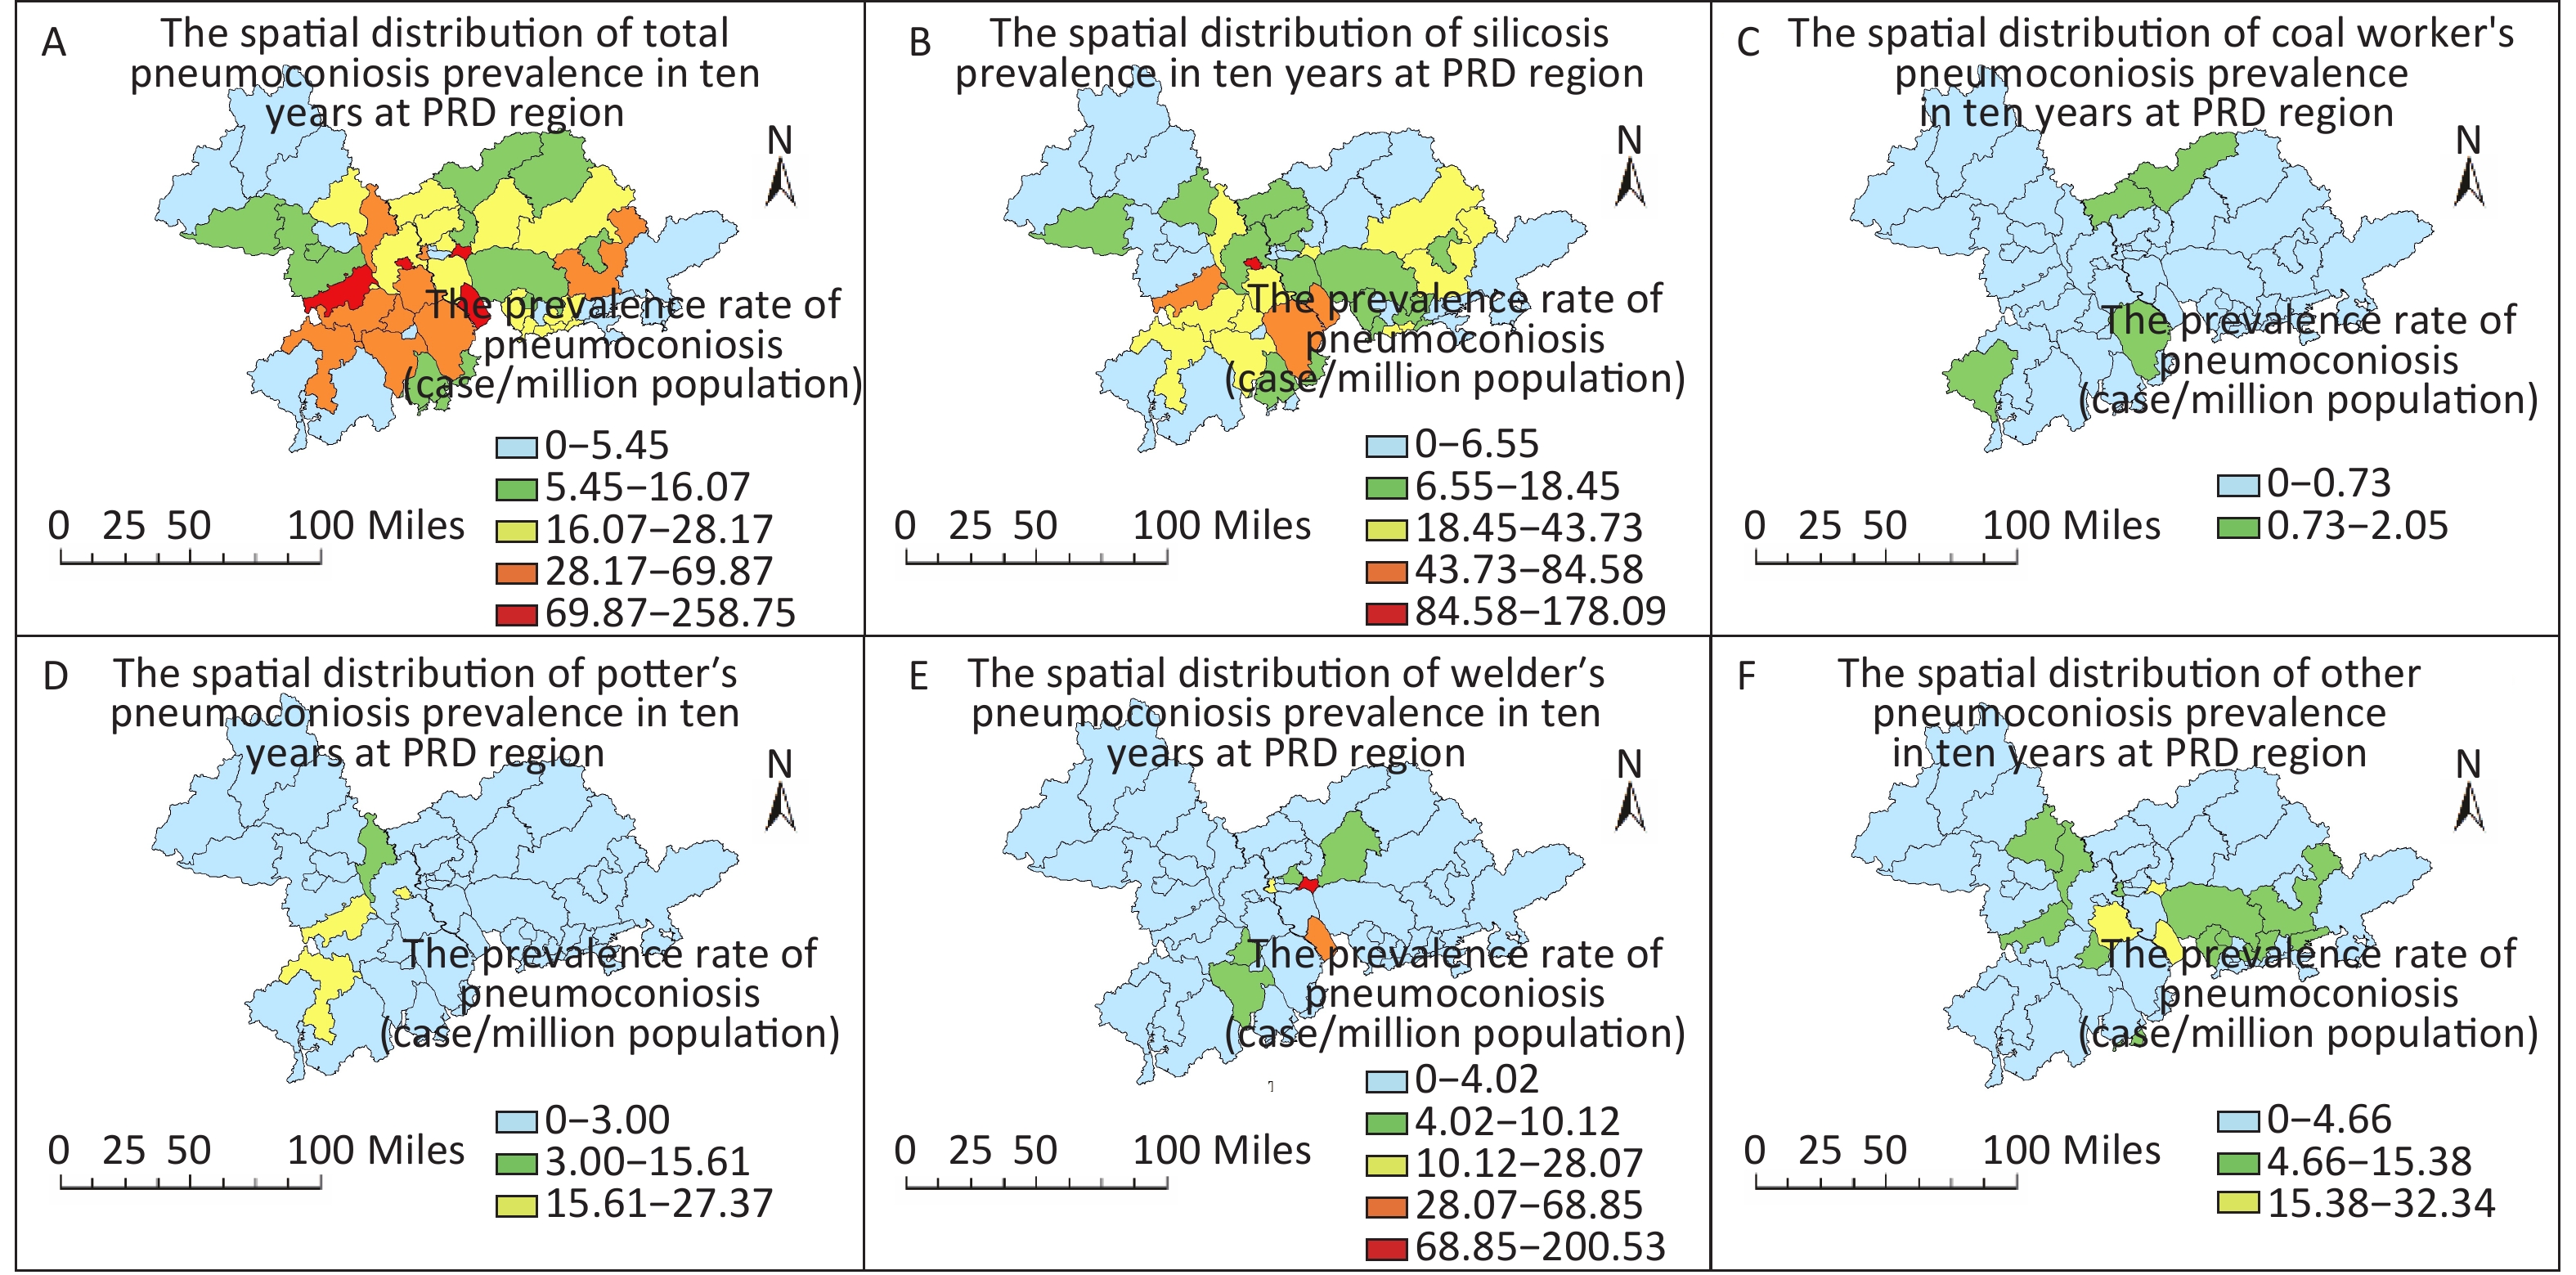
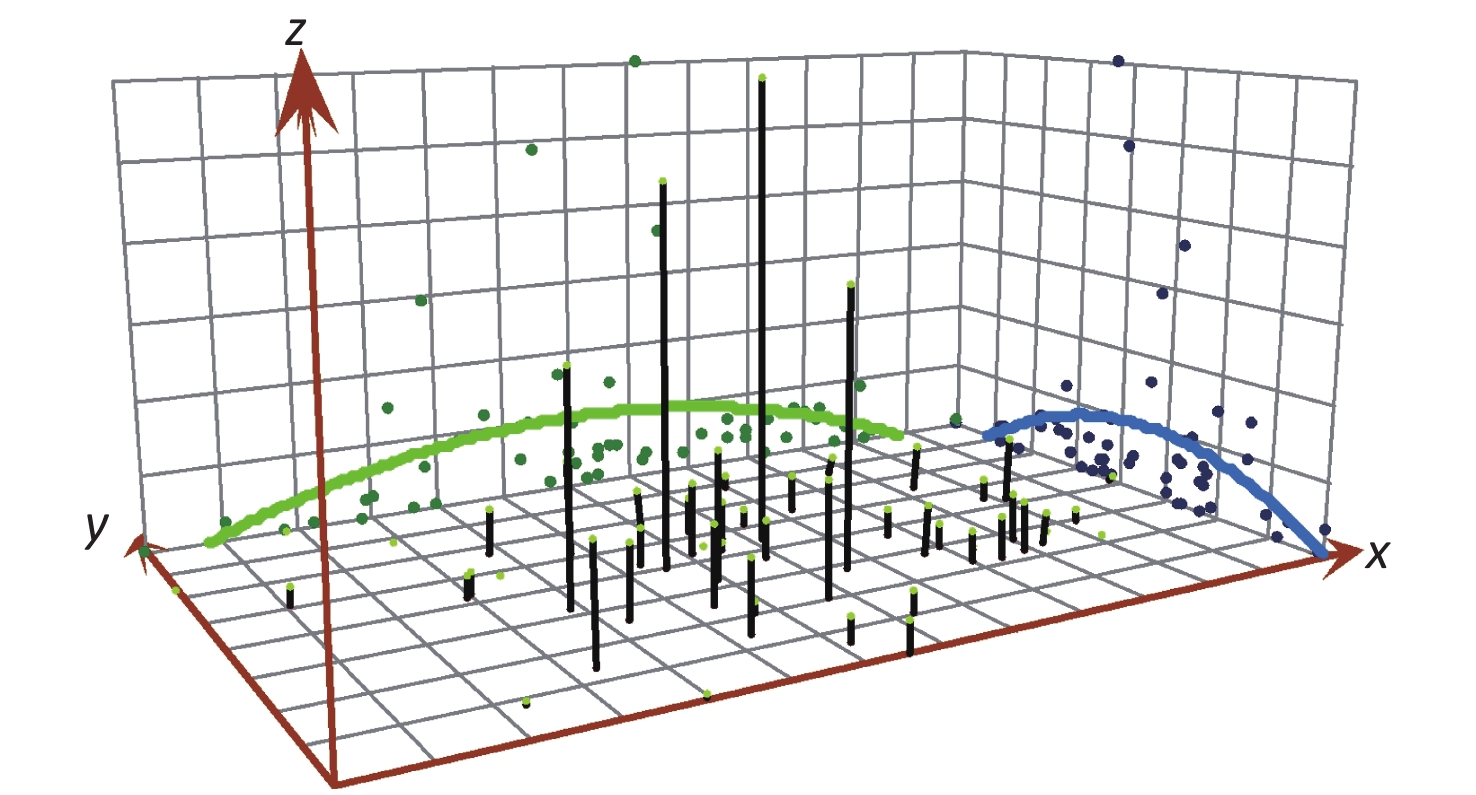
As shown in Figure 1A, most pneumoconiosis occurred in Chancheng, Nansha, Shunde, Gaoming, and Huangpu, which have higher incidence rates (> 69 cases/million population) than those in other counties/districts in the Pearl River Delta. Chancheng district and Gaoming district also have the highest incidence rates of silicosis, with 178 cases/million population and 84 cases/million population, respectively (Figure 1B). The Huangpu district exhibited relatively high incidence rates of welder’s pneumoconiosis (Figure 1E). Incidence rates of coal worker’s pneumoconiosis, potter’s pneumoconiosis, and other types of pneumoconiosis showed a scattered distribution (Figures 1C, D, & F). According to the trend surface analysis (Supplementary Figure S2 available in www.besjournal.com), the trend of incidence rates is depicted as a parabolic curve, in the middle of which the highest incidence rates of pneumoconiosis is displayed in both the latitudinal and longitudinal axes.
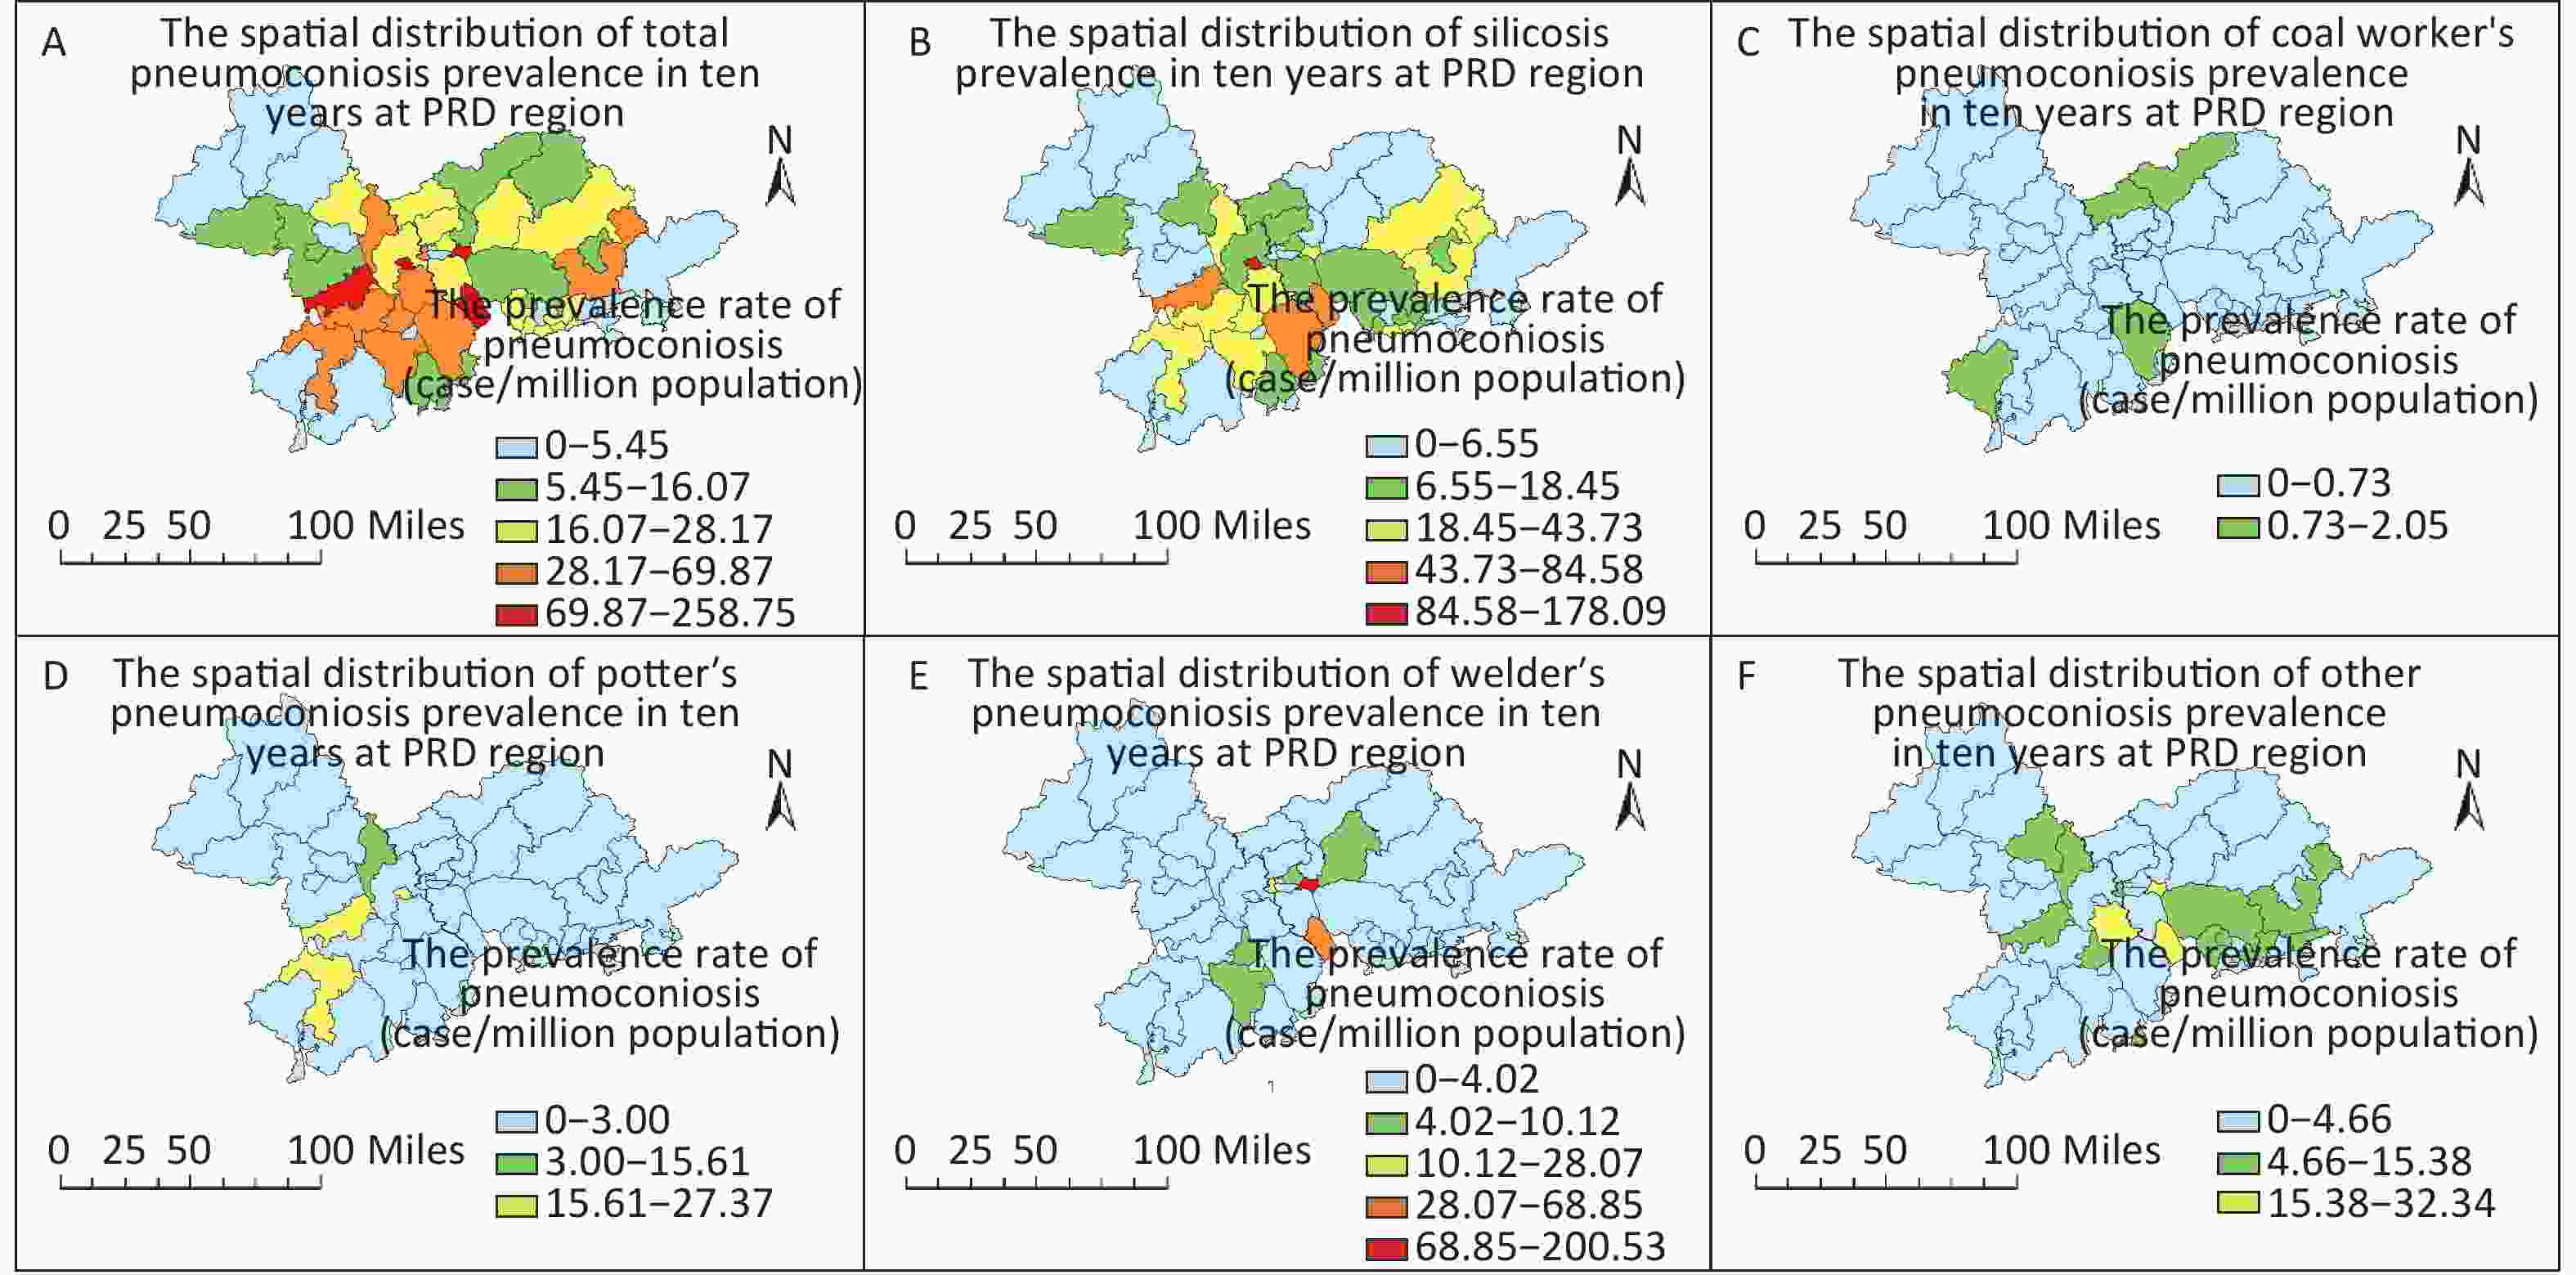
Figure 1. Spatial distribution of total pneumoconiosis and selected types of pneumoconiosis in the Pearl River Delta stratified by county/district in 2006–2015. (A) Total pneumoconiosis; (B) Silicosis; (C) Coal worker’s pneumoconiosis; (D) Potter’s pneumoconiosis; (E) Welder’s pneumoconiosis; (F) Other pneumoconiosis.

Figure S2. The trend surface analysis of pneumoconiosis in 2006-2015 in the Pearl River Delta.
Data from the ten-year period were divided into two groups: the first five years (2006 to 2010) and the last five years (2011 to 2015). According to Table 1, Moran’s I index is 0.136 (2006–2010), with a Z value higher than 1.96. This result indicates a collective model during this time period. However, the last five years and all ten years of data do not show a collective model. Among each category of pneumoconiosis, only silicosis has a collective characteristic according to the calculation of Moran's I, whereas the remaining types do not have a global spatial autocorrelation.
Table 1. The global spatial autocorrelation of the Pearl River Delta region calculated using Global Moran’s I
Item Categories Global Moran’s I Cluster results Moran’s I Z-value P Temporal group 2006−2015 0.036 0.646 0.518 Random 2006−2010 0.136 2.212 0.027 Collective 2011−2015 0.004 0.286 0.775 Random Types S 0.143 2.163 0.031 Collective CWP −0.041 −0.261 0.794 Random PP 0.021 0.477 0.634 Random WP −0.005 0.297 0.766 Random OP −0.030 −0.124 0.901 Random Note. S, silicosis; CWP, coal worker’s pneumoconiosis; PP, potter’s pneumoconiosis; WP, welder’s pneumoconiosis; OP, other pneumoconiosis. YLD was calculated on the basis of life expectancy, onset age, and stage of pneumoconiosis. Illustrated by Figure 2A & C, the accumulative YLD in each area varied greatly in spatial distribution and the districts with the highest YLD were mainly concentrated in the central part of the PRD region, including Zhongshan, Chancheng, Shunde, Dongguan, and Baoan (Figure 1A, red areas). The average YLD (total YLD/cases) in each area did not demonstrate a notable variation among the 53 districts/counties (Figure 1B & D).
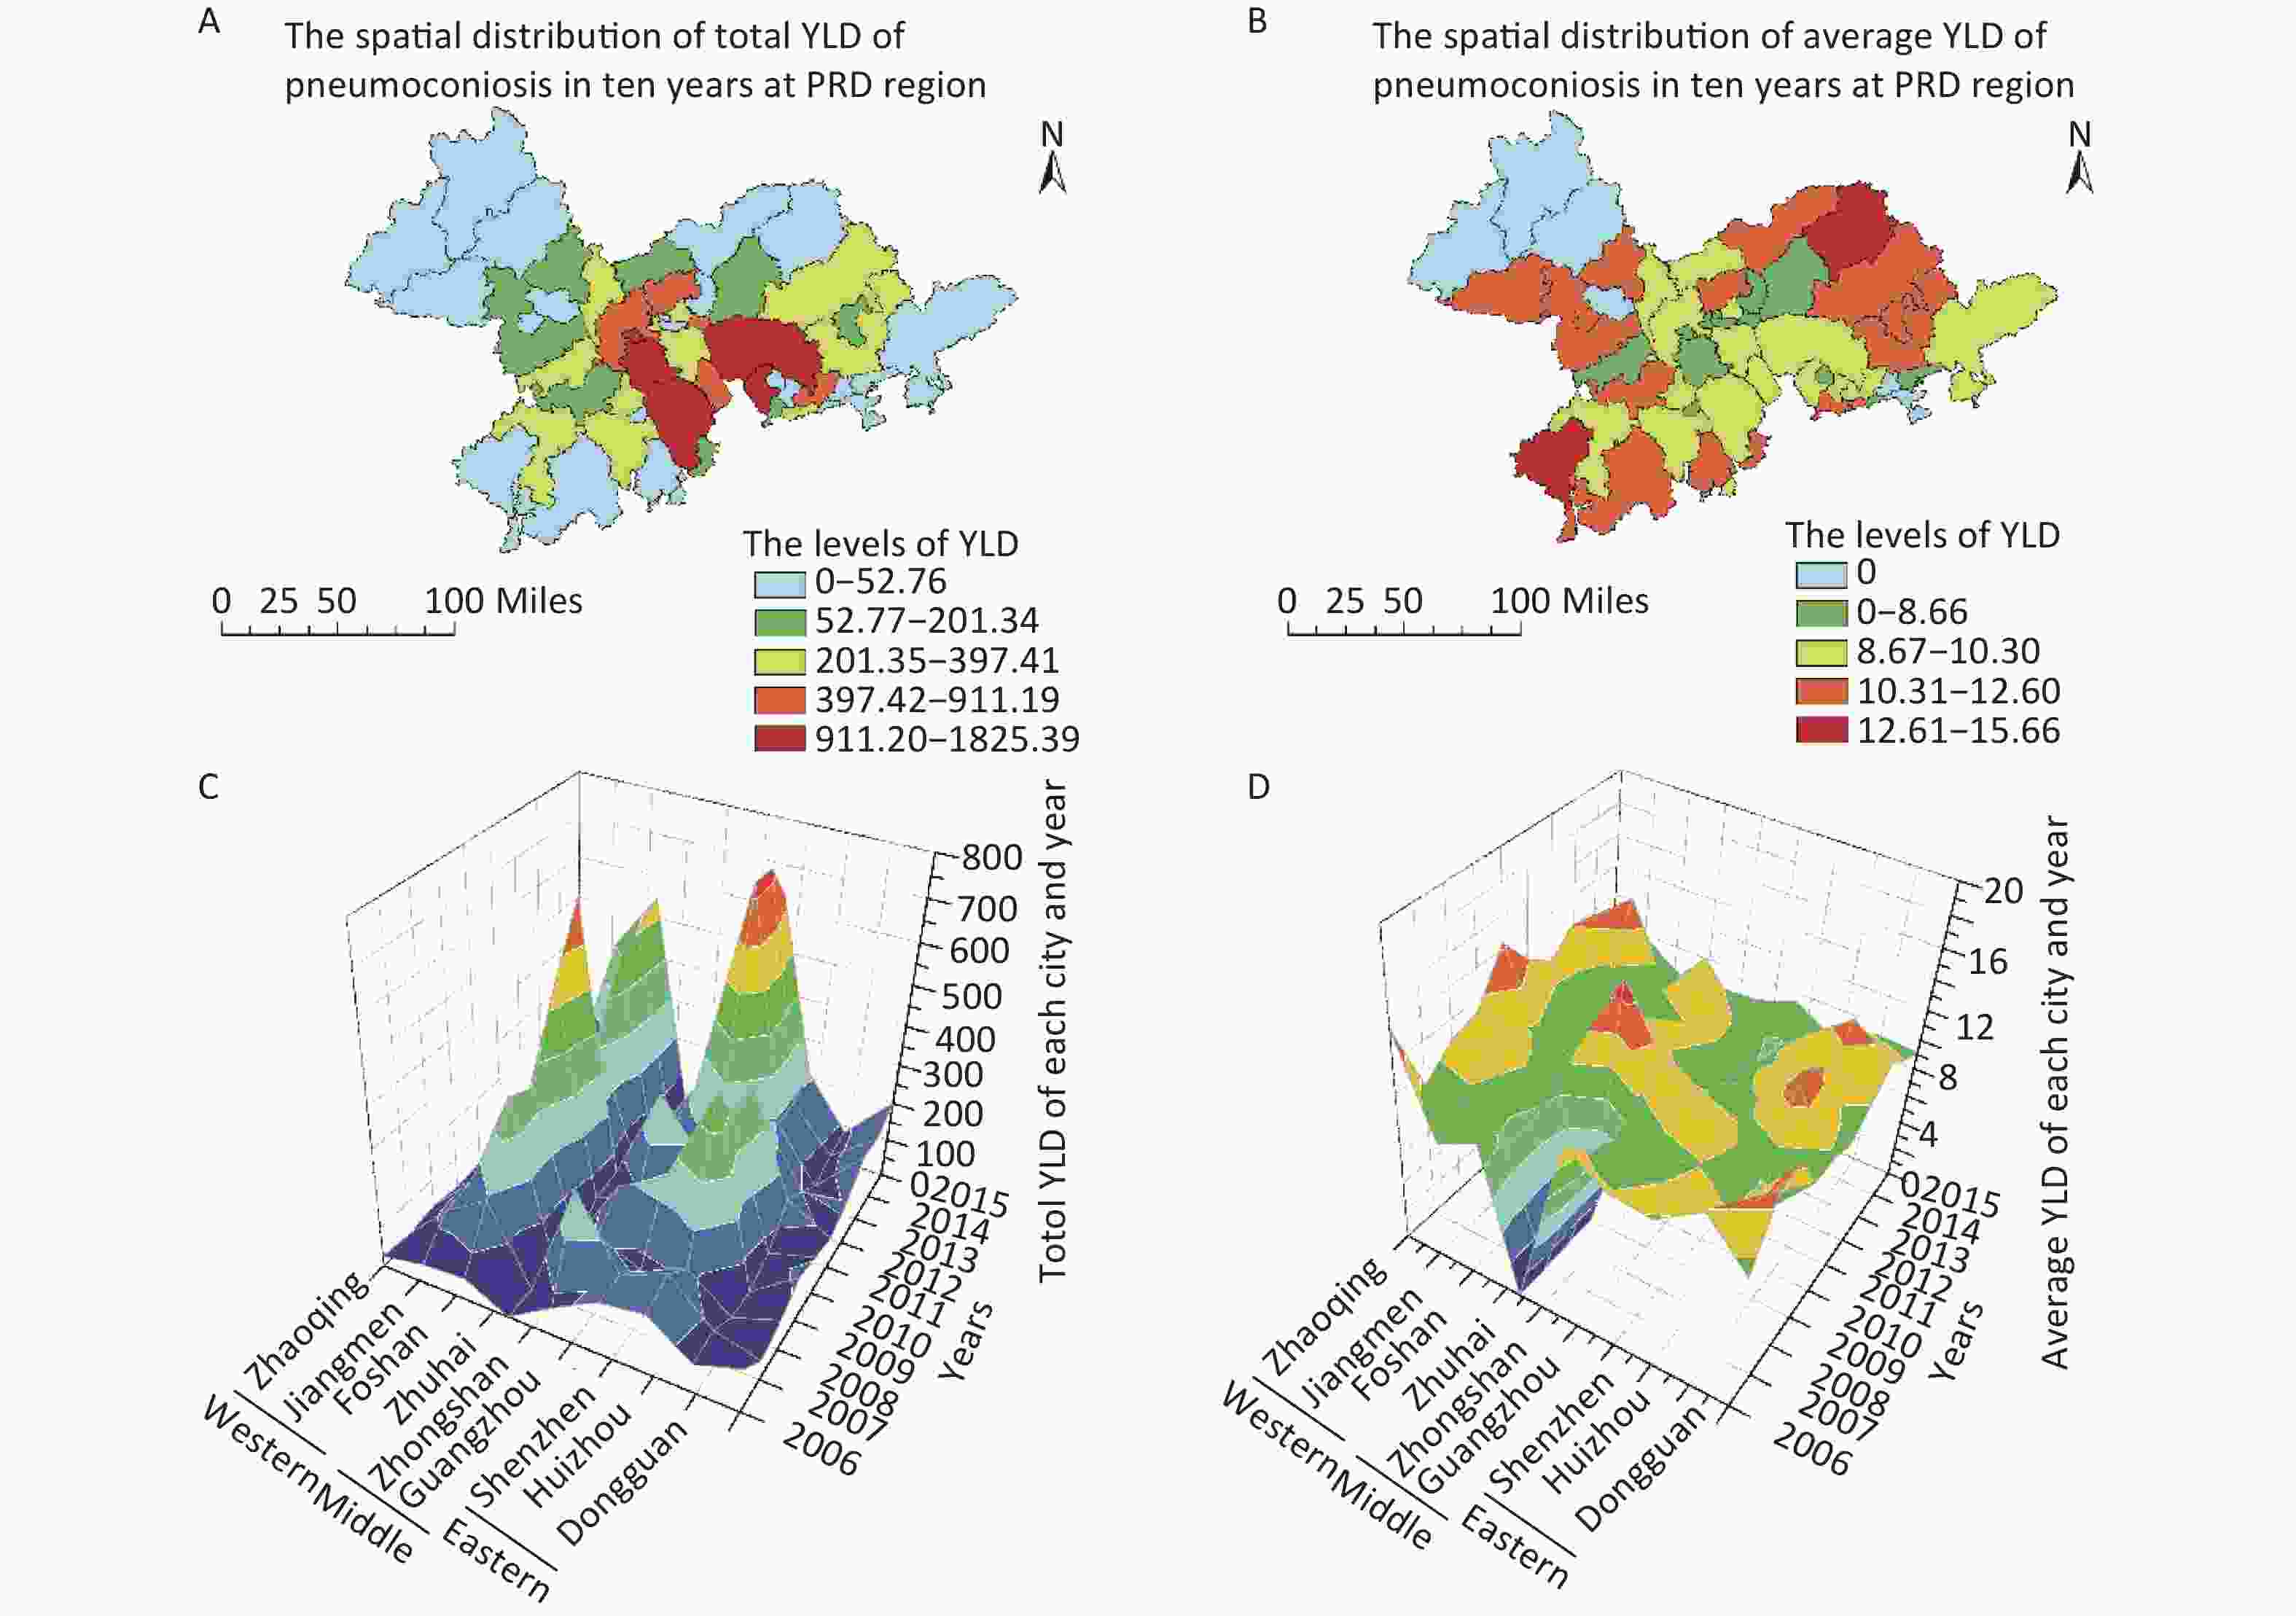
Figure 2. The total YLD and average YLD in the Pearl River Delta region. (A) total YLD in each district/county; (B) average YLD in each district/county; (C) total YLD of cities in each year; (D) average YLD of cities in each year.
There was a significant difference in age, working years, enterprise scale, and industry between groups in the two-way ANOVA. As a result, patients aged 20–30 years who have worked with dust/fiber in the last 5 years may have a relatively higher YLD. Laborers who work in building materials, mining, and light industry may have greater YLD (> 10 years) on average than workers in other types of industries. In addition, welder’s pneumoconiosis showed the lowest contribution to YLD, and of the cases of welder’s pneumoconiosis, 60.54% were stage I pneumoconiosis, whereas 37% of all cases were stage I pneumoconiosis (Supplementary Table S3 available in www.besjournal.com).
Table S3. Average YLD of pneumoconiosis in different categories in the Pearl River Delta region from 2006 to 2015
General information 2006 2007 2008 2009 2010 2011 2012 2013 2014 2015 Total F valuea P value Gender Male 9.99 9.35 8.66 10.06 9.57 9.27 9.32 9.10 8.61 8.91 9.20 0.16 0.703 Female 12.01 11.59 12.68 11.19 9.53 7.13 9.23 7.94 7.00 7.09 8.86 Age 20–30 11.13 8.91 10.39 9.56 13.56 10.07 10.94 12.13 11.42 11.03 11.05 48.74 < 0.01** 30–40 11.40 10.09 9.59 11.52 10.70 10.16 9.79 9.53 8.71 9.93 9.99 40–50 9.54 9.46 8.74 9.91 9.03 9.10 9.18 9.08 8.67 8.77 9.07 50–60 7.25 7.98 7.06 8.43 7.86 6.61 8.16 7.82 6.96 7.33 7.56 > 60 0.00 3.57 4.08 6.71 0.00 4.01 0.00 3.70 3.59 6.01 4.99 Working-year 0–5 10.41 10.64 10.01 11.17 8.56 9.85 9.36 9.39 9.02 9.31 9.66 3.318 < 0.05* 5–10 9.77 8.97 8.56 10.33 10.09 8.83 9.55 9.37 8.86 9.48 9.35 10–20 10.56 8.73 7.96 9.37 9.35 9.06 9.05 8.30 8.39 8.23 8.72 20–30 16.44 9.79 10.00 7.65 12.92 9.46 9.45 10.75 7.73 8.50 9.29 > 30 6.79 11.36 0.00 0.00 0.00 14.15 0.00 11.27 6.81 10.44 10.84 Enterprise scale Large 8.42 7.12 7.18 7.30 9.92 8.51 7.96 8.65 7.37 8.37 8.03 9.75b < 0.01** Middle 10.26 8.99 7.56 8.69 9.65 9.37 9.05 8.55 8.56 9.00 8.95 Small 10.79 10.24 10.10 10.53 9.83 9.24 9.62 9.86 8.70 8.73 9.61 Miniature 0.00 0.00 0.00 0.00 0.00 0.00 0.00 0.00 13.73 13.63 13.65 Unknown 10.04 11.66 12.02 12.12 8.11 10.32 10.09 10.50 9.64 8.73 10.12 Enterprise economic type State-owned 7.98 9.15 12.40 11.56 9.13 8.75 7.75 8.15 7.01 8.49 8.62 1.11 0.361 Collective 10.81 11.75 12.58 10.50 12.32 12.26 0.00 8.24 13.31 10.77 11.07 Private 10.43 9.96 9.30 10.42 9.44 9.23 9.53 9.60 8.50 9.01 9.37 Foreign &HMT 9.23 8.11 7.82 8.21 9.36 8.70 8.87 8.88 8.95 7.94 8.48 Industry Electronics 8.31 9.83 11.18 9.59 9.59 8.43 8.34 7.55 7.51 7.99 8.15 3.59 < 0.01** Machinery 11.85 9.02 9.61 9.41 9.05 8.30 9.25 9.05 9.15 9.05 9.11 Building materials 13.18 12.44 12.68 12.60 9.91 10.95 9.45 12.81 14.08 10.03 11.34 Manufacturing 11.23 9.20 8.99 9.19 10.73 9.49 9.50 14.39 11.79 10.37 9.65 Mining 9.25 10.57 10.03 9.90 10.39 11.53 10.50 11.38 9.02 8.92 10.24 Others 8.06 8.19 7.50 8.32 7.92 9.45 9.80 8.90 8.86 9.29 8.60 Light 11.13 8.91 10.39 9.56 13.56 10.07 10.94 12.13 11.42 11.03 11.05 3.37 < 0.05* Types of pneumoconiosis S 10.53 9.41 8.60 10.52 9.69 9.90 9.74 9.93 9.22 9.07 9.61 PP 13.91 7.61 6.69 7.88 8.48 7.68 8.35 9.44 8.40 8.33 8.16 CWP 0.00 10.68 0.00 10.77 6.25 11.70 0.00 7.25 6.97 10.95 9.80 WP 6.79 9.33 7.33 6.63 8.96 7.27 7.30 7.17 6.88 6.87 7.16 OP 8.05 9.32 10.78 9.21 9.96 8.26 9.45 10.17 9.80 9.18 9.39 Note. HMT, Hong Kong, Macao, and Taiwan; S, silicosis; CWP, coal worker’s pneumoconiosis; PP, potter’s pneumoconiosis; WP, welder’s pneumoconiosis; OP, other pneumoconiosis. a, Two-way ANOVA was applied to analyze the difference in the category groups; b, The difference in Enterprise scales was analyzed except for the miniature group; *P value < 0.05; **P value < 0.01. In this study, the spatial and temporal distribution of occurrence and the related YLD were analyzed to understand the status of pneumoconiosis incidence in the Pearl River Delta in 2006–2015. The age at which pneumoconiosis occurs among workers in the last five years of the study period seems to be higher than that in the first five years. Private enterprise accounts for the largest number of patients compared with other types of enterprise, which may be due to the inadequate conditions of the working environment and lack of health protection. Meanwhile, some private enterprises cannot carry out their legally binding responsibilities to manage occupational hazards in the workplace[11] and may conceal patient information or even dismiss workers who become sick.
Among the different types of pneumoconiosis, silicosis was considered to be the most prevalent and most hazardous type[2, 12]. In our data, cases diagnosed with silicosis accounted for more than 45% of pneumoconiosis cases each year; these cases occurred mainly in the center of the Pearl River Delta and had a positive spatial autocorrelation calculated using Global Moran’s I. The remaining three types of pneumoconiosis had unique exposure factors, so they were less frequent.
We further estimated the YLD of each case of pneumoconiosis. The central area of the Pearl River Delta accounted for the largest number of YLD during the ten-year period, while the average YLD of different areas did not demonstrate remarkable discrepancies. The DALY of 17 occupational risk factors in Iran was reported and silica was the identified as the cause of 2,349 DALY in 2015[13]. The DALYs resulting from occupational exposure to silica globally reached 1,894,000 in 2015[14]. In this study, the YLD of silicosis were 1414.53 in 2015 in the Pearl River Delta, a level similar to that in Iran. In addition, pneumoconiosis is a progressive and life-long disease that has high potential for high medical costs and labor losses. Martin et al. showed that the medical costs of workers in mining or mining-related industries, as well as oil and gas extraction, were approximately 0.1 billion US dollars in 2005–2007 in Québec[15].
According to the 2015 China Statistical Yearbook, Guangdong province has approximately 80% of China’s factories and secondary industry, which require a huge number of workers[16], and of which the Pearl River Delta region is the political, economic, and cultural center. However, the data in this study demonstrated that the higher YLD was contributed by small, private enterprises and some special types of industry. Worker protection relies on the competence of the enterprise and the leaders’ awareness of occupational health hazards. Our data have shown a deficiency in occupational health management and control of the work environment. Therefore, the development of related occupational health supervision and protection should be emphasized and promoted.
doi: 10.3967/bes2020.026
Spatial and Temporal Variations of Pneumoconiosis in the Pearl River Delta Region in 2006–2015
-
-
Figure 1. Spatial distribution of total pneumoconiosis and selected types of pneumoconiosis in the Pearl River Delta stratified by county/district in 2006–2015. (A) Total pneumoconiosis; (B) Silicosis; (C) Coal worker’s pneumoconiosis; (D) Potter’s pneumoconiosis; (E) Welder’s pneumoconiosis; (F) Other pneumoconiosis.
S2. The trend surface analysis of pneumoconiosis in 2006-2015 in the Pearl River Delta.
Figure 2. The total YLD and average YLD in the Pearl River Delta region. (A) total YLD in each district/county; (B) average YLD in each district/county; (C) total YLD of cities in each year; (D) average YLD of cities in each year.
S1. The disability weight of each gradation of pneumoconiosis-induced disability
Gradation of disability Disability weight Stage I pneumoconiosis 0.30 Stage I pneumoconiosis with tuberculosis or Stage II pneumoconiosis 0.55 Stage II pneumoconiosis with tuberculosis or Stage III pneumoconiosis 0.65 Stage III pneumoconiosis with tuberculosis 0.75  下载: 导出CSV
S2. General information on pneumoconiosis occurrence in the Pearl River Delta region each year from 2006 to 2015
General information 2006 2007 2008 2009 2010 2011 2012 2013 2014 2015 Total χ2 P Gender Male 62 112 111 148 160 213 141 210 217 263 1,637 6.5 0.668 Female 4 2 1 3 5 7 2 5 4 5 38 Age 20–30 13 16 8 8 1 1 1 3 3 2 56 398.1 < 0.01* 30–40 29 63 61 52 67 62 40 51 41 29 495 40–50 20 31 32 75 77 134 85 116 130 132 832 50–60 2 1 10 15 17 17 14 43 43 91 253 ≥ 60 1 3 4 2 3 2 0 5 3 16 39 Working-year 0–5 13 28 21 26 32 41 29 36 31 60 317 89.7 < 0.01* 5–10 38 58 50 61 68 81 47 67 82 79 631 10–20 13 25 39 62 61 87 52 91 85 106 621 20–30 1 2 2 2 4 9 15 17 22 21 95 ≥ 30 1 1 0 0 0 2 0 4 1 2 11 Enterprise scale Large 9 26 48 14 11 36 17 67 26 31 285 207.8 < 0.01* Middle 19 23 10 37 40 60 43 72 91 135 530 Small 20 56 50 71 93 115 64 64 85 75 693 Miniature 0 0 0 0 0 0 0 0 1 3 4 Unknown 18 9 4 29 21 9 19 12 18 24 163 Enterprise economic type State-owned 4 4 3 12 8 3 3 44 15 26 122 234.1 < 0.01* Collective 14 3 3 4 9 9 0 11 6 17 76 Private 34 71 47 106 130 146 101 111 171 177 1,096 Foreign &HMT 14 36 59 29 18 62 39 47 29 48 381 Industry Electronics 2 1 0 0 2 0 3 5 4 3 20 544.3 < 0.01* Machinery 9 12 6 13 27 37 44 87 81 65 381 Building materials 22 17 14 49 65 87 31 57 85 127 554 Manufacturing 2 4 1 35 27 13 16 11 3 2 114 Mining 4 34 21 27 11 23 10 2 5 12 149 Others 21 20 18 15 23 30 24 29 25 20 225 Light 6 26 52 12 10 30 15 24 18 39 232 Note. HMT, Hong Kong, Macao, and Taiwan. *P value < 0.01.
下载: 导出CSV
Table 1. The global spatial autocorrelation of the Pearl River Delta region calculated using Global Moran’s I
Item Categories Global Moran’s I Cluster results Moran’s I Z-value P Temporal group 2006−2015 0.036 0.646 0.518 Random 2006−2010 0.136 2.212 0.027 Collective 2011−2015 0.004 0.286 0.775 Random Types S 0.143 2.163 0.031 Collective CWP −0.041 −0.261 0.794 Random PP 0.021 0.477 0.634 Random WP −0.005 0.297 0.766 Random OP −0.030 −0.124 0.901 Random Note. S, silicosis; CWP, coal worker’s pneumoconiosis; PP, potter’s pneumoconiosis; WP, welder’s pneumoconiosis; OP, other pneumoconiosis.
下载: 导出CSV
S3. Average YLD of pneumoconiosis in different categories in the Pearl River Delta region from 2006 to 2015
General information 2006 2007 2008 2009 2010 2011 2012 2013 2014 2015 Total F valuea P value Gender Male 9.99 9.35 8.66 10.06 9.57 9.27 9.32 9.10 8.61 8.91 9.20 0.16 0.703 Female 12.01 11.59 12.68 11.19 9.53 7.13 9.23 7.94 7.00 7.09 8.86 Age 20–30 11.13 8.91 10.39 9.56 13.56 10.07 10.94 12.13 11.42 11.03 11.05 48.74 < 0.01** 30–40 11.40 10.09 9.59 11.52 10.70 10.16 9.79 9.53 8.71 9.93 9.99 40–50 9.54 9.46 8.74 9.91 9.03 9.10 9.18 9.08 8.67 8.77 9.07 50–60 7.25 7.98 7.06 8.43 7.86 6.61 8.16 7.82 6.96 7.33 7.56 > 60 0.00 3.57 4.08 6.71 0.00 4.01 0.00 3.70 3.59 6.01 4.99 Working-year 0–5 10.41 10.64 10.01 11.17 8.56 9.85 9.36 9.39 9.02 9.31 9.66 3.318 < 0.05* 5–10 9.77 8.97 8.56 10.33 10.09 8.83 9.55 9.37 8.86 9.48 9.35 10–20 10.56 8.73 7.96 9.37 9.35 9.06 9.05 8.30 8.39 8.23 8.72 20–30 16.44 9.79 10.00 7.65 12.92 9.46 9.45 10.75 7.73 8.50 9.29 > 30 6.79 11.36 0.00 0.00 0.00 14.15 0.00 11.27 6.81 10.44 10.84 Enterprise scale Large 8.42 7.12 7.18 7.30 9.92 8.51 7.96 8.65 7.37 8.37 8.03 9.75b < 0.01** Middle 10.26 8.99 7.56 8.69 9.65 9.37 9.05 8.55 8.56 9.00 8.95 Small 10.79 10.24 10.10 10.53 9.83 9.24 9.62 9.86 8.70 8.73 9.61 Miniature 0.00 0.00 0.00 0.00 0.00 0.00 0.00 0.00 13.73 13.63 13.65 Unknown 10.04 11.66 12.02 12.12 8.11 10.32 10.09 10.50 9.64 8.73 10.12 Enterprise economic type State-owned 7.98 9.15 12.40 11.56 9.13 8.75 7.75 8.15 7.01 8.49 8.62 1.11 0.361 Collective 10.81 11.75 12.58 10.50 12.32 12.26 0.00 8.24 13.31 10.77 11.07 Private 10.43 9.96 9.30 10.42 9.44 9.23 9.53 9.60 8.50 9.01 9.37 Foreign &HMT 9.23 8.11 7.82 8.21 9.36 8.70 8.87 8.88 8.95 7.94 8.48 Industry Electronics 8.31 9.83 11.18 9.59 9.59 8.43 8.34 7.55 7.51 7.99 8.15 3.59 < 0.01** Machinery 11.85 9.02 9.61 9.41 9.05 8.30 9.25 9.05 9.15 9.05 9.11 Building materials 13.18 12.44 12.68 12.60 9.91 10.95 9.45 12.81 14.08 10.03 11.34 Manufacturing 11.23 9.20 8.99 9.19 10.73 9.49 9.50 14.39 11.79 10.37 9.65 Mining 9.25 10.57 10.03 9.90 10.39 11.53 10.50 11.38 9.02 8.92 10.24 Others 8.06 8.19 7.50 8.32 7.92 9.45 9.80 8.90 8.86 9.29 8.60 Light 11.13 8.91 10.39 9.56 13.56 10.07 10.94 12.13 11.42 11.03 11.05 3.37 < 0.05* Types of pneumoconiosis S 10.53 9.41 8.60 10.52 9.69 9.90 9.74 9.93 9.22 9.07 9.61 PP 13.91 7.61 6.69 7.88 8.48 7.68 8.35 9.44 8.40 8.33 8.16 CWP 0.00 10.68 0.00 10.77 6.25 11.70 0.00 7.25 6.97 10.95 9.80 WP 6.79 9.33 7.33 6.63 8.96 7.27 7.30 7.17 6.88 6.87 7.16 OP 8.05 9.32 10.78 9.21 9.96 8.26 9.45 10.17 9.80 9.18 9.39 Note. HMT, Hong Kong, Macao, and Taiwan; S, silicosis; CWP, coal worker’s pneumoconiosis; PP, potter’s pneumoconiosis; WP, welder’s pneumoconiosis; OP, other pneumoconiosis. a, Two-way ANOVA was applied to analyze the difference in the category groups; b, The difference in Enterprise scales was analyzed except for the miniature group; *P value < 0.05; **P value < 0.01.
下载: 导出CSV
-
[1] Cullinan P, Reid P. Pneumoconiosis. Primary Care Respiratory J, 2013; 22, 249−52. [2] Leung C, Yu I, Chen W. Silicosis. Lancet, 2012; 379, 2008−15. doi: 10.1016/S0140-6736(12)60235-9 [3] Wang MF, Li RZ, Li Y, et al. Clinical statistics analysis on the characteristics of pneumoconiosis of Chinese miner population. J Thoracic Dis, 2016; 8, 2203−11. doi: 10.21037/jtd.2016.07.53 [4] Yin Xiao, Wang JS, Zeng LH, et al. Analysis on situation of occupational diseases outbreak and future countermeasure and suggestion in Guangdong province, 2011-2013. Chin Occup Med, 2014; 41, 445−7. (In Chinese) [5] QGIS Team. QGIS geographic information system. Open Source Geospatial Foundation. 2013. [6] Chen J, Yang ST, Li HW, et al. Research on geographical environment unit division based on the method of natural breaks (Jenks). ISPRS - International Archives of the Photogrammetry, Remote Sensing and Spatial Information Sciences, 2013; 4, 47−50. [7] Wang FH. Quantitative methods and applications in GIS. CRC Press, 2006; 19−23. [8] WHO. National tools. https://www.who.int/healthinfo/global_burden_disease/tools_national/en/. [2018-12-30] [9] GBD 2016 DALYs and HALE Collaborators. Global, regional, and national disability-adjusted life-years (DALYs) for 333 diseases and injuries and healthy life expectancy (HALE) for 195 countries and territories, 1990-2016: a systematic analysis for the Global Burden of Disease Study 2016. Lancet, 2017; 390, 1260−344. doi: 10.1016/S0140-6736(17)32130-X [10] Getis A. Reflections on spatial autocorrelation. Reg Sci Urban Eco, 2007; 37, 4, 491−6. [11] Xia Y, Liu JF, Shi TM, et al. Prevalence of pneumoconiosis in Hubei, China from 2008 to 2013. Int J Environ Res Public Health, 2014; 11, 8612−21. doi: 10.3390/ijerph110908612 [12] Bang KM, Mazurek JM, Wood JM, et al. Silicosis mortality trends and new exposures to respirable crystalline silica - United States, 2001-2010. MMWR Morb Mortal Wkly Rep, 2015; 64, 117−20. [13] Abtahi M, Koolivand A, Dobaradaran S, et al. National and subnational mortality and disability-adjusted life years (DALYs) attributable to 17 occupational risk factors in Iran, 1990-2015. Environ Res, 2018; 165, 158−75. doi: 10.1016/j.envres.2018.04.023 [14] GBD 2015 Risk Factors Collaborators. Global, regional, and national comparative risk assessment of 79 behavioural, environmental and occupational, and metabolic risks or clusters of risks, 1990-2015: a systematic analysis for the Global Burden of Disease Study 2015. Lancet (London, England), 2016; 388, 1659−724. doi: 10.1016/S0140-6736(16)31679-8 [15] Lebeau M, Duguay P, Boucher A. Costs of occupational injuries and diseases in Quebec. J Safety Res, 2014; 50, 89−98. doi: 10.1016/j.jsr.2014.04.002 [16] Hao W, Xing W, Li C. Study on the sustainable development of Guangdong province based on energy consumption. Adv Sci Technol, 2016; 6−10. -

 点击查看大图
计量
- 文章访问数: 1725
- HTML全文浏览量: 688
- PDF下载量: 90
- 被引次数: 0

 Quick Links