

 下载:
下载:


-
Nonalcoholic fatty liver disease (NAFLD) is known for its insidious onset and chronic nature, which have jeopardized the health and life of 29.2% of adults in China[1]. In 2020, metabolic dysfunction-associated fatty liver disease (MAFLD), a more accurate nomenclature to replace NAFLD, was put forward in an international consensus of experts involving 22 countries[2]. In China, at least 300 million people will suffer from MAFLD by 2030, which will be a heavy burden on national health[3].
The Great Chinese Famine from 1959 to 1961 left an indelible imprint on the Chinese people, causing 30 million deaths[4]. Based on population cohorts, fetal exposure to famine increased the risk of NAFLD in adult life[5]. However, the question of whether exposure to famine increases the risk of MAFLD and liver fibrosis remains unexplored. Therefore, this study aimed to explore the association of famine exposure with the presence and severity of MAFLD.
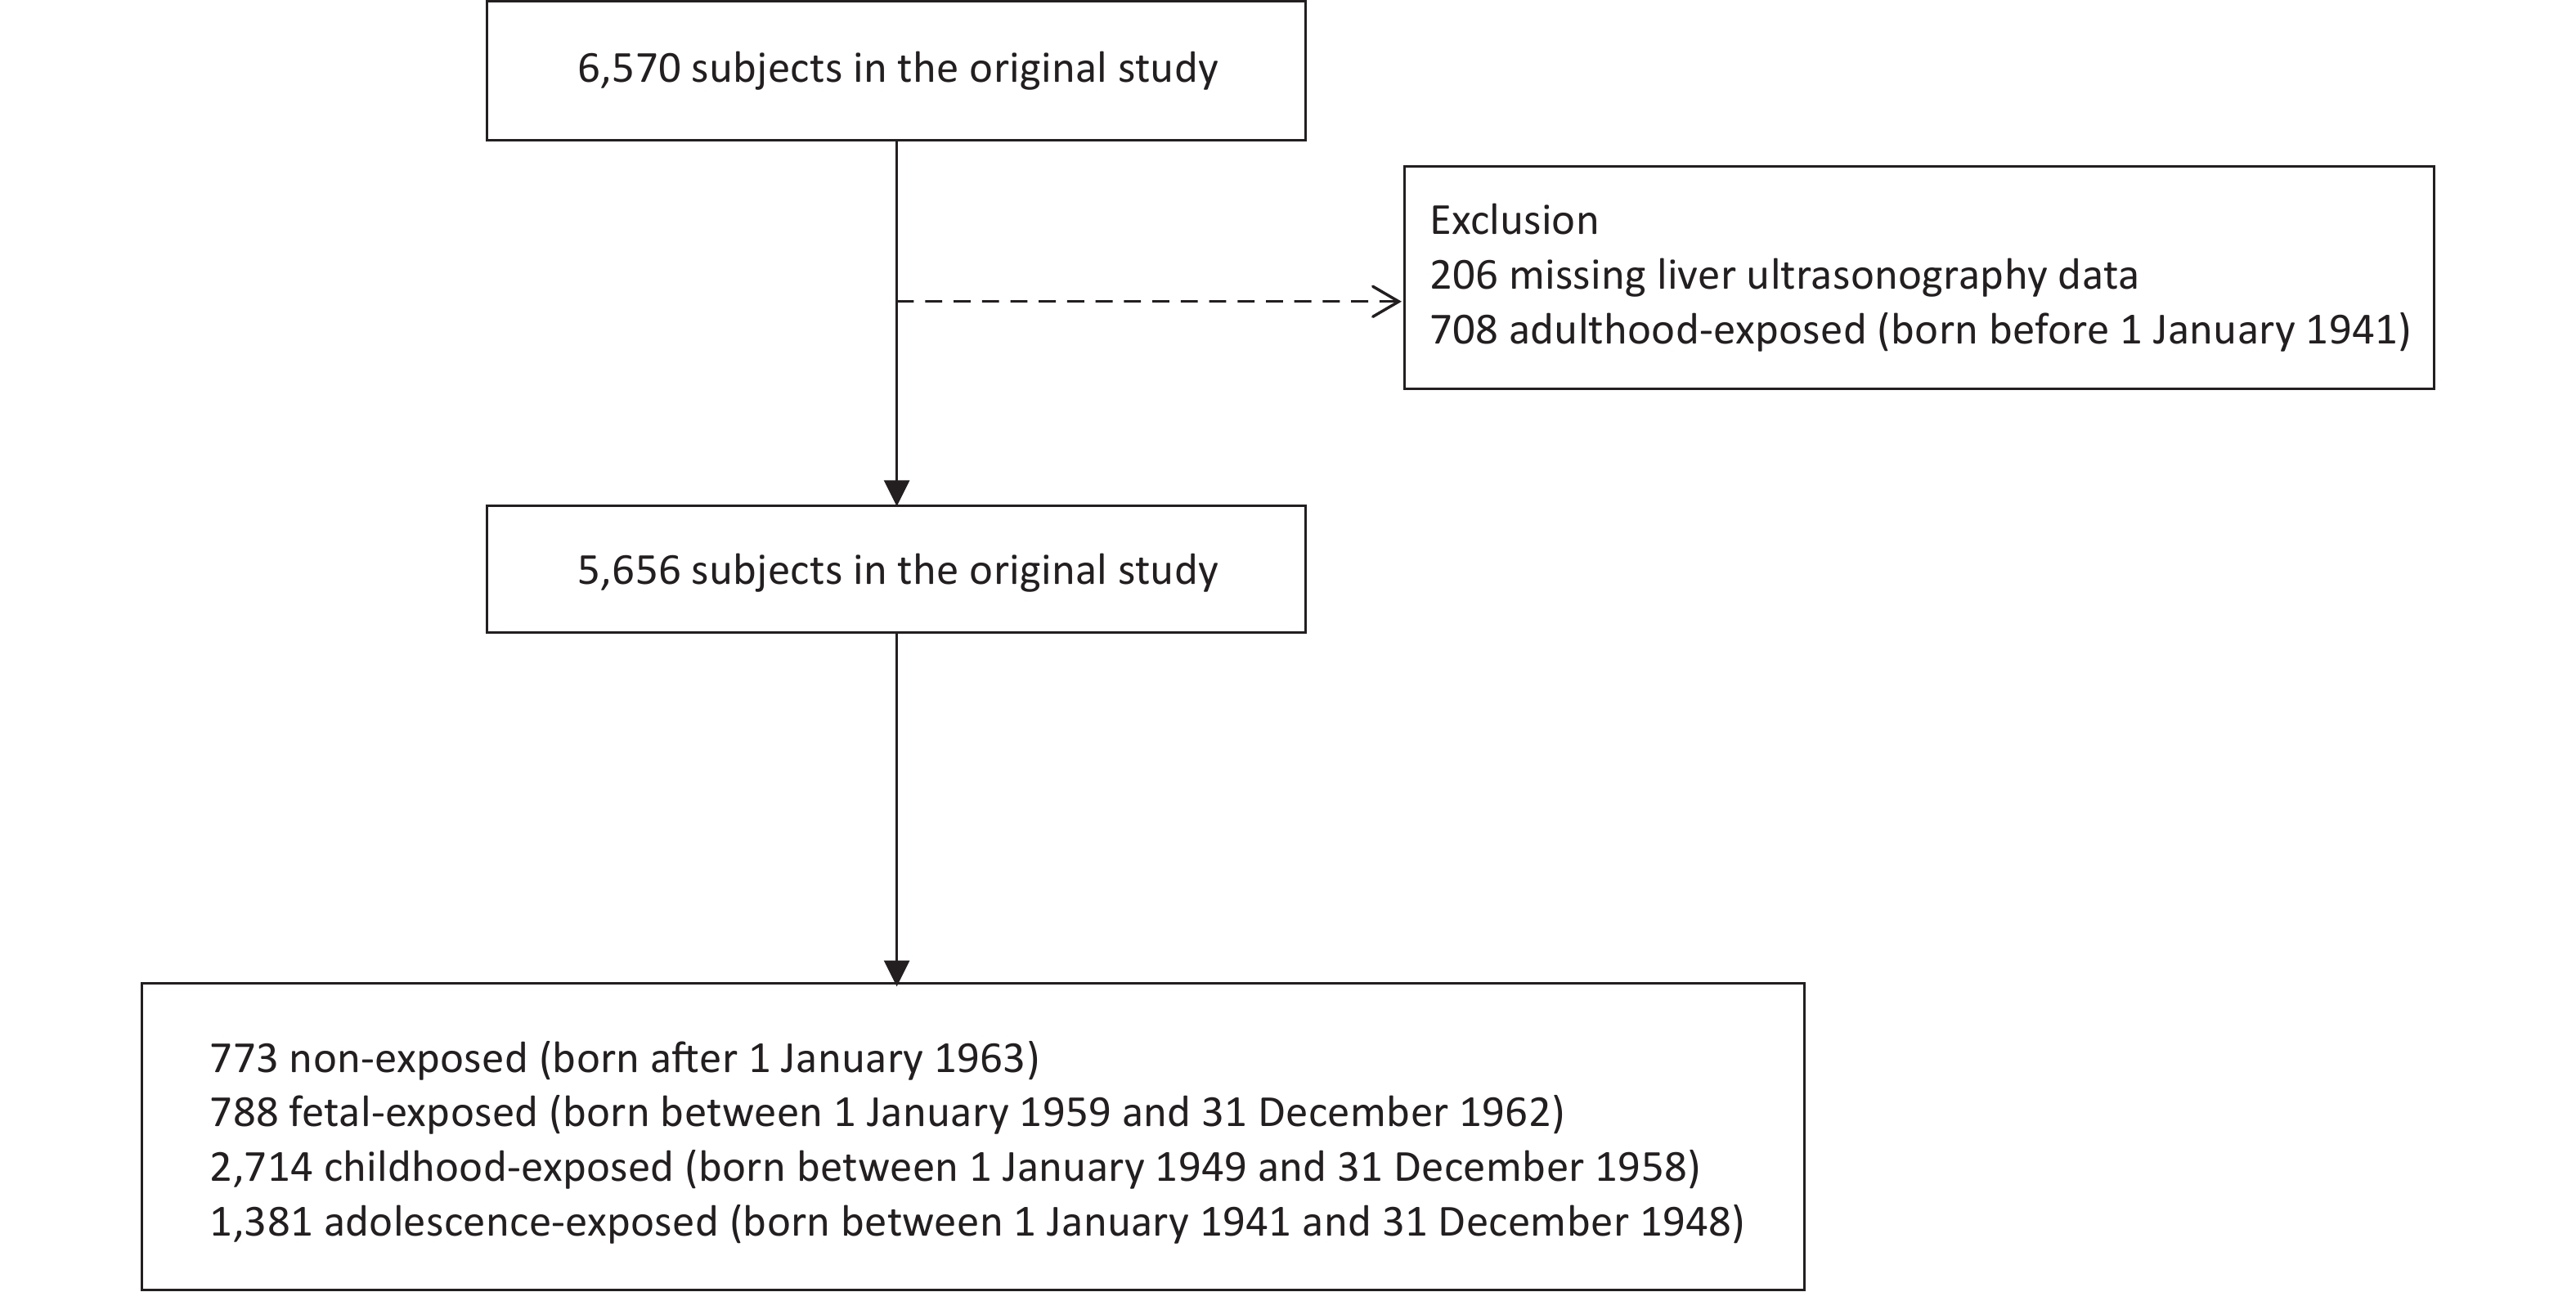
In our cross-sectional study, the study population was recruited from the Jiading District in Shanghai, China, between August 2014 and May 2015. A total of 6,570 middle-aged residents were enrolled to complete questionnaire assessments, clinical examinations, and biochemical tests. We excluded 206 individuals without liver ultrasonography data and 708 individuals who were born before January 1, 1941. Our final analysis included 5,656 participants (Supplementary Figure S1 available in www.besjournal.com).
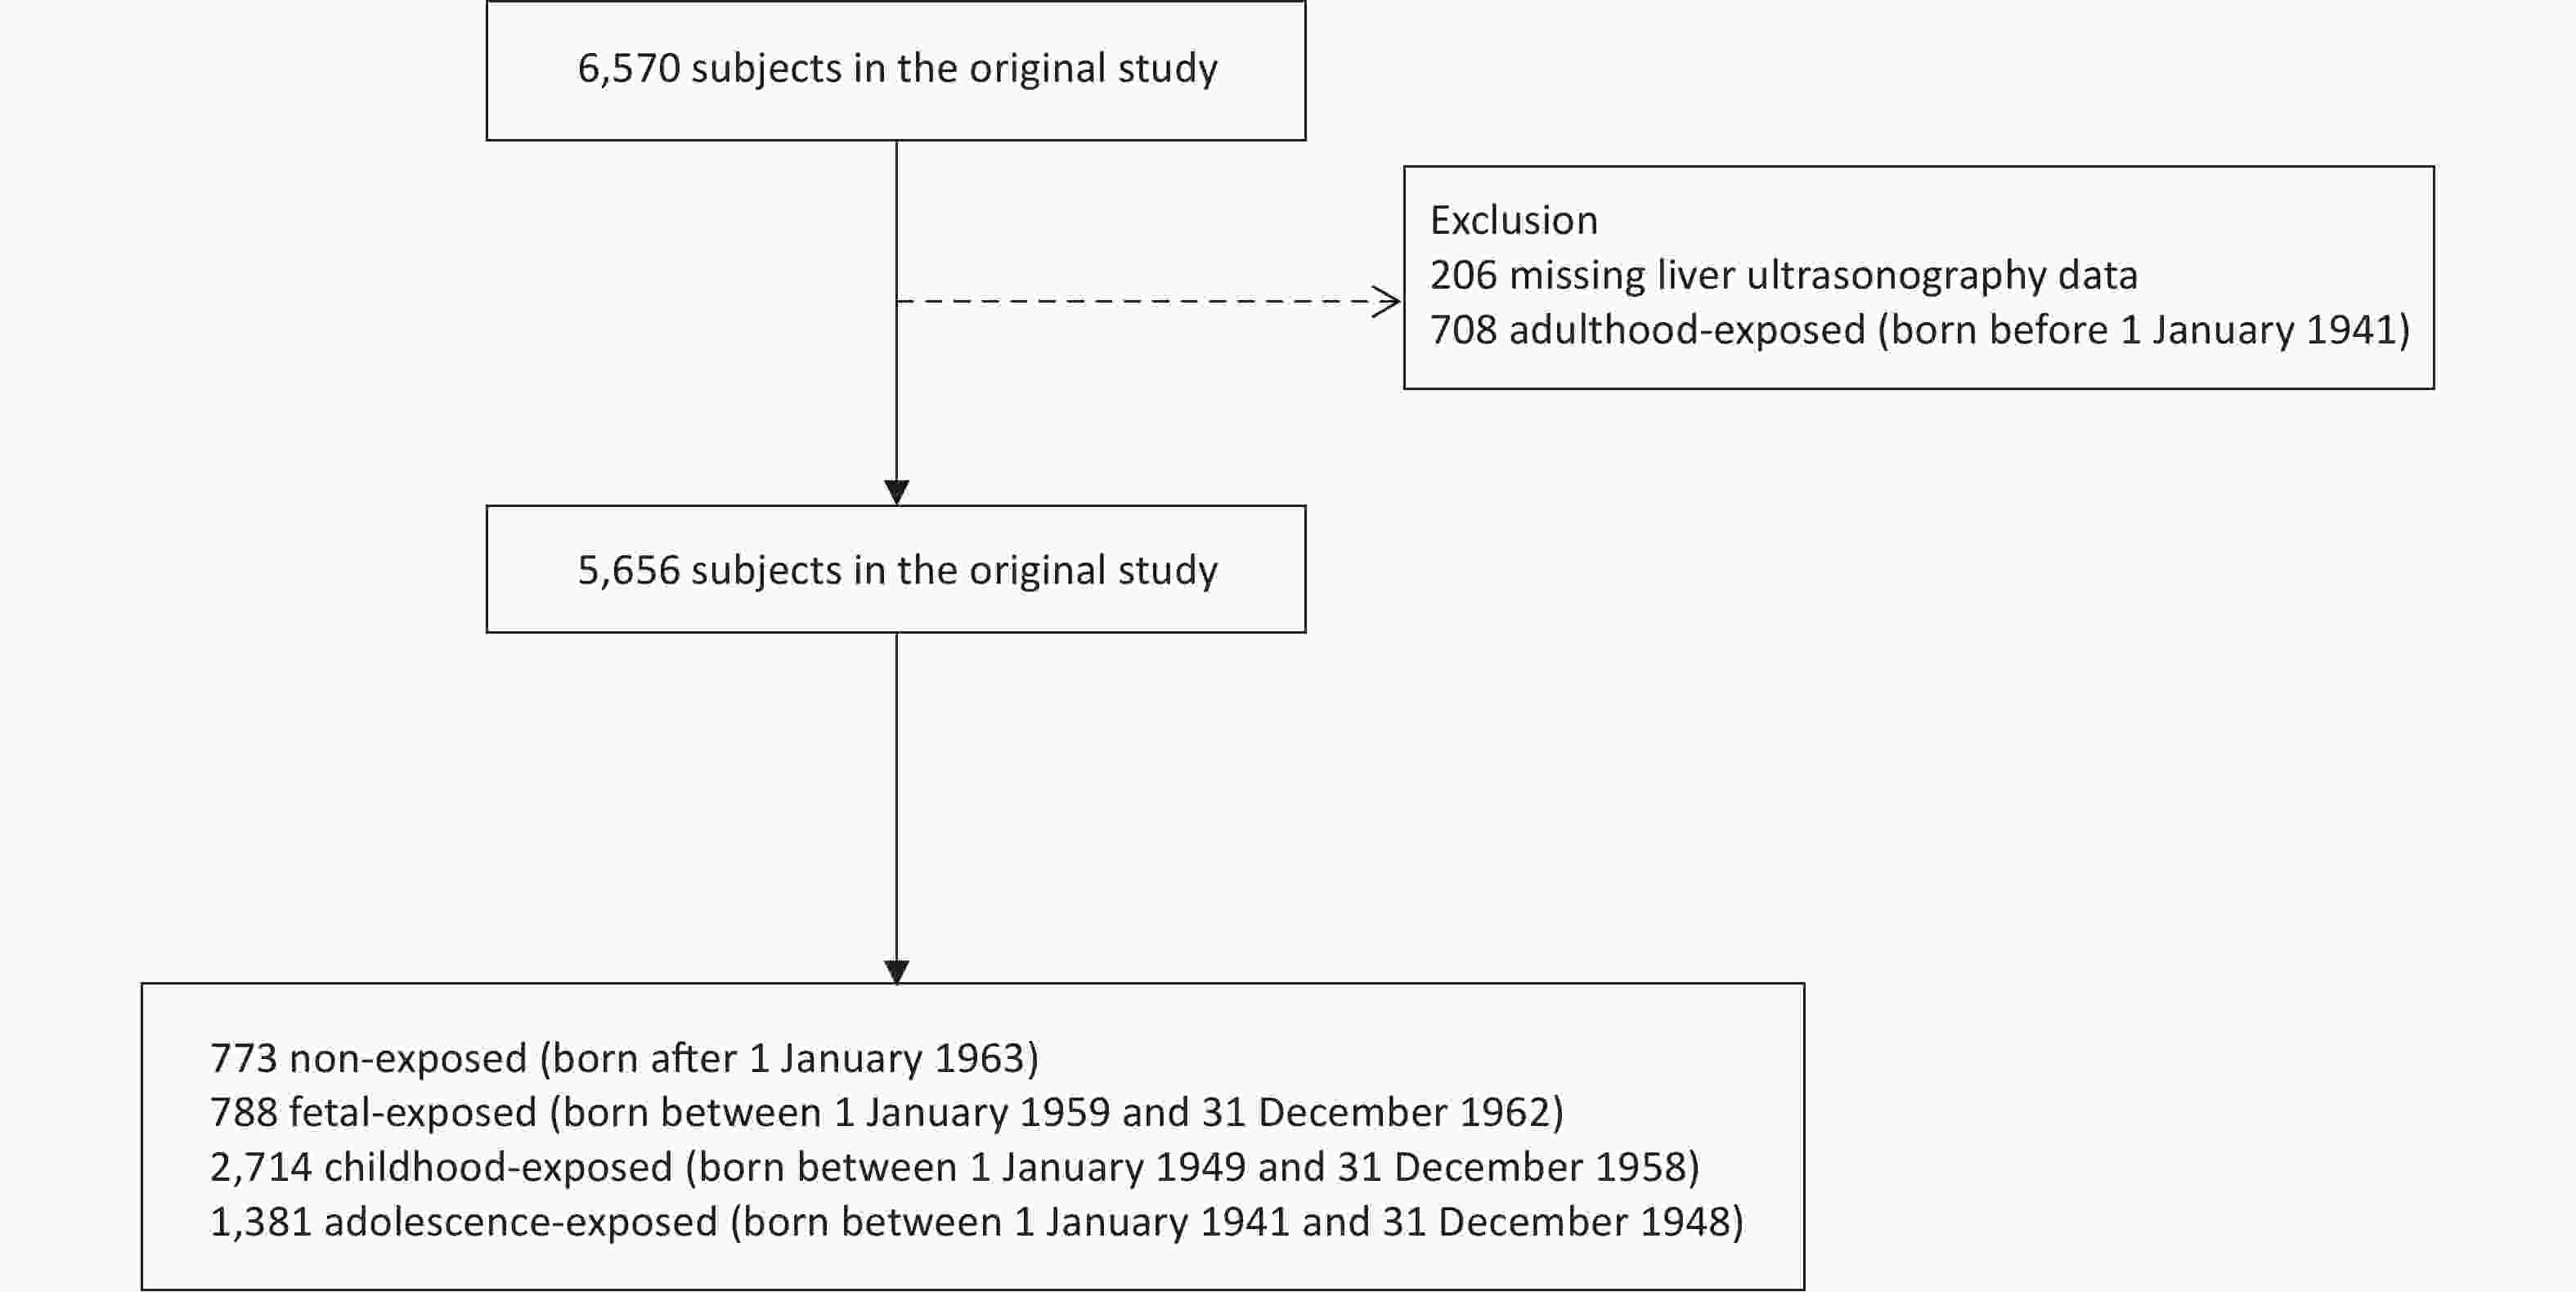
Figure S1. Flow chart of the sampling frame and participants in the famine exposure study.
The study protocol was approved by the Committee on Human Research at Ruijin Hospital, Shanghai Jiaotong University School of Medicine (Ethics committee reference no. 14, 2011). Written informed consent forms were obtained from each participant.
Our questionnaires consisted of basic personal information, medical history, and lifestyle information. The collection and record of questionnaire data were conducted by trained staff through personal interviews. Education levels were divided into two categories: junior high school and below, and high school and above. Those who had smoked at least one cigarette a day or seven cigarettes a week for the past 6 months were defined as current smokers. Those who had drunk at least once a week in the past 6 months were defined as current drinkers. The classification of physical activity was based on the International Physical Activity Questionnaire[6]. Anthropometric assessments such as weight, height, waist circumstance (WC), and blood pressure (BP) were conducted by professional nurses. Two certified radiologists performed abdominal ultrasonography using a 3.5-MHz transducer (Esaote Biomedica). Fasting plasma glucose (FPG) and 2-h plasma glucose (2h PG) were determined by Modular P800 (Roche, Basel, Switzerland). Serum aspartate transaminase (AST), alanine transaminase (ALT), total cholesterol (TC), low-density lipoprotein cholesterol (LDL-C), high-density lipoprotein cholesterol (HDL-C), triglycerides (TG), C-reactive protein (CRP), and serum albumin were measured using Modular E170 (RocheBasel, Switzerland). Specific and detailed information is available in our previous study[7].
According to the birth year, we divided the participants into four groups: non-exposed (1963–1974), fetal-exposed (1959–1962), childhood-exposed (1949–1958), and adolescent-exposed (1941–1948) groups. In addition to the presence of hepatic steatosis diagnosed by ultrasonography, the diagnosis of MALFD met one or more of the following criteria: 1) overweight or obese [body mass index (BMI) ≥ 23 kg/m2], 2) type 2 diabetes mellitus (FPG ≥ 7.0 mmol/L, 2h PG ≥ 11.1 mmol/L, or under glucose-lowering treatment), and 3) evidence of metabolic disorders[2]. Those who had no fewer than two of the following metabolic abnormalities were considered to have metabolic disorders: 1) WC ≥ 90 cm in men and 80 cm in women, 2) BP ≥ 130/85 mmHg or specific drug treatment, 3) TG ≥ 1.70 mmol/L or specific drug treatment, 4) HDL-C < 1.0 mmol/L for men and < 1.3 mmol/L for women, 5) prediabetes (5.6 mmol/L ≤ FPG ≤ 6.9 mmol/L or 7.8 mmol/L ≤ 2h PG ≤ 11.0 mmol/L), 6) a Homeostatic Model Assessment for Insulin Resistance (HOMA-IR) score ≥ 2.5, and 7) CRP > 2 mg/L. The formula for calculating the NAFLD fibrosis score (NFS) was as follows: −1.675 + 0.037 × age (years) + 0.094 × BMI (kg/m2) + 1.13 × impaired fasting glucose or diabetes (yes = 1, no = 0) + 0.99 × AST/ALT ratio – 0.013 × platelet (× 109/L) – 0.66 × serum albumin (g/dL). A score above −1.455 indicated a high risk of developing advanced fibrosis.
Statistical analyses were performed using SAS version 9.4 (SAS Institute). Continuous variables were presented as means ± standard deviation (SD), and categorical variables were presented as counts with percentages (%). The one-way analysis of variance (ANOVA) was used for continuous variables, and the χ2-test was applied to analyze categorical variables. The multivariable-adjusted logistic regression model was performed to determine the association between famine exposure in early life and MAFLD after adjusting for confounding variables including age, sex, smoking, alcohol consumption, education, and physical activity. In addition, the age-balance method as a sensitivity analysis was performed on the association of famine exposure in early life with MAFLD. The results were presented as odds ratio (OR) and 95% confidence interval (CI). Significance was defined as P value < 0.05 (two-tailed).
In the study, a total of 2,014 (35.61%) participants had MAFLD. As listed in Supplementary Table S1 (available in www.besjournal.com), individuals in the MAFLD group had higher levels of BMI, WC, systolic BP, diastolic BP, and glucose indices including HbA1c, FPG, 2h PG, and HOMA-IR. The MAFLD group also had deteriorating atherogenic lipid profiles and liver function, such as higher serum liver enzymes and NFS, than the non-MAFLD group. The prevalence of MAFLD among participants in the non-, fetal-, childhood-, and adolescent-exposed groups were 33.12%, 36.93%, 35.37%, and 36.71%, respectively (Table 1). Among the four groups, the fetal-exposed group had the highest levels of ALT and albumin. The childhood-exposed group experienced higher TC, TG, and LDL-C than the other groups. In addition to higher WC, participants who were exposed to famine in their adolescence had a higher prevalence of diabetes and a higher risk of developing liver fibrosis.
Table 1. Characteristics of the study population by famine exposure in early life
Characteristics Non-exposed Famine exposure
P valueFetal Childhood Adolescence MAFLD, n (%) 256 (33.12) 291 (36.93) 960 (35.37) 507 (36.71) 0.205 Age, year 48.99 ± 2.16 53.96 ± 1.23 60.73 ± 2.82 69.31 ± 2.35 < 0.001* Male (%) 276 (35.71) 272 (34.52) 914 (33.68) 547 (39.61) 0.072 BMI, kg/m2 24.78 ± 3.83 25.01 ± 6.72 25.05 ± 5.65 25.2 ± 4.31 0.370 Waist circumference, cm 82.36 ± 10.55 82.27 ± 9.81 83.15 ± 10.05 85.12 ± 10.22 < 0.001* Diabetes, n (%) 114 (14.75) 166 (21.07) 679 (25.02) 458 (33.16) < 0.001* HbA1c, n (%) 5.52 ± 0.86 5.66 ± 0.78 5.7 ± 0.74 5.83 ± 0.85 < 0.001* FPG, mmol/L 5.93 ± 1.57 6.06 ± 1.48 6.08 ± 1.40 6.29 ± 1.51 < 0.001* 2h PG, mmol/L 8.02 ± 3.43 8.48 ± 3.94 8.78 ± 3.60 9.65 ± 4.02 < 0.001* HOMA-IR 1.85 (1.26−2.71) 1.83 (1.21−2.70) 1.87 (1.27−2.76) 2.00 (1.33−3.00) 0.021* SBP, mmHg 126.94 ± 15.36 128.89 ± 15.67 134.41 ± 16.75 138.77 ± 16.64 < 0.0001* DBP, mmHg 78.16 ± 9.97 77.76 ± 9.29 76.77 ± 9.30 75.03 ± 9.56 < 0.0001* TC, mmol/L 5.10 ± 0.94 5.33 ± 1.05 5.34 ± 0.97 5.29 ± 1.12 < 0.0001* TG, mmol/L 1.44 (1.00−2.09) 1.53 (1.09−2.31) 1.56 (1.13−2.23) 1.51 (1.09−2.10) 0.0016* HDL-C, mmol/L 1.33 ± 0.29 1.33 ± 0.31 1.33 ± 0.30 1.34 ± 0.31 0.8951 LDL-C, mmol/L 3.49 ± 0.75 3.64 ± 0.77 3.65 ± 0.77 3.60 ± 0.86 < 0.0001* ALT, IU/L 21 (15−30) 22 (16−30) 21 (16−29) 20 (15−28) 0.0024* AST, IU/L 23 (20−29) 25 (21−29) 25 (22−30) 26 (22−31) < 0.0001* Albumin, g/L 4.65 ± 0.25 4.67 ± 0.24 4.64 ± 0.25 4.57 ± 0.26 < 0.0001* Platelet, × 109/L 209.43 ± 86.96 199.82 ± 51.20 194.40 ± 55.12 188.68 ± 55.64 < 0.0001* NFS −1.86 ± 1.31 −1.47 ± 1.10 −1.02 ± 1.07 −0.38 ± 0.97 < 0.0001* Current smoker, n (%) 147 (19.02) 148 (18.78) 480 (17.69) 224 (16.22) 0.0682 Current drinker, n (%) 73 (9.79) 74 (9.72) 247 (9.43) 100 (7.58) 0.0789 High school and above, n (%) 170 (22.08) 323 (41.30) 433 (16.03) 232 (16.89) < 0.0001* Moderate and vigorous physical activity, n (%) 82 (10.61) 90 (11.42) 296 (10.91) 153 (11.08) 0.8707 Note. Data are means ± SD or medians (interquartile range) for skewed variables or proportions for categorical variables. *Statistically significant. MAFLD, metabolic dysfunction–associated fatty liver disease; BMI, body mass index; FPG, fasting plasma glucose; 2h PG, 2h plasma glucose; HOMA-IR, homeostasis model assessment of insulin resistance; SBP, systolic blood pressure; DBP, diastolic blood pressure; TC, total cholesterol; TG, triglyceride; HDL-C, high-density lipoprotein cholesterol; LDL-C, low-density lipoprotein cholesterol; ALT, alanine transaminase; AST, aspartate transaminase; NFS, NAFLD fibrosis score. Table S1. Baseline characteristics by MAFLD
Characteristics Non-MAFLD MAFLD P value N (%) 3,642 (64.39) 2,014 (35.61) Age, n (year) 60.12 ± 7.08 60.35 ± 6.86 0.2562 Male, n (%) 1,290 (35.42) 719 (35.70) 0.8331 BMI (kg/m2) 23.94 ± 4.51 27.04 ± 6.00 < 0.0001* Waist circumference (cm) 80.54 ± 9.42 88.56 ± 9.44 < 0.0001* Diabetes, n (%) 626 (17.19) 791 (39.28) < 0.0001* HbA1c, n (%) 5.56 ± 0.66 5.95 ± 0.94 < 0.0001* FPG, mmol/L 5.88 ± 1.23 6.53 ± 1.75 < 0.0001* 2h PG, mmol/L 8.03 ± 3.29 10.33 ± 4.13 < 0.0001* HOMA-IR 1.53 (1.09-2.16) 2.73 (2.00-3.92) < 0.0001* SBP, mmHg 131.30 ± 16.88 137.97 ± 15.96 < 0.0001* DBP, mmHg 75.79 ± 9.47 78.28 ± 9.38 < 0.0001* TC, mmol/L 5.23 ± 0.97 5.39 ± 1.10 < 0.0001* TG, mmol/L 1.33 (0.98-1.84) 1.97 (1.46-2.82) < 0.0001* HDL-C, mmol/L 1.39 ± 0.31 1.24 ± 0.26 < 0.0001* LDL-C, mmol/L 3.55 ± 0.78 3.72 ± 0.81 < 0.0001* ALT, IU/L 18 (14-24) 26 (20-38) < 0.0001* AST, IU/L 24 (21-29) 27 (23-33) < 0.0001* Albumin, g/L 46.14 ± 2.52 46.54 ± 2.55 < 0.0001* Platelet, × 109/L 191.96 ± 63.11 202.75 ± 54.57 < 0.0001* NFS −1.21 ± 1.15 −1.13 ± 1.17 0.0173* Current smoker, n (%) 631 (17.33) 368 (18.27) 0.3715 Current drinker, n (%) 310 (8.87) 184 (9.44) 0.4856 High school and above, n (%) 760 (20.94) 398 (19.92) 0.3666 Moderate and vigorous physical activity, n (%) 366 (10.05) 255 (12.66) 0.0026* Note. Data were means ± SD or medians (interquartile range) for skewed variables or proportions for categorical variables. *Statistically significant. MAFLD, metabolic dysfunction–associated fatty liver disease; BMI, body mass index; FPG, fasting plasma glucose; 2h PG, 2h plasma glucose; HOMA-IR, homeostasis model assessment of insulin resistance; SBP, systolic blood pressure; DBP, diastolic blood pressure; TC, total cholesterol; TG, triglyceride; HDL-C, high-density lipoprotein cholesterol; LDL-C, low-density lipoprotein cholesterol; ALT, alanine transaminase; AST, aspartate transaminase; NFS, NAFLD fibrosis score. As shown in Table 2, early-life famine exposure was associated with the risk of MAFLD in women. In the unadjusted model, the ORs (95% CIs) of MAFLD were 1.63 (1.24–2.15), 1.78 (1.42–2.23), and 2.05 (1.60–2.63) in the fetal-, childhood-, and adolescent-exposed groups among women, respectively. After further adjustment for age, sex, smoking, alcohol consumption, education, and physical activity, the fetal-exposed group had an increased risk of MAFLD in adulthood [ORs (95% CI) 1.56 (1.12–2.17)]. However, no significant associations between early-life famine exposure and MAFLD were observed in the overall population or in men. Furthermore, we used the age-balance method to decrease the effects of age on outcomes. As shown in Supplementary Table S2 (available in www.besjournal.com), the fetal-exposed group was associated with MAFLD among women.
Table 2. ORs (95% CIs) for MAFLD according to famine exposure in early life among 5,656 participants
Model Non-exposed Famine exposure Fetal Childhood Adolescence Whole cohort Case/Total 256/773 291/788 960/2,714 507/1,381 Model 1 1.00 (ref) 1.18 (0.96–1.46) 1.11 (0.93–1.31) 1.17 (0.97–1.41) Model 2 1.00 (ref) 1.18 (0.93–1.50) 1.14 (0.83–1.57) 1.22 (0.74–2.02) Model 3 1.00 (ref) 1.22 (0.95–1.57) 1.17 (0.84–1.63) 1.28 (0.76–2.15) Men 134/276 112/272 300/914 173/547 Model 1 1.00 (ref) 0.74 (0.53–1.04) 0.52 (0.39–0.68) 0.49 (0.36–0.66) Model 2 1.00 (ref) 0.93 (0.62–1.38) 0.85 (0.50–1.45) 1.14 (0.49–2.66) Model 3 1.00 (ref) 0.90 (0.60–1.35) 0.87 (0.51–1.50) 1.16 (0.49–2.76) Women 122/497 179/516 660/1,800 334/834 Model 1 1.00 (ref) 1.63 (1.24–2.15) 1.78 (1.42–2.23) 2.05 (1.60–2.63) Model 2 1.00 (ref) 1.46 (1.06–2.00) 1.44 (0.95–2.17) 1.39 (0.73–2.63) Model 3 1.00 (ref) 1.56 (1.12–2.17) 1.49 (0.98–2.27) 1.50 (0.78–2.89) Note. Model 1: unadjusted. Model 2: adjusted for age and sex. Model 3: adjusted for sex, age, smoking, alcohol consumption, education and physical activity. MAFLD, metabolic dysfunction-associated fatty liver disease. Table S2. ORs (95% CIs) for MAFLD according to famine exposure in early life using the younger and older groups as reference
Model Nonexposed (1963–1970)
+ Adolescent-exposed (1945–1948)Fetal-exposed
(1959–1962)Childhood-exposed
(1955–1958)Whole cohort Case/Total 574/1,590 291/788 356/1,037 Model 1 1.00 (ref) 1.04 (0.87–1.24) 0.93 (0.79–1.09) Model 2 1.00 (ref) 1.11 (0.92–1.33) 0.94 (0.80–1.11) Model 3 1.00 (ref) 1.13 (0.93-1.37) 0.95 (0.80–1.13) Men Case/Total 243/591 112/272 118/349 Model 1 1.00 (ref) 1.00 (0.75–1.34) 0.73 (0.56–0.96) Model 2 1.00 (ref) 0.86 (0.64–1.17) 0.71 (0.54–0.94) Model 3 1.00 (ref) 0.83 (0.61–1.13) 0.71 (0.54–0.95) Women Case/Total 331/999 179/516 238/688 Model 1 1.00 (ref) 1.07 (0.86–1.34) 1.07 (0.87–1.31) Model 2 1.00 (ref) 1.32 (1.04–1.68) 1.12 (0.91–1.38) Model 3 1.00 (ref) 1.39 (1.09–1.79) 1.14 (0.92–1.41) Note. Model 1: unadjusted. Model 2: adjusted for age, sex. Model 3: adjusted for sex, age, smoking, alcohol consumption, education and physical activity. MAFLD, metabolic dysfunction–associated fatty liver disease. We further explored the association between famine exposure in early life and the severity of MAFLD. In the multivariable-adjusted logistic regression model, the ORs (95% CI) for MAFLD with NFS > −1.455 were 1.50 (1.06–2.13), 1.74 (1.15–2.63), and 1.95 (1.05–3.61) in the fetal-, childhood-, and adolescent-exposed groups among the overall population, respectively (Table 3). In men, the fetal-exposed group was associated with an increased risk of MAFLD and liver fibrosis [ORs (95% CI) 1.94 (1.15–3.29)]. In women, no significant association was found between the fetal-exposed group and the risk of MAFLD with liver fibrosis [ORs (95% CI) 1.30 (0.82–2.07)].
Table 3. Association between early-life famine exposure and NAFLD fibrosis score
Model Non-exposed Famine exposure Fetal Childhood Adolescence MAFLD with NFS > −1.455 Whole cohort 74/773 124/788 576/2,714 388/1,381 Model 1 1.00 (ref) 1.76 (1.30−2.40) 2.55 (1.97−3.29) 3.69 (2.83−4.82) Model 2 1.00 (ref) 1.48 (1.06−2.06) 1.70 (1.13−2.55) 1.84 (1.01−2.55) Model 3 1.00 (ref) 1.50 (1.06−2.13) 1.74 (1.15−2.63) 1.95 (1.05−3.61) MAFLD with NFS > −1.455 Men 36/276 58/272 190/914 137/547 Model 1 1.00 (ref) 1.81 (1.15−2.85) 1.75 (1.19−2.57) 2.23 (1.49−3.32) Model 2 1.00 (ref) 1.89 (1.14−3.14) 1.82 (0.95−3.49) 2.35 (0.88−6.30) Model 3 1.00 (ref) 1.94 (1.15−3.29) 1.98 (1.02−3.84) 2.63 (0.96−7.20) MAFLD with NFS > −1.455 Women 38/497 66/516 386/1,800 251/834 Model 1 1.00 (ref) 1.77 (1.16−2.70) 3.30 (2.33−4.68) 5.20 (3.62−7.47) Model 2 1.00 (ref) 1.31 (0.83−2.06) 1.71 (1.01−2.90) 1.71 (0.80−3.67) Model 3 1.00 (ref) 1.30 (0.82−2.07) 1.68 (0.99−2.87) 1.74 (0.80−3.80) Note. Model 1: unadjusted. Model 2: adjusted for age and sex. Model 3: adjusted for sex, age, smoking, alcohol consumption, education and physical activity. MAFLD, metabolic dysfunction–associated fatty liver disease. NFS, NAFLD fibrosis score. From this community-dwelling Chinese population, we observed that those women who underwent the Great Chinese Famine during the fetal period were more susceptible to developing MALFD later in life than those who were not exposed to the famine. Moreover, fetal exposure to famine increased the risk for MAFLD with liver fibrosis in adult men. To the best of our knowledge, this is the first study to shed light on the association of early-life famine exposure with the risk of MAFLD and liver fibrosis in later life. Sex differences were noted in the relationship between famine exposure and diseases. The increased risks of overweight, obesity, metabolic dysregulation, and moderate-to-severe steatosis were obvious only in women[8]. Additionally, a study revealed that a positive association between prenatal undernutrition and small brain volume was restricted to men[9]. From the perspective of epigenomics, epigenetic effects caused by early-life malnutrition had differences between sexes. These sex-specific changes led to different predispositions to disease[10]. Another potential explanation for sexual dimorphism was selective participation in different cohorts. Further studies are needed to explore the association and mechanism of famine exposure in early life and MAFLD.
The study has several strengths. First, compared with the Dutch famine, the Chinese famine influenced more people for 3 years, which made the cohort more representative and credible. Second, the considerable sample size of this cohort allowed us to stratify the included population and adjust for more confounding factors.
The study also had some limitations. First, men who were disproportionately valued by their parents were liable to have a healthy foundation. The bias may obscure the conclusions of the study. Second, although we conducted the age-balance method, we were unable to fully balance the age difference between groups. Third, although we adjusted for some confounding factors such as age, sex, smoking, alcohol consumption, education, and physical activity, other confounders such as income, social status, and dietary habits were not considered in our analysis.
Our findings suggested that fetal famine exposure was associated with MAFLD risk in women, whereas men who were exposed to famine during the fetal period had an increased risk of MAFLD with liver fibrosis. More efforts are needed to investigate whether these sex differences result from biological diversity between sexes or certain biases in cohorts. Rational nutrition supplement during pregnancy is necessary to support the health conditions of future generations.
No potential conflicts of interest were disclosed.
Thanks were due to all the efforts of the participants of this study.
WEI Ran, QI Hong Yan, LIN Lin, CHEN Yu Hong, and LU Jie Li contributed to the research design. WEI Ran, QI Hong Yan, and LIN Lin conducted the data analysis and completed the manuscript. XU Min and XU Yu took part in the collection, interpretation, and management of the data. ZHU Yuan Yue, ZHANG Yi, ZHANG Jie, WU Xue Yan, HU Chun Yan, WANG Shuang Yuan, and LIN Hong assisted in the completion of data collection. WANG Wei Qing, LU Jie Li, CHEN Yu Hong, and NING Guang critically revised the manuscript. All authors have approved the publication of the final version.
doi: 10.3967/bes2022.075
Association of Early-Life Famine Exposure with Metabolic Dysfunction-Associated Fatty Liver Disease and Fibrosis in Adulthood
-
&These authors contributed equally to this work.
注释: -
Table 1. Characteristics of the study population by famine exposure in early life
Characteristics Non-exposed Famine exposure
P valueFetal Childhood Adolescence MAFLD, n (%) 256 (33.12) 291 (36.93) 960 (35.37) 507 (36.71) 0.205 Age, year 48.99 ± 2.16 53.96 ± 1.23 60.73 ± 2.82 69.31 ± 2.35 < 0.001* Male (%) 276 (35.71) 272 (34.52) 914 (33.68) 547 (39.61) 0.072 BMI, kg/m2 24.78 ± 3.83 25.01 ± 6.72 25.05 ± 5.65 25.2 ± 4.31 0.370 Waist circumference, cm 82.36 ± 10.55 82.27 ± 9.81 83.15 ± 10.05 85.12 ± 10.22 < 0.001* Diabetes, n (%) 114 (14.75) 166 (21.07) 679 (25.02) 458 (33.16) < 0.001* HbA1c, n (%) 5.52 ± 0.86 5.66 ± 0.78 5.7 ± 0.74 5.83 ± 0.85 < 0.001* FPG, mmol/L 5.93 ± 1.57 6.06 ± 1.48 6.08 ± 1.40 6.29 ± 1.51 < 0.001* 2h PG, mmol/L 8.02 ± 3.43 8.48 ± 3.94 8.78 ± 3.60 9.65 ± 4.02 < 0.001* HOMA-IR 1.85 (1.26−2.71) 1.83 (1.21−2.70) 1.87 (1.27−2.76) 2.00 (1.33−3.00) 0.021* SBP, mmHg 126.94 ± 15.36 128.89 ± 15.67 134.41 ± 16.75 138.77 ± 16.64 < 0.0001* DBP, mmHg 78.16 ± 9.97 77.76 ± 9.29 76.77 ± 9.30 75.03 ± 9.56 < 0.0001* TC, mmol/L 5.10 ± 0.94 5.33 ± 1.05 5.34 ± 0.97 5.29 ± 1.12 < 0.0001* TG, mmol/L 1.44 (1.00−2.09) 1.53 (1.09−2.31) 1.56 (1.13−2.23) 1.51 (1.09−2.10) 0.0016* HDL-C, mmol/L 1.33 ± 0.29 1.33 ± 0.31 1.33 ± 0.30 1.34 ± 0.31 0.8951 LDL-C, mmol/L 3.49 ± 0.75 3.64 ± 0.77 3.65 ± 0.77 3.60 ± 0.86 < 0.0001* ALT, IU/L 21 (15−30) 22 (16−30) 21 (16−29) 20 (15−28) 0.0024* AST, IU/L 23 (20−29) 25 (21−29) 25 (22−30) 26 (22−31) < 0.0001* Albumin, g/L 4.65 ± 0.25 4.67 ± 0.24 4.64 ± 0.25 4.57 ± 0.26 < 0.0001* Platelet, × 109/L 209.43 ± 86.96 199.82 ± 51.20 194.40 ± 55.12 188.68 ± 55.64 < 0.0001* NFS −1.86 ± 1.31 −1.47 ± 1.10 −1.02 ± 1.07 −0.38 ± 0.97 < 0.0001* Current smoker, n (%) 147 (19.02) 148 (18.78) 480 (17.69) 224 (16.22) 0.0682 Current drinker, n (%) 73 (9.79) 74 (9.72) 247 (9.43) 100 (7.58) 0.0789 High school and above, n (%) 170 (22.08) 323 (41.30) 433 (16.03) 232 (16.89) < 0.0001* Moderate and vigorous physical activity, n (%) 82 (10.61) 90 (11.42) 296 (10.91) 153 (11.08) 0.8707 Note. Data are means ± SD or medians (interquartile range) for skewed variables or proportions for categorical variables. *Statistically significant. MAFLD, metabolic dysfunction–associated fatty liver disease; BMI, body mass index; FPG, fasting plasma glucose; 2h PG, 2h plasma glucose; HOMA-IR, homeostasis model assessment of insulin resistance; SBP, systolic blood pressure; DBP, diastolic blood pressure; TC, total cholesterol; TG, triglyceride; HDL-C, high-density lipoprotein cholesterol; LDL-C, low-density lipoprotein cholesterol; ALT, alanine transaminase; AST, aspartate transaminase; NFS, NAFLD fibrosis score.  下载: 导出CSV
S1. Baseline characteristics by MAFLD
Characteristics Non-MAFLD MAFLD P value N (%) 3,642 (64.39) 2,014 (35.61) Age, n (year) 60.12 ± 7.08 60.35 ± 6.86 0.2562 Male, n (%) 1,290 (35.42) 719 (35.70) 0.8331 BMI (kg/m2) 23.94 ± 4.51 27.04 ± 6.00 < 0.0001* Waist circumference (cm) 80.54 ± 9.42 88.56 ± 9.44 < 0.0001* Diabetes, n (%) 626 (17.19) 791 (39.28) < 0.0001* HbA1c, n (%) 5.56 ± 0.66 5.95 ± 0.94 < 0.0001* FPG, mmol/L 5.88 ± 1.23 6.53 ± 1.75 < 0.0001* 2h PG, mmol/L 8.03 ± 3.29 10.33 ± 4.13 < 0.0001* HOMA-IR 1.53 (1.09-2.16) 2.73 (2.00-3.92) < 0.0001* SBP, mmHg 131.30 ± 16.88 137.97 ± 15.96 < 0.0001* DBP, mmHg 75.79 ± 9.47 78.28 ± 9.38 < 0.0001* TC, mmol/L 5.23 ± 0.97 5.39 ± 1.10 < 0.0001* TG, mmol/L 1.33 (0.98-1.84) 1.97 (1.46-2.82) < 0.0001* HDL-C, mmol/L 1.39 ± 0.31 1.24 ± 0.26 < 0.0001* LDL-C, mmol/L 3.55 ± 0.78 3.72 ± 0.81 < 0.0001* ALT, IU/L 18 (14-24) 26 (20-38) < 0.0001* AST, IU/L 24 (21-29) 27 (23-33) < 0.0001* Albumin, g/L 46.14 ± 2.52 46.54 ± 2.55 < 0.0001* Platelet, × 109/L 191.96 ± 63.11 202.75 ± 54.57 < 0.0001* NFS −1.21 ± 1.15 −1.13 ± 1.17 0.0173* Current smoker, n (%) 631 (17.33) 368 (18.27) 0.3715 Current drinker, n (%) 310 (8.87) 184 (9.44) 0.4856 High school and above, n (%) 760 (20.94) 398 (19.92) 0.3666 Moderate and vigorous physical activity, n (%) 366 (10.05) 255 (12.66) 0.0026* Note. Data were means ± SD or medians (interquartile range) for skewed variables or proportions for categorical variables. *Statistically significant. MAFLD, metabolic dysfunction–associated fatty liver disease; BMI, body mass index; FPG, fasting plasma glucose; 2h PG, 2h plasma glucose; HOMA-IR, homeostasis model assessment of insulin resistance; SBP, systolic blood pressure; DBP, diastolic blood pressure; TC, total cholesterol; TG, triglyceride; HDL-C, high-density lipoprotein cholesterol; LDL-C, low-density lipoprotein cholesterol; ALT, alanine transaminase; AST, aspartate transaminase; NFS, NAFLD fibrosis score.
下载: 导出CSV
Table 2. ORs (95% CIs) for MAFLD according to famine exposure in early life among 5,656 participants
Model Non-exposed Famine exposure Fetal Childhood Adolescence Whole cohort Case/Total 256/773 291/788 960/2,714 507/1,381 Model 1 1.00 (ref) 1.18 (0.96–1.46) 1.11 (0.93–1.31) 1.17 (0.97–1.41) Model 2 1.00 (ref) 1.18 (0.93–1.50) 1.14 (0.83–1.57) 1.22 (0.74–2.02) Model 3 1.00 (ref) 1.22 (0.95–1.57) 1.17 (0.84–1.63) 1.28 (0.76–2.15) Men 134/276 112/272 300/914 173/547 Model 1 1.00 (ref) 0.74 (0.53–1.04) 0.52 (0.39–0.68) 0.49 (0.36–0.66) Model 2 1.00 (ref) 0.93 (0.62–1.38) 0.85 (0.50–1.45) 1.14 (0.49–2.66) Model 3 1.00 (ref) 0.90 (0.60–1.35) 0.87 (0.51–1.50) 1.16 (0.49–2.76) Women 122/497 179/516 660/1,800 334/834 Model 1 1.00 (ref) 1.63 (1.24–2.15) 1.78 (1.42–2.23) 2.05 (1.60–2.63) Model 2 1.00 (ref) 1.46 (1.06–2.00) 1.44 (0.95–2.17) 1.39 (0.73–2.63) Model 3 1.00 (ref) 1.56 (1.12–2.17) 1.49 (0.98–2.27) 1.50 (0.78–2.89) Note. Model 1: unadjusted. Model 2: adjusted for age and sex. Model 3: adjusted for sex, age, smoking, alcohol consumption, education and physical activity. MAFLD, metabolic dysfunction-associated fatty liver disease.
下载: 导出CSV
S2. ORs (95% CIs) for MAFLD according to famine exposure in early life using the younger and older groups as reference
Model Nonexposed (1963–1970)
+ Adolescent-exposed (1945–1948)Fetal-exposed
(1959–1962)Childhood-exposed
(1955–1958)Whole cohort Case/Total 574/1,590 291/788 356/1,037 Model 1 1.00 (ref) 1.04 (0.87–1.24) 0.93 (0.79–1.09) Model 2 1.00 (ref) 1.11 (0.92–1.33) 0.94 (0.80–1.11) Model 3 1.00 (ref) 1.13 (0.93-1.37) 0.95 (0.80–1.13) Men Case/Total 243/591 112/272 118/349 Model 1 1.00 (ref) 1.00 (0.75–1.34) 0.73 (0.56–0.96) Model 2 1.00 (ref) 0.86 (0.64–1.17) 0.71 (0.54–0.94) Model 3 1.00 (ref) 0.83 (0.61–1.13) 0.71 (0.54–0.95) Women Case/Total 331/999 179/516 238/688 Model 1 1.00 (ref) 1.07 (0.86–1.34) 1.07 (0.87–1.31) Model 2 1.00 (ref) 1.32 (1.04–1.68) 1.12 (0.91–1.38) Model 3 1.00 (ref) 1.39 (1.09–1.79) 1.14 (0.92–1.41) Note. Model 1: unadjusted. Model 2: adjusted for age, sex. Model 3: adjusted for sex, age, smoking, alcohol consumption, education and physical activity. MAFLD, metabolic dysfunction–associated fatty liver disease.
下载: 导出CSV
Table 3. Association between early-life famine exposure and NAFLD fibrosis score
Model Non-exposed Famine exposure Fetal Childhood Adolescence MAFLD with NFS > −1.455 Whole cohort 74/773 124/788 576/2,714 388/1,381 Model 1 1.00 (ref) 1.76 (1.30−2.40) 2.55 (1.97−3.29) 3.69 (2.83−4.82) Model 2 1.00 (ref) 1.48 (1.06−2.06) 1.70 (1.13−2.55) 1.84 (1.01−2.55) Model 3 1.00 (ref) 1.50 (1.06−2.13) 1.74 (1.15−2.63) 1.95 (1.05−3.61) MAFLD with NFS > −1.455 Men 36/276 58/272 190/914 137/547 Model 1 1.00 (ref) 1.81 (1.15−2.85) 1.75 (1.19−2.57) 2.23 (1.49−3.32) Model 2 1.00 (ref) 1.89 (1.14−3.14) 1.82 (0.95−3.49) 2.35 (0.88−6.30) Model 3 1.00 (ref) 1.94 (1.15−3.29) 1.98 (1.02−3.84) 2.63 (0.96−7.20) MAFLD with NFS > −1.455 Women 38/497 66/516 386/1,800 251/834 Model 1 1.00 (ref) 1.77 (1.16−2.70) 3.30 (2.33−4.68) 5.20 (3.62−7.47) Model 2 1.00 (ref) 1.31 (0.83−2.06) 1.71 (1.01−2.90) 1.71 (0.80−3.67) Model 3 1.00 (ref) 1.30 (0.82−2.07) 1.68 (0.99−2.87) 1.74 (0.80−3.80) Note. Model 1: unadjusted. Model 2: adjusted for age and sex. Model 3: adjusted for sex, age, smoking, alcohol consumption, education and physical activity. MAFLD, metabolic dysfunction–associated fatty liver disease. NFS, NAFLD fibrosis score.
下载: 导出CSV
-
[1] Zhou F, Zhou J, Wang W, et al. Unexpected Rapid Increase in the Burden of NAFLD in China From 2008 to 2018: A Systematic Review and Meta-Analysis. Hepatology, 2019; 70, 1119−33. doi: 10.1002/hep.30702 [2] Eslam M, Newsome PN, Sarin SK, et al. A new definition for metabolic dysfunction-associated fatty liver disease: An international expert consensus statement. J Hepatol, 2020; 73, 202−9. doi: 10.1016/j.jhep.2020.03.039 [3] Estes C, Anstee QM, Arias-Loste MT, et al. Modeling NAFLD disease burden in China, France, Germany, Italy, Japan, Spain, United Kingdom, and United States for the period 2016-2030. J Hepatol, 2018; 69, 896−904. doi: 10.1016/j.jhep.2018.05.036 [4] Zimmet P, Shi Z, El-Osta A, et al. Epidemic T2DM, early development and epigenetics: implications of the Chinese Famine. Nat Rev Endocrinol, 2018; 14, 738−46. doi: 10.1038/s41574-018-0106-1 [5] Qi H, Hu C, Wang S, et al. Early life famine exposure, adulthood obesity patterns and the risk of nonalcoholic fatty liver disease. Liver Int, 2020; 40, 2694−705. doi: 10.1111/liv.14572 [6] Tomioka K, Iwamoto J, Saeki K, et al. Reliability and validity of the International Physical Activity Questionnaire (IPAQ) in elderly adults: the Fujiwara-kyo Study. J Epidemiol, 2011; 21, 459−65. doi: 10.2188/jea.JE20110003 [7] Zhu W, Deng CJ, Xuan LP, et al. Peripheral Artery Disease and Risk of Fibrosis Deterioration in Nonalcoholic Fatty Liver Disease: A Prospective Investigation. Biomed Environ Sci, 2020; 33, 217−26. [8] Hidayat K, Du X, Shi BM, et al. Foetal and childhood exposure to famine and the risks of cardiometabolic conditions in adulthood: A systematic review and meta-analysis of observational studies. Obes Rev, 2020; 21, e12981. [9] De Rooij SR, Caan M WA, Swaab DF, et al. Prenatal famine exposure has sex-specific effects on brain size. Brain, 2016; 139, 2136−42. doi: 10.1093/brain/aww132 [10] Tobi EW, Lumey LH, Talens RP, et al. DNA methylation differences after exposure to prenatal famine are common and timing- and sex-specific. Hum Mol Genet, 2009; 18, 4046−53. doi: 10.1093/hmg/ddp353 -
 21470Supplementary Materials.pdf

-

 点击查看大图
图(1) / 表ll (5)
计量
- 文章访问数: 819
- HTML全文浏览量: 356
- PDF下载量: 56
- 被引次数: 0

 Quick Links