

 下载:
下载:


-
Climate change is one of the major challenges humanity faces, and its impacts on the environment and human health have attracted global attention[1,2]. The 29th United Nations Climate Change conference (commonly known as COP29) was held in Baku, Azerbaijan, from 11 to 24 November 2024, which aims to limit global warming to 1.5 °C, emphasizing the urgent need for investment in climate action (www.unfccc.int/cop29). As the biggest emitter of greenhouse gases, China has become a focus of climate change mitigation in the world. With the population of over 1.4 billion, the nature-human relations have been constantly under substantial pressure in China[1,2]. For instance, although there are only 7% of the global arable land, China feeds 20% of the world population[3]. Thus, climate change is an environmental hazard of growing importance, and is increasingly impacting socioeconomic development, food security and human health and welfare.
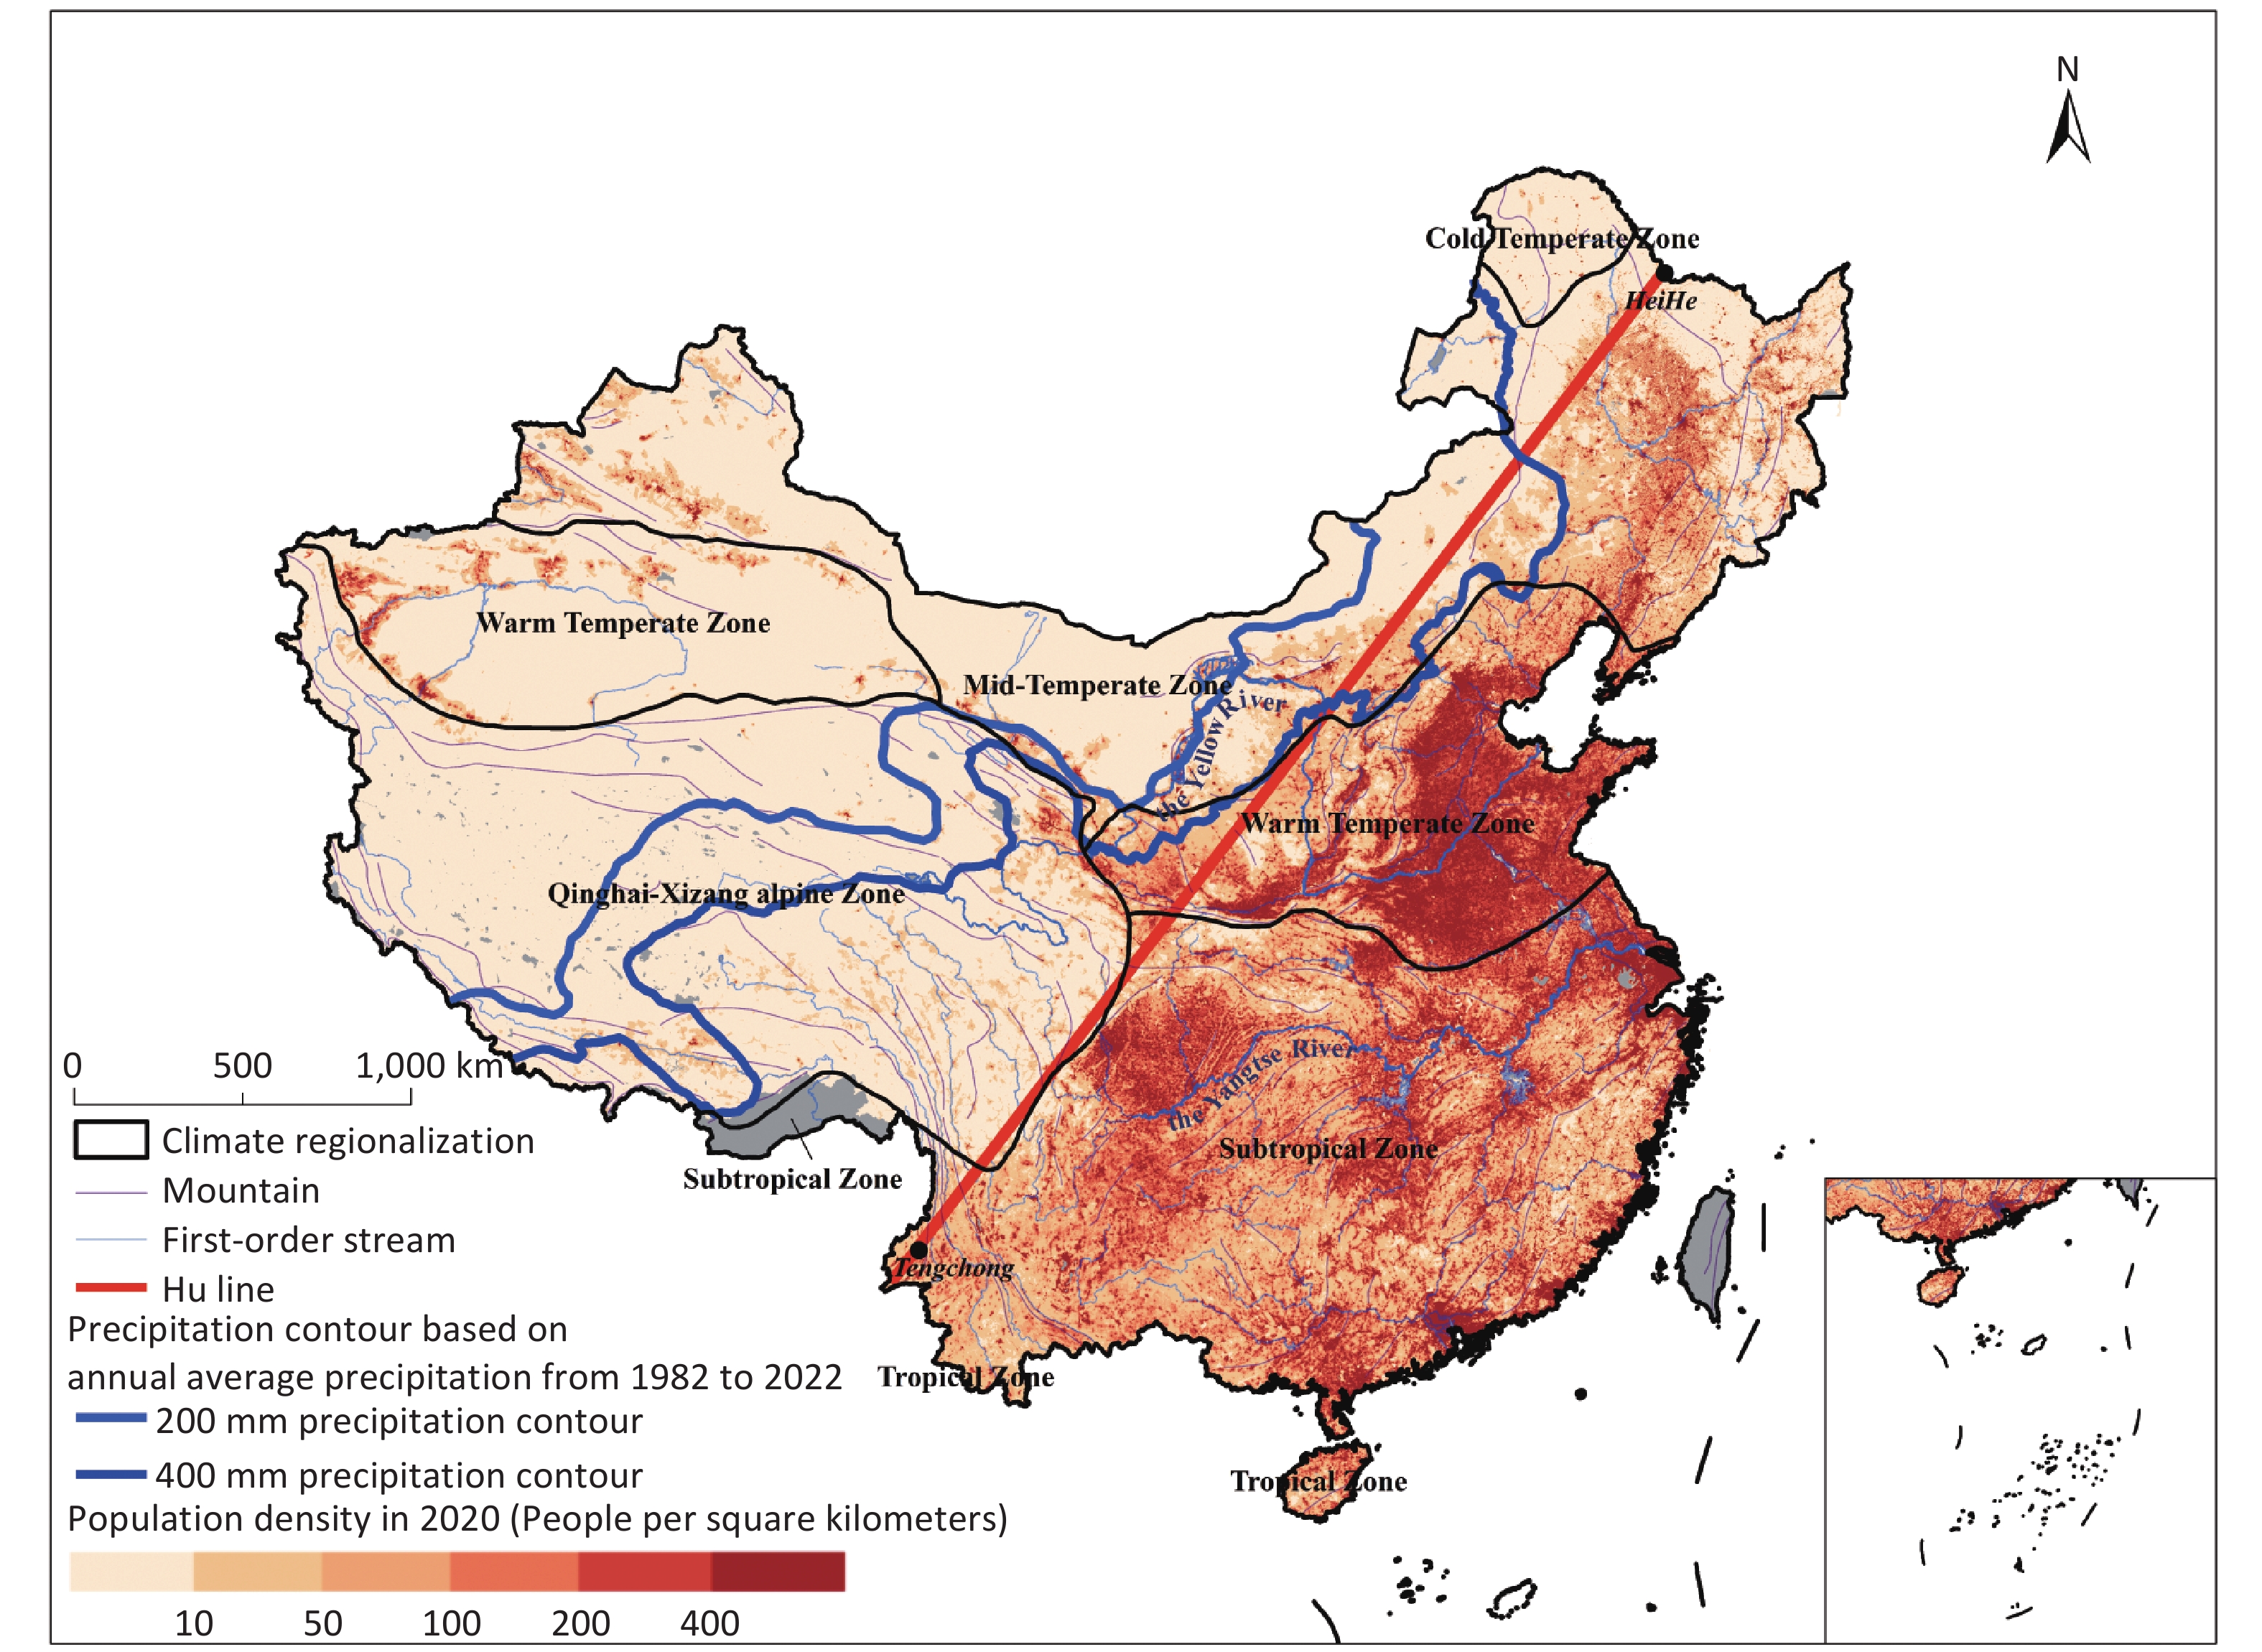
In China, there is a distinct difference in climate and population density between the southeast, where climate is warm and the population density is high, and the northwest where climate is cold and the population density is low (Figure 1). Both the 200 and 400 mm precipitation contours, constructed on the basis of annual average precipitation over the period of 1982–2022 (www.geodata.cn), indicate the heterogeneity of precipitation across China – viz. relatively plentiful precipitation in the south but very low precipitation in the west. The “Haihe-Tengchong Line”, also known as the “Hu (Huanyong) Line”, marks a striking difference in the distribution of China’s population, biogeography, and socioeconomic development[4,5]. From 1901 to 2023, the annual mean surface air temperature in China exhibited a significantly upward trend, with a rate of 0.17 °C per decade[6]. During 1961–2023, the mean surface air temperatures were consistently on the rise across China, but the warming rates differed greatly by region. The warming rate in northern China was significantly higher than that in the southern region, and it was higher in western China than in the eastern region. Over the past decades, China has experienced many detrimental climate extremes[6]. For example, in 2023, meteorological disasters across the country affected an area of more than 10 million hectares of crops, resulting in an economic loss of over US$46 billion with significant damages to human welfare[7]. Climate change increases glacial melt, which may lead to the redistribution of freshwater over China[8]. As a result, it will likely affect future river runoff, irrigation capacity, crop production, and water-borne diseases across the country. In 2023, the average number of heatwave exposure days/person reached 16 days, which is over three times the historical average (1986–2005), resulting in 1.9 times higher in heatwave-related deaths[9]. Additionally, the higher temperatures resulted in a 24% increase in potential work hours lost, and a 60% increment in reduced time for outdoor activities.
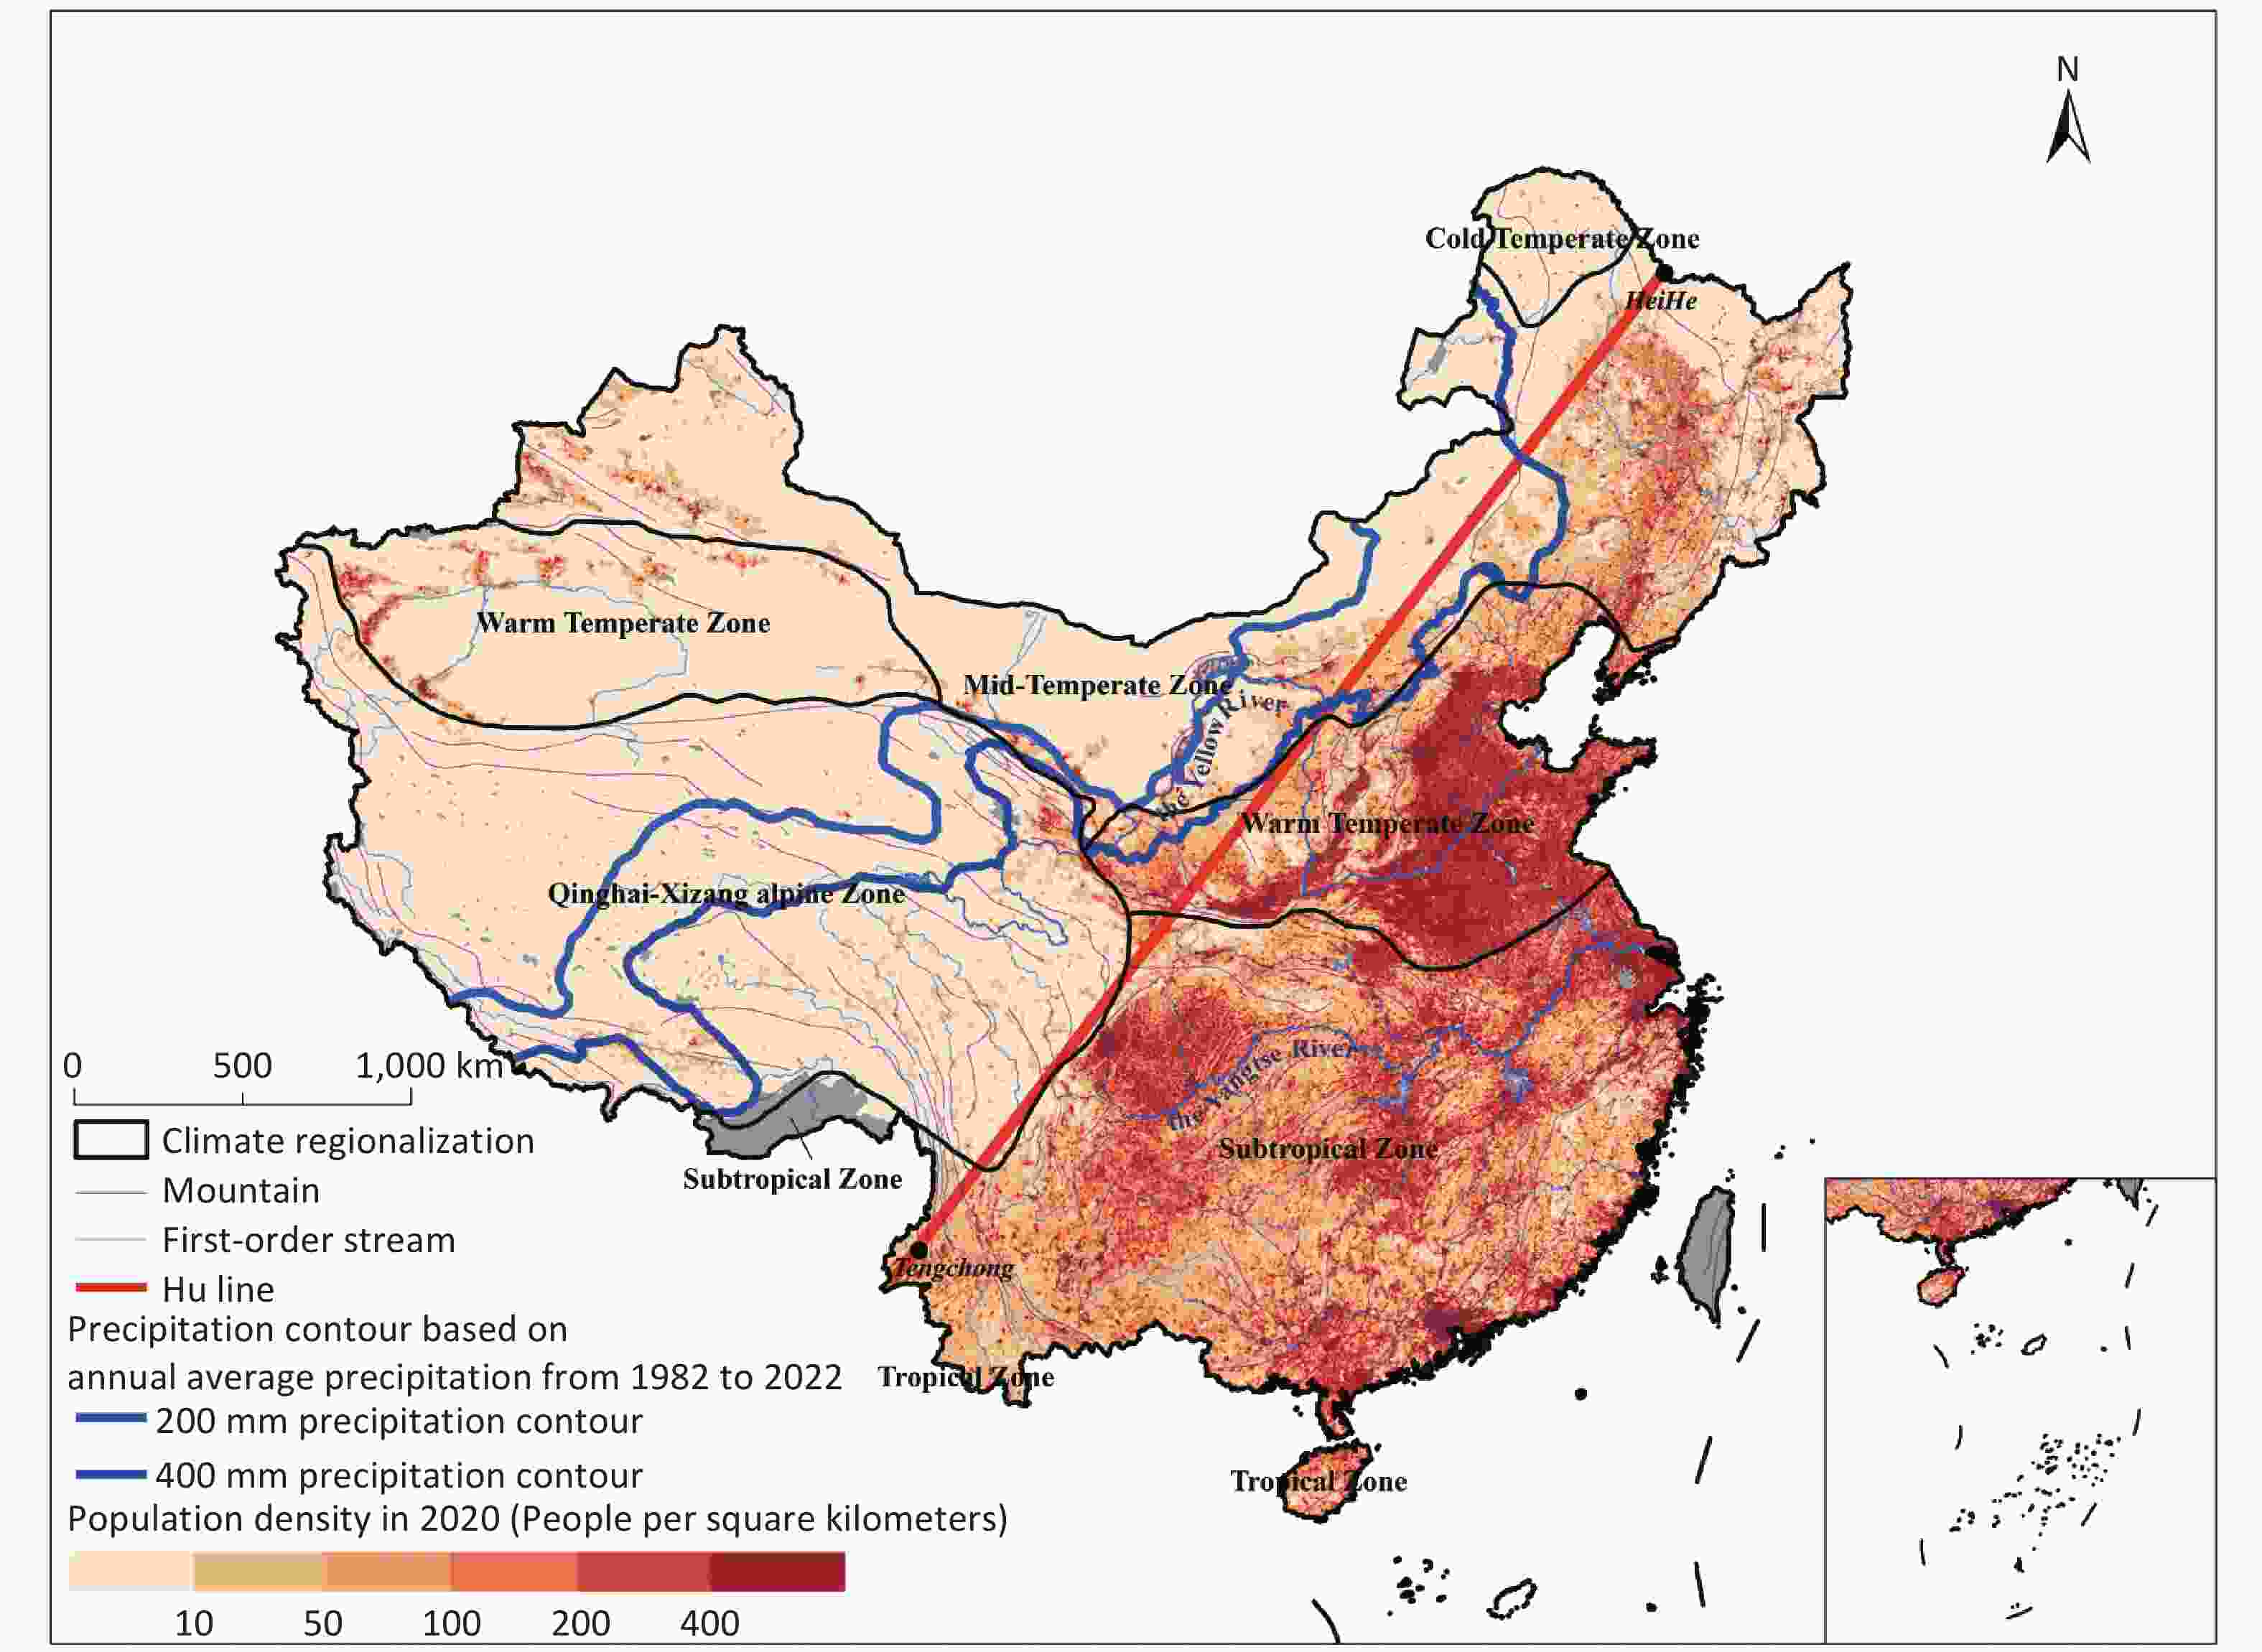
Figure 1. China’s climate and population density. This Figure was drawn by ourselves, based on publicly available online data (i.e., bzdt.ch.mnr.gov.cn/download.html/ and www.geodata.cn). The dark grey areas are not included due to data availability. Map approval number: GS(2025)0224.
Despite the great significance of China in addressing global climate change, comprehensive synthesis of climate influences on the environment and human health in China is rare, even though such evidence may enhance its ambition to reshape climate policy. This article aims to review the pattern of climate change and its impacts on the environment and human health in China. Through this interdisciplinary and comprehensive assessment, we demonstrate that China’s climate has increasingly and clearly warmed since 1900, with more frequent and intense climate extremes including heatwaves and extreme precipitation events. In the meantime, the increase in surface temperature and climate extremes have substantially affected the environment and human health. However, there are remarkable geographic and temporal variation in climate change and its impacts. Thus, China’s climate policy should target the key factors driving climate change and increase the ambition to mitigate carbon emissions and adapt to inevitable increasing climate impacts.
-
Global mean surface temperature increased by 1.09 °C in 2011–2020 compared with 1850–1900, and the land surface warming (1.59 °C) was much higher than that of the ocean (0.88 °C)[1]. Warming in China was also highly noticeable (Box 1A). Since 1900, the surface air temperature increase in China has been ranging from 1.3 to 1.7 °C, and higher than the global mean[10]. From 1961 to 2020, the mean surface temperature in China presented an increasing trend with considerable geographic variabilities, with warming rates in western and northern China higher than those in eastern and southern China.
Table 1. Climate change: evidence and projection
From 1901 to 2023, the annual mean surface air temperature in China exhibited a significantly upward trend (Box 1A). From 2014 to 2023, the mean surface air temperature was 0.52 °C above the normal, and 1.45 °C above the average value in 1961–1990, but there are remarkable regional differences[6]. The warming rate in northern China was significantly higher than that in the southern region, and it was higher in western China than in the eastern part. The Qinghai-Xizang region exhibited the largest warming rate of 0.35 °C per decade. By contrast, South China and Southwest China had a relatively slow warming rate with 0.21 °C /decade and 0.18 °C /decade, respectively. In 1961–2023, the average annual precipitation in China slightly increased, with inter-decadal variation (Box 1B). We have analyzed regional annual mean temperature (Box 1C) and precipitation (Box 1D) changes (in °C and %) over China (relative to 1995–2014) as projected by the multi-CMIP6 models for different time periods of the 21st century under different emission scenarios. The average daily maximum temperature (TXx) is anticipated to rise by 1.7–5.3 °C by the end of this century (2081–2100) under four scenarios, relative to 1995–2014 (Box 1E). The maximum 5-day rainfall (Rx5day) is projected to increase by 10%–24% by the end of the 21st century under the high emission scenario, with an increment of 3% per decade (Box 1F). 
Box 1. Observations and projections of climate change in China. (A) An upward trend of the mean surface air temperature. The mean surface air temperatures across China were consistently on the rise since 1900, but the warming rates were greater during 1961–2023 than before, with a remarkable difference by region. (B) In 1961–2023, the precipitation increment reached 5.2 mm/decade with distinct inter-decadal variation. In the 1990s, the average annual precipitation was more than normal, but in the first decade of the 21st century, it was generally below the normal level. Later, the situation was inverted again since 2012. Additionally, the variation trend of annual precipitation differed greatly by region. (C) Changes in annual mean temperature (°C) over China (relative to 1995–2014) as projected by the multi-CMIP6 models for different time periods of the 21st century under different emission scenarios, with the bold bars indicating the mean of the 19-model ensemble and the color boxes indicating the model range of 10%–90%. (D) Precipitation changes (%) as projected by the multi-CMIP6 models for different time periods of the 21st century under different emission scenarios, relative to 1995–2014. (E) Daily maximum temperature changes (TXx; in °C) (relative to 1995–2014) over China in the 21st century as projected by the CMIP6 23-model ensemble. (F) Changes in annual maximum 5-day precipitation amount (Rx5day; %) in 21st century as projected by the CMIP6 23-model ensemble, relative to 1995–2014. Sources: We adapted Box 1 Figure a and b from reference 6 with modification, and drew Box 1 Figure C, D, E and F with new data. The number of high-temperature days in China has increased considerably, with expanding area and increasing duration[10]. Since 1961, the average annual frequency of extreme high-temperature events (99th percentile) in China has increased by 4.4 days per decade[11]. The record-breaking events of the highest temperature mainly occurred in the eastern part of Northwest China and the southern part of North China in the 1990s, while in the twenty-first century, they happened mainly in South China, North China and Sichuan Basin. In addition, more extreme heat events have become widespread with enhanced strength and enlarged scope[11]. By contrast, between 1961 and 2023, the frequency of extreme cold events had significantly decreased[6].
During 1961–2023, there was an increase in the average annual precipitation in China (Box 1B). The frequency and intensity of extreme precipitation events and affected area in China have increased with regional disparity. During 1961–2018, the annual accumulative rainstorm days (daily precipitation ≥ 50 mm) increased by 3.8% per decade on average across China. The increasing trend of rainstorm was found mainly in southern China, the Qinghai-Xizang Plateau and parts of Northwest China, while there was a slight decrease of rainstorm in North China and central Sichuan Province[12].
River runoff is a critical indicator of complex regional water cycle. The measured runoff in the western China exhibits an increasing tendency due largely to glacier melting, while that in the north presents a significant decreasing trend. During the period of 1956–2018, except for the Yangtze River Basin, the measured runoff of the remaining six major rivers (Songhuajiang, Liaohe, Haihe, Huaihe, Yellow and Pear) all showed different degrees of decline[13].
-
Based on the 19 CMIP6 models (4 from China) under emission scenarios of shared socioeconomic pathways 1-2.6 (SSP1-2.6), SSP2-4.5, SSP3-7.0, and SSP5-8.5, increases in the temperatures are found in all projections. The differences among estimated results of the four scenarios appear pronounced, particularly in the mid- and far-future period, and in the high-emission scenarios (Box 1C). The annual mean temperature will increase by 1.6–5.3 °C at the end of this century. Under the low emission scenario (SSP1-2.6), the annual mean temperature will reach 1.5 °C (10%–90% range: 0.9–2.0 °C) by the mid-twenty-first century and then slowly hit 1.6 °C (0.9–2.2 °C) at the end of this century. Under the scenario SSP5-8.5, the values are 2.4 °C (1.6–3.1 °C) and 5.3 °C (3.5–7.1 °C) in the middle and end of this century, respectively.
Annual mean precipitation is projected to exhibit a general increase over China, in the range of 8% to 27% at the end of this century (Box 1D). Under SSP2-4.5, the increases are 6% (2%–10%) and 11% (4%–17%) in the middle and end of this century, respectively. Under SSP5-8.5, the increases are 8% (2%–13%) and 17% (8%–27%), respectively.
-
There will be more extreme high-temperature events and fewer extreme cold events in the future[14]. CMIP6 projections show a general increase of extreme indices TXx and τNn (average daily minimum temperature), with a prominent increase for the latter. The average increases for TXx and τNn by the end of this century relative to 1995–2014 under RCP4.5/RCP8.5 are 2.8 °C/5.2 °C and 3.5 °C/6.3 °C respectively (Box 1E). Thus, global warming kept below 1.5 °C rather than 2.0 °C means tens of thousands less heatwave-related deaths in cities across China[15]. CMIP6-based projections also show a general increase of Rx5day (maximum 5-day precipitation) over China (Box 1F). Under SSP5-8.5, regions with greater increase (> 30%, with the largest increase up to 50% in portions) include North China, Inner Mongolia, southern Xinjiang, Yunnan and Qinghai-Xizang Plateau[14]. The regional mean increases of Rx5day over China are 16% and 29% at the end of this century relative to 1995–2014 under SSP2-4.5 and SSP5-8.5, respectively.
-
Climate change has influenced the spatial-temporal patterns of air pollution across China, although rapid economic growth and intensive anthropogenic activities are the main causes over the past decades. Via disturbing atmospheric stability and circulations, climate change influences long-range transboundary transport of air pollutants and leads to spatial heterogeneity in distribution and load of air pollutions at the macro-scale[16,17]. For instance, anthropogenic warming greatly decreased downwind spring air quality in Northeast Asia by enhancing atmospheric stability and transboundary transport[18]; the decreased desertification and frequency of dust storms in arid and semiarid northern China may have been more attributed to climate change rather than ecological restoration programs[19]. Circulation changes induced by global warming also contributed to the increased severe haze frequency in Beijing metropolitan region[20], and the enhanced Siberian High led to stronger northerly winds in the North China Plain, causing a decrease of PM2.5 concentration by 100–200 µg/m3[21].
Meteorological factors induced by climate change can also affect air quality at local level. Increasing temperature and decreasing precipitation have been attributable to increasing O3, while increasing PM2.5 was associated with decrease in boundary layer height and wind speed[22]. The weakening direct radiative effects of aerosol would mitigate climate penalty on air quality under representative concentration pathway 4.5 (RCP 4.5), and would be likely to reduce human exposure to air pollution and relevant mortality[23]. The mechanisms through which meteorological factors affect air quality primarily include: (1) solar radiation and surface albedo generally serve as the trigger of photochemical reaction of air pollutants, and thus generating secondary pollution[24]; (2) wind speed and direction related to climate change greatly influence dispersion of air pollutants at local scale[25,26]; and (3) thermal inversion layer may be harmful to diffusion of air pollution through enhancing vertical stability of atmosphere[11].
Climate extremes are also linked with air pollution. For example, frequency of heatwaves and atmospheric stagnation days would increase with climate change, which in turn have a joint influence on deadly air pollution events[22]. Reduction of surface wind speed and boundary layer height during stagnation events is harmful to the transport and diffusion of air pollutants. Heat extremes lead to increase in demands of urban cooling and bring about more consumption of fossil fuels as well as associated pollutants emissions[27], while vegetation emits volatile organic compounds (VOCs) in response to heat extremes, which increase ambient O3 and PM2.5 concentrations[28].
-
The distribution of surface water resources in China is extremely uneven, exacerbated by climate change in recent years[10,29]. Since systematic observations began in the 1960s, there is a trend of increasing precipitation in the south and decreasing in the north at the sub-national level[30]. Possible reasons include changes in the monsoon system, anthropogenic aerosols, and sea surface temperatures[31]. High temperature and low precipitation through a joint probability distribution of precipitation and temperature may imply drought events[32]. From 1979 to 2018, over 70% of the country experienced an upward trend in annual drought duration and severity, with the Inner Mongolia steppe region having the largest area of substantial upward trends while the Qinghai-Xizang Plateau had the highest percentage of significant upward trends[33]. Rising temperatures, droughts, and floods induced by climate change led to water pollution such as eutrophication, harmful algal bloom, pathogens, and pesticides, thus causing a decline in water availability[34-37].
Qinghai-Xizang Plateau and surrounding Hindu Kush, Karakoram, and Himalaya mountain ranges are the largest global store of frozen water after the polar regions[8]. Seasonal glacial meltwater provides an essential source of freshwater. As climate changes, the asymmetric temperature warming between high and low latitude has markedly weakened the East Asian summer monsoon[31,38], and has further reduced water vapor exchange between the monsoon region and the plateau, leading to decreased precipitation on the Qinghai-Xizang Plateau[39]. Concurrently, global warming has caused increasing glacial melt and runoff[40]. Glacial melt may alleviate water shortages in the Yellow and Yangtze River basins and lead to the expansion of central Qinghai-Xizang Plateau lakes, redistributing freshwater between reservoirs[8]. Lake, as a freshwater resource, has a heterogeneous spatial change in the whole country[41]. New lakes and expansion of existing lakes occur in the arid western regions of China due to climate change, while the humid eastern regions have experienced lake shrinkage and disappearance due to human interference, but overall, the total area of lakes in China increased by 5,858.06 km² (9%) from the 1960s to 2015[42]. However, glacial melt and snowmelt may also pose risks to agricultural irrigation. In western China, such as the Alakol and Ili basins, snowmelt instead of rainfall-runoff meets surface water irrigation needs; however, under a 4 °C warming scenario, these regions are projected to experience a high snowmelt hazard, leading to declines in the share of irrigation water met by snowmelt and necessitating increases in alternative water supplies[43].
-
The impact of climate change on soil environments involves multiple aspects, including moisture levels, organic carbon content, and nutrient cycling. Although climate change has not greatly altered China’s annual precipitation, it has caused instability in precipitation patterns in certain regions, leading to changes in regional and seasonal precipitation. These changes have affected the structure and function of China’s soil ecosystems[44], while the quality of soil determines its capacity to withstand the impacts of climate change[45]. For instance, the increased frequency of heatwaves and reduced precipitation in northeastern China have exacerbated drought conditions, affecting the soil’s moisture and crop yields. In contrast, in the northwest, increased precipitation has led to rising water levels in some lakes, a slight reduction in soil dryness, and increased vegetation cover at the desert margins[46].
A large portion of the carbon stock in China’s terrestrial ecosystems is stored in soil[47]. Climate change impacts the accumulation and decomposition of soil organic carbon (SOC) by altering temperature and precipitation patterns[48]. In particular, elevated temperatures accelerate the decomposition of SOC in forests and shrub lands, resulting in reduced SOC levels[49]. This not only diminishes soil fertility but also decreases the soil’s carbon sequestration capacity[45], leading to increased CO2 emissions into the atmosphere and further exacerbating global warming. For example, temperature increases due to climate change are the primary factor driving the decline in soil carbon sequestration rates in the northern urban agglomerations of Jiangsu Province, China[50]. Although increased precipitation can partially mitigate the negative effects of high temperatures on SOC, the extent of this mitigation depends on specific precipitation patterns and soil types[51].
With the intensification of climate change, the increased frequency of extreme weather events such as heatwaves, heavy rainfall, floods, and droughts poses greater challenges to soil environments[52]. The frequent alternation between wet and dry conditions and temperature fluctuations not only disrupt the normal activities of soil microorganisms and nutrient cycling, leading to a decline in soil fertility, but also damage soil structure, exacerbate soil erosion, and accelerate soil degradation[44]. This can even result in irreversible desertification and salinization, severely impacting agricultural productivity and ecosystem service functions. China is one of the countries with the most extensive and intense soil degradation, with nearly half of its land area experiencing erosion and degradation[53]. Soil erosion is prevalent and is expected to continue worsening under climate change[54]. In ecologically fragile regions, such as the northwest interior and the Qinghai-Xizang Plateau, rainfall intensity is closely related to soil erosion and degradation, with erosion rates increasing as precipitation rises[55,56]. Moreover, changes in rainfall patterns and extreme weather events such as short-duration heavy rainfalls and storms induced by climate change may lead to nonlinear responses in soil erosion, further exacerbating soil degradation[55,57].
In the context of global climate change, a comprehensive understanding and proactive response to the multifaceted impacts of regional climate change on the environment have become crucial tasks in China’s pursuit of sustainable development and ecological civilization.
-
Greenhouse gases, such as CO2, and many air pollutants like SO2 and NOx, are mostly from the same emission sources, e.g., combustion from coal and other fossil fuels. Before the nation-wide air pollution control action in China, the emissions of CO2 and air pollutants had similar trend as energy consumption. However, decoupling of the emission trends of greenhouse gases and air pollutants has become evident, since China implemented the Action Plan on Prevention and Control of Air Pollution in 2013. Such trends have even become more pronounced after the Three-Year Action Plan for Winning the Blue Sky Defense Battle was implemented in 2018. These action plans are comprehensive, including ultralow emission retrofitting of coal-fired power plants, deep industrial pollution control, integrated control of volatile organic compounds (VOCs) pollution, comprehensive management of coal-fired boilers, clean heating in rural areas, control of emissions from mobile sources, integrated management of agriculture sources, and integrated control of fugitive dust emissions[58].
Looking into future, with a combination of strict low-carbon policy and air pollution control policy, emissions of major air pollutants (SO2, NOx, PM2:5, and non-methane VOCs) in China will be reduced by 34%–66% in 2030 and 58%–87% in 2050 compared to 2015. End-of-pipe control measures are more effective for reducing air pollutant emissions before 2030, while low-carbon policy will play a more important role in continuous emission reduction until 2050[59].
-
Ambient air particulate pollutants, also known as atmospheric aerosols, contribute greatly to climate change through their interactions with clouds and radiation. Aerosol is important for cloud nuclei. Based on a tethered balloon observation study, it was found that aerosol concentration was high below the clouds, which increased the cloud droplet concentration and decreased the cloud droplet diameter near cloud base[60]. The clouds deteriorated the near-surface air pollution, thus increasing exposure to hazardous levels. Through absorption and scattering, aerosol interaction with radiation in the atmosphere changes the radiation balance and temperature vertical profile, and thus impacts on the radiative forcing and atmospheric stability, especially the stability within boundary layer.
Black carbon (BC) induces heating in the planetary boundary layer (PBL), particularly in the upper PBL, and the resulting decreased surface heat flux substantially depresses the development of PBL and consequently enhances the occurrences of extreme haze pollution episodes. This process is defined as the “dome effect” of BC and suggests an urgent need for reducing BC emissions as an efficient way to mitigate the extreme haze pollution in megacities of China[61].
-
While the epidemiological and toxicological studies on the health effects of air pollutants are well documented, there is increasing evidence about climate change-related health effects (e.g., heat and heatwaves). Given the possibility that air pollution and extreme weather events could co-exist, it is naturally hypothesized that air pollution and climate change might have synergistic health effects. Health effects of air pollution could be modified by warm or cold season, such as the one on short-term mortality effects of PM2.5 in Xi’an, China[62].
A recent study used a difference-in-difference approach to quantify the relationship between all-cause mortality and annual exposure to mean temperature and diurnal temperature range, and found that air pollutants (PM2.5, NO2, and O3) appear to contribute significantly to aggregating temperature-related health risks[63]. Joint exposure to O3 and high temperature can increase the risk for pregnancy loss, and the adverse effect of O3 is potentially modified by ambient temperature[64]. A panel study on the elderly found that high and low temperatures, and high humidity were all high-risk factors for lung dysfunction, and their interactions with air pollutant levels contributed greatly to the overall effects[65].
-
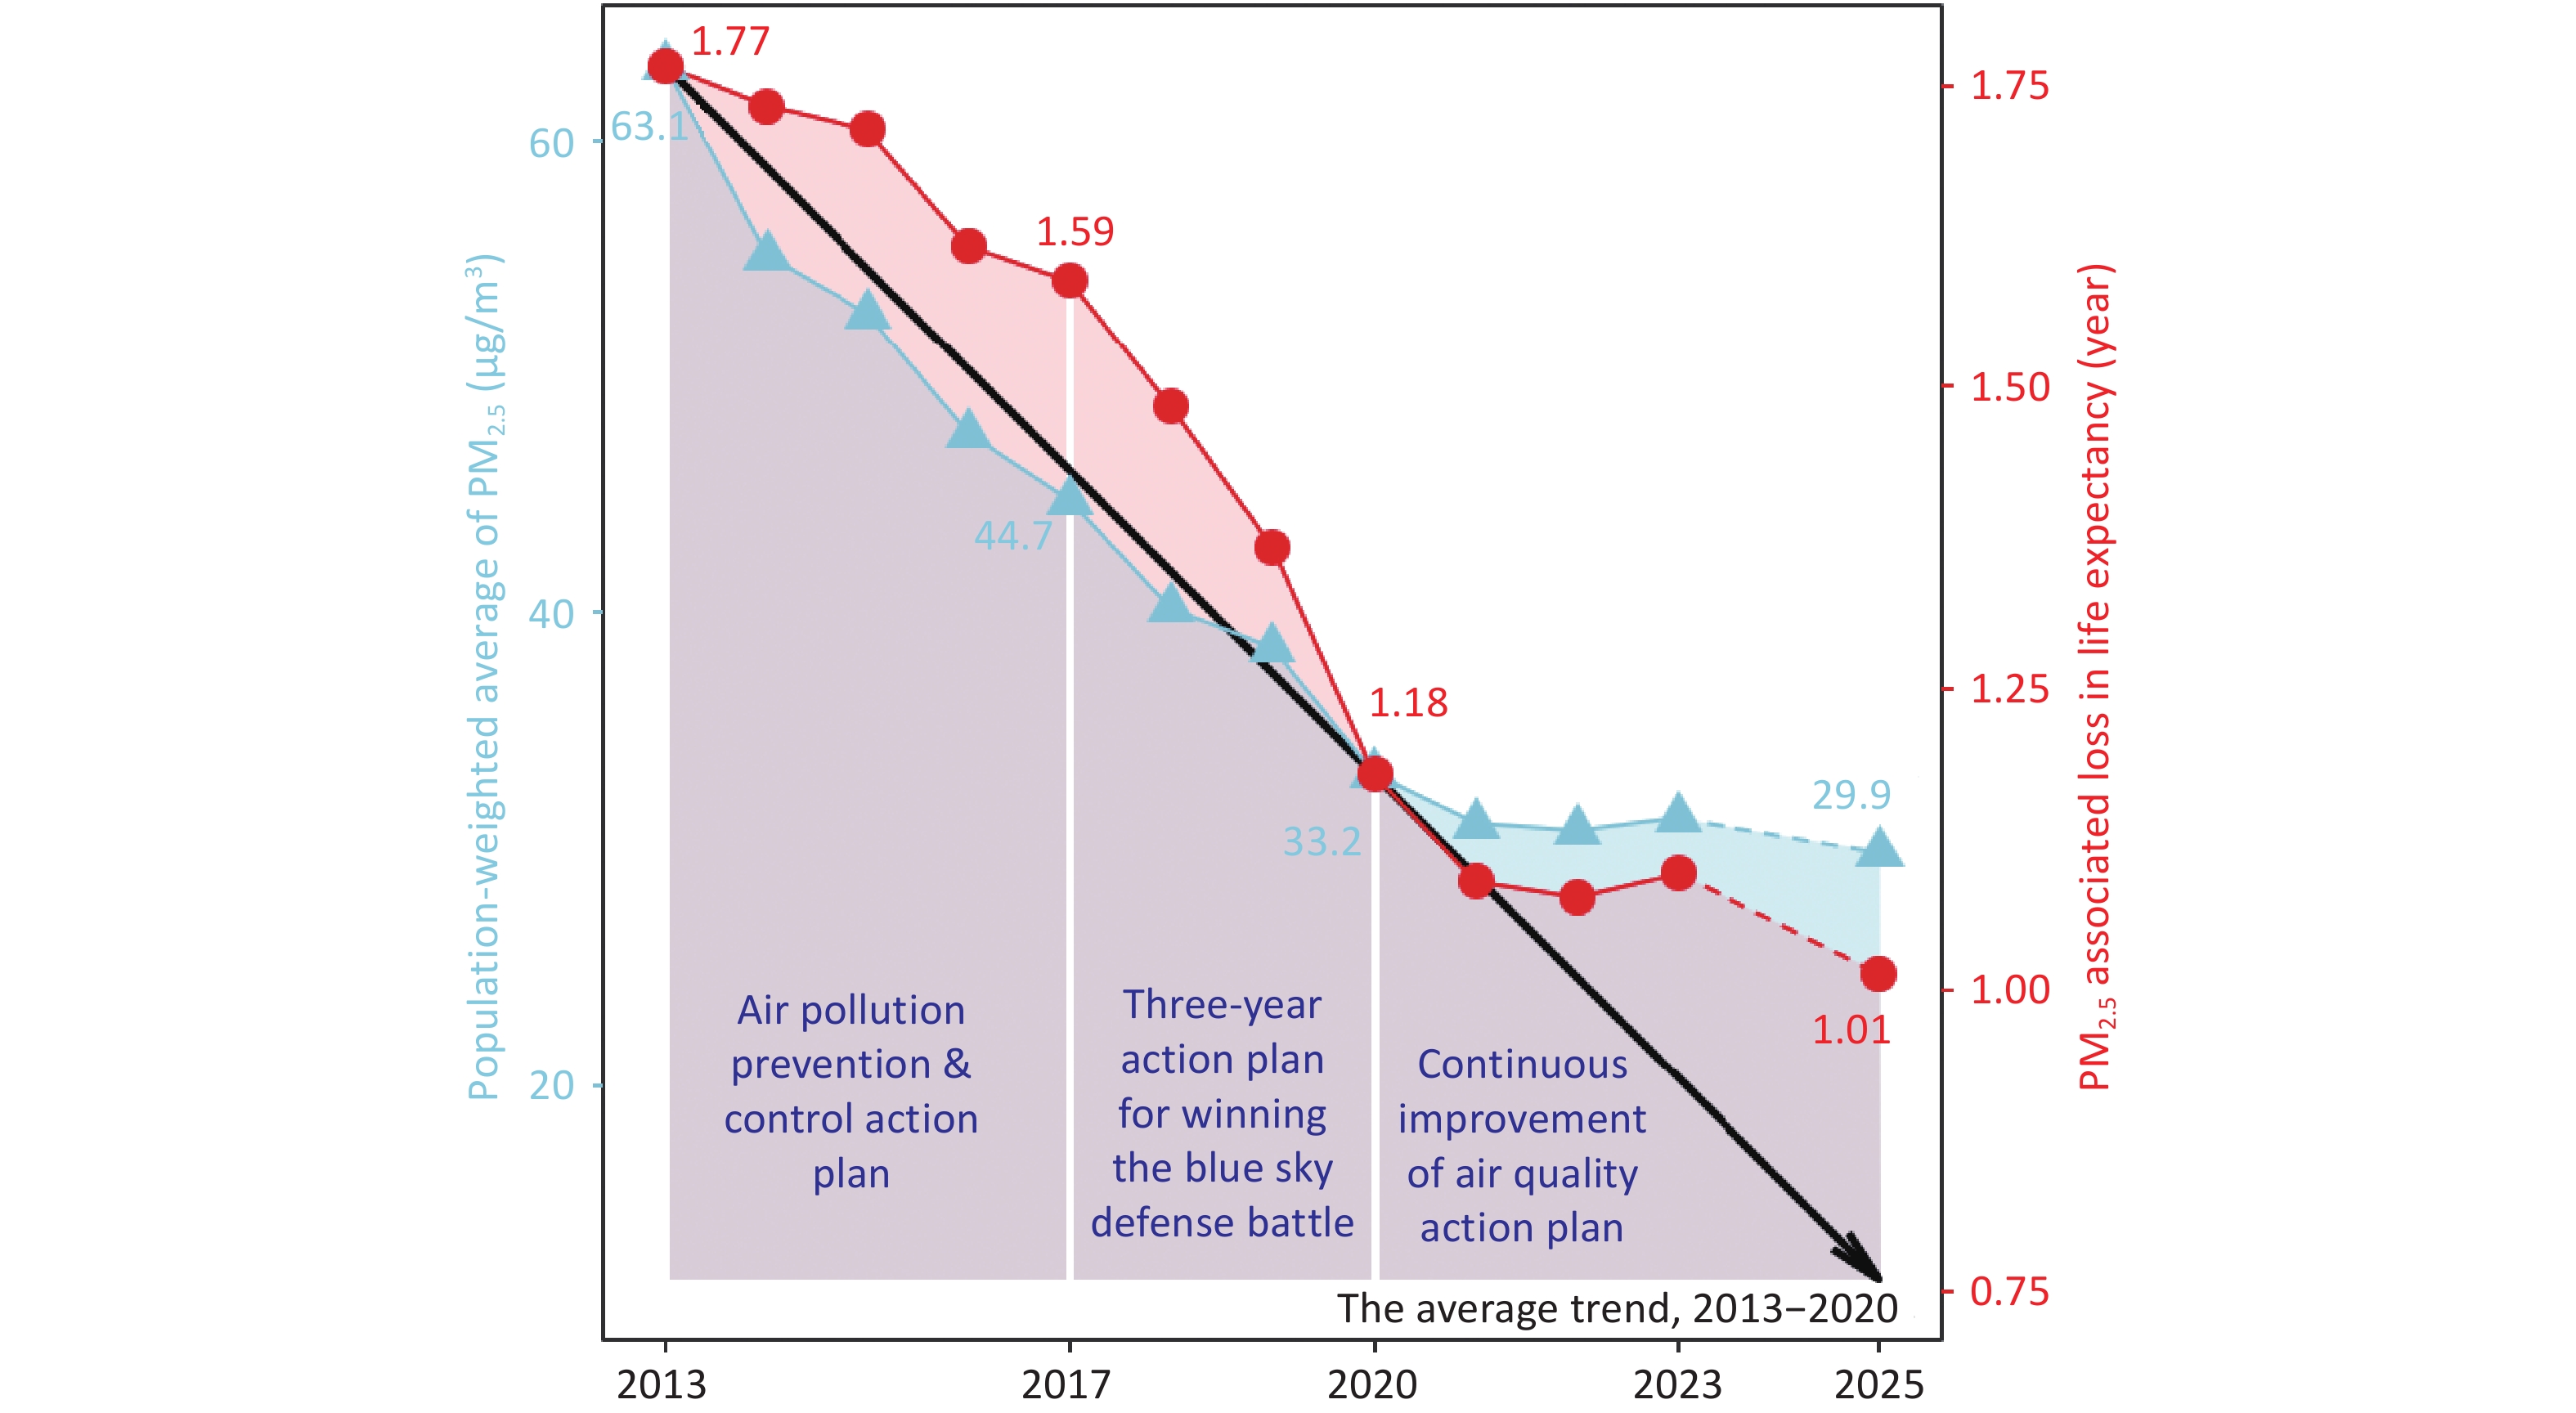
Air quality has been drastically improved since China implemented the Action Plan on Prevention and Control of Air Pollution in 2013 and the Three-Year Action Plan for Winning the Blue Sky Defense Battle in 2018. Now the majority of cities has met the national ambient air quality standards for PM2.5 (annual mean 35 µg/m3), which is, however, 7 times of the WHO 2021 modified air quality guidelines for PM2.5 (annual mean 5 µg/m3). Continuous efforts are needed to combat air pollution-related diseases, requiring a combination of health-oriented strategies in addition to emission control measures (Figure 2). These strategies include the revision of air quality standards, the pursuit of carbon neutrality, and the enhancement of air pollution resilience in alignment with the Healthy China 2030 initiative[66]. The observed adverse heatwave-energy-environment feedback loop highlights the need for the diversification of clean energy sources, more resilient energy structures and power policies, and further emission control to confront the escalating climate challenge in the future.
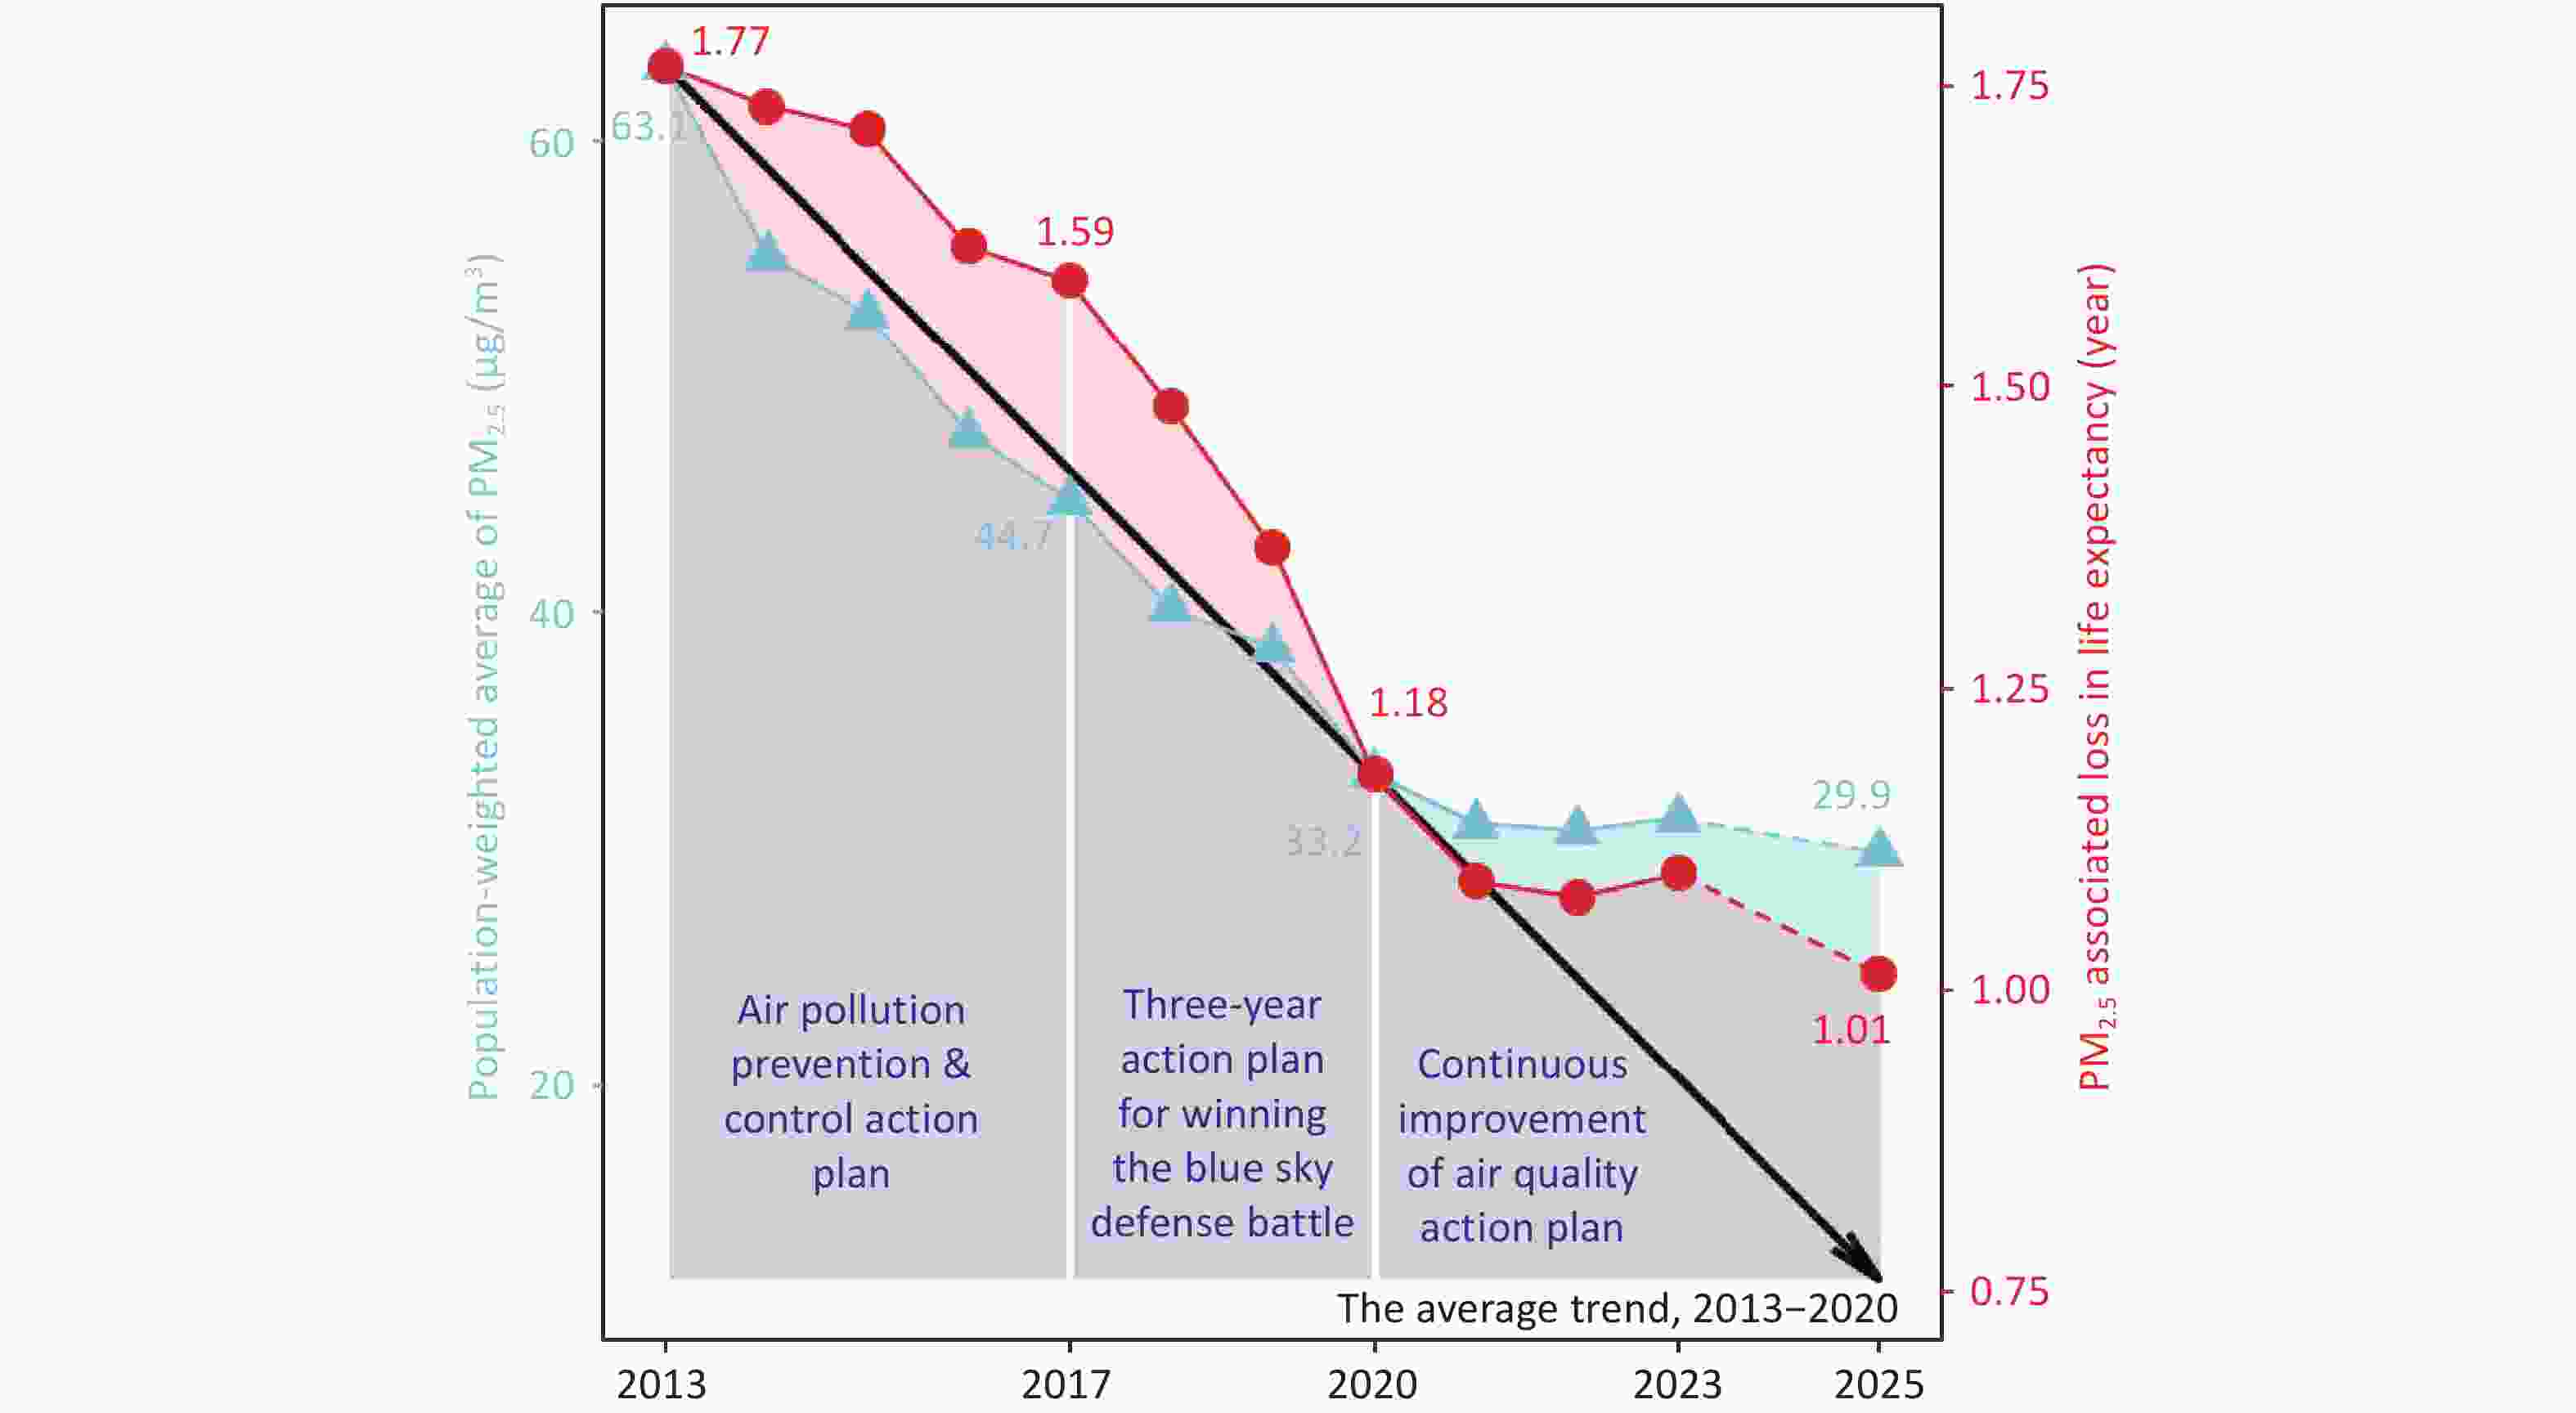
Figure 2. The projected trend of population weighted average PM2.5 concentration (µg/m3) and PM2.5 associated loss in life expectance (year), up to 2025 under the Continuous Improvement of Air Quality Action Plan.
-
In the context of climate change, the increasingly fluctuated meteorological conditions, changes in land cover/land use, and the extended disease-transmission seasons are expected to affect the proliferation of pathogens, the transmission modes, epidemic patterns, population susceptibility of various communicable diseases, and their spatial-temporal distribution[67,68]. As some examples, Figure 3 shows annual incidence of four typical infectious diseases in mainland China between 2021–2022 that are sensitive to climate conditions.
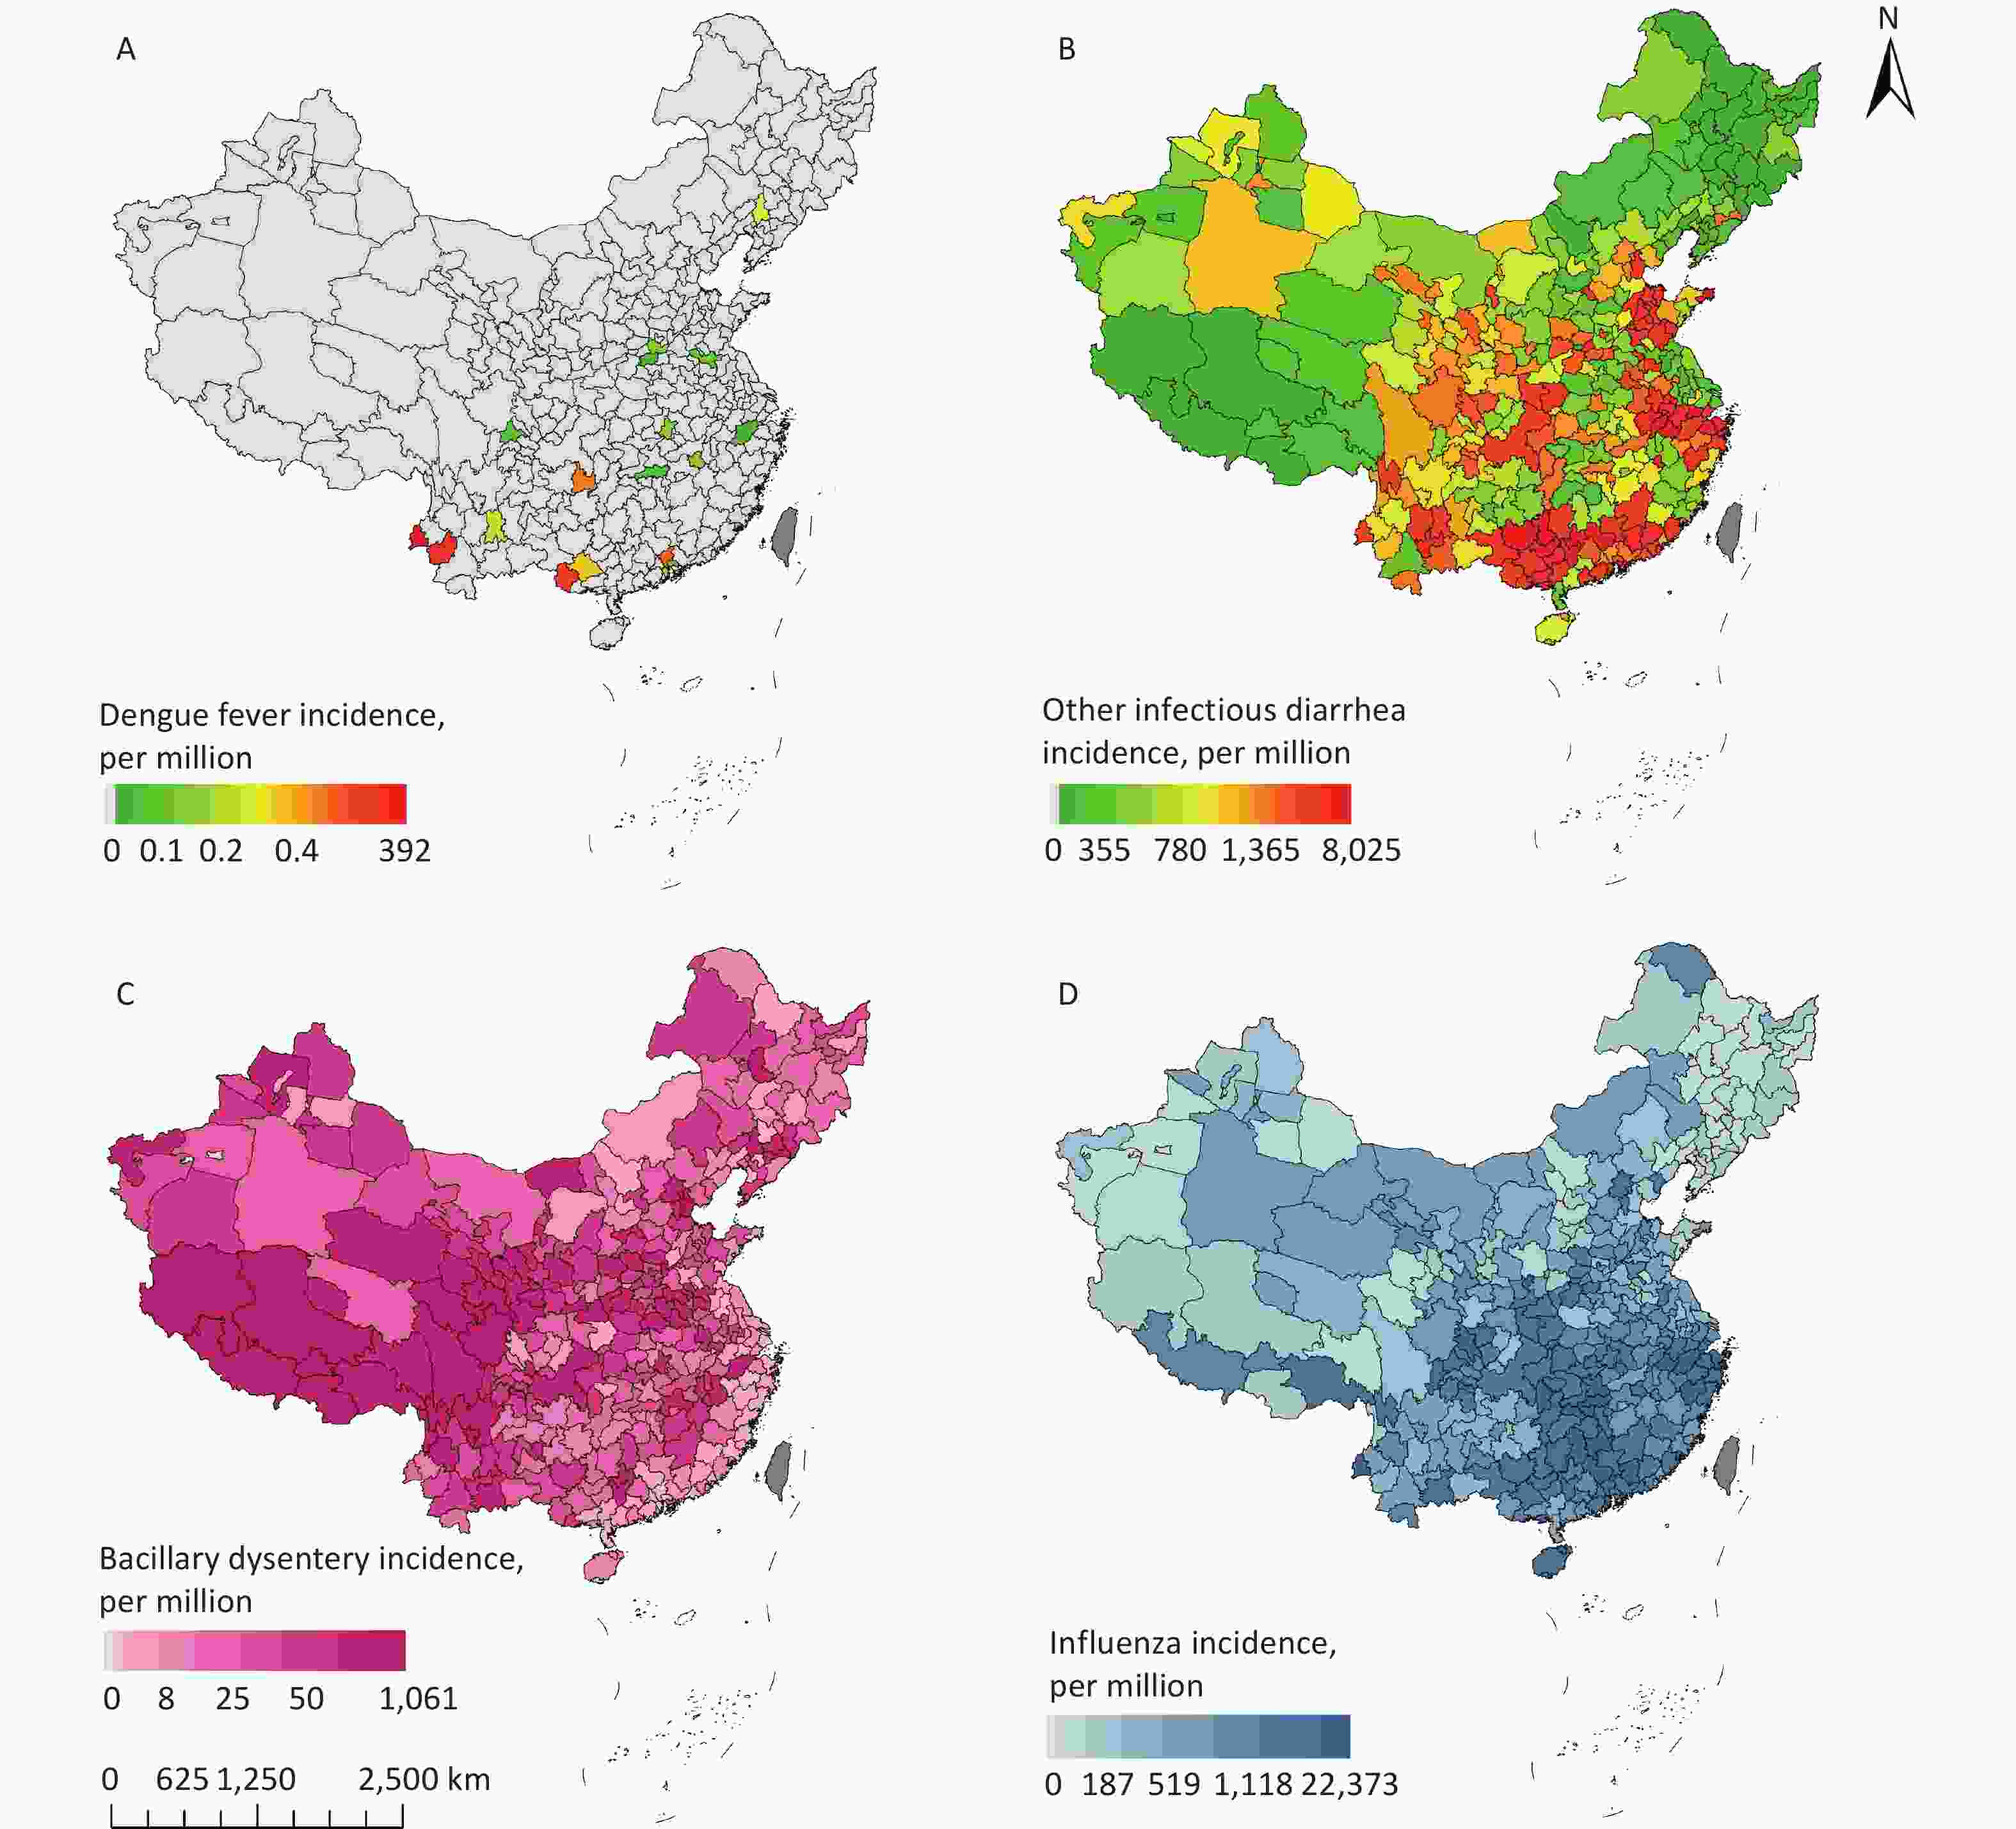
Figure 3. Annual incidence of four typical infectious diseases in mainland China between 2021–2022. (A) annual incidence of dengue fever; (B) other infectious diarrhea; (C) bacillary dysentery; (D) influenza. The dark grey areas are not included due to data availability. Map approval number: GS(2025)0224.
-
VBDs are illnesses caused by parasites, viruses or bacteria that are transmitted by vectors such as mosquitoes and ticks[69]. In China, the major vector-borne diseases include dengue fever, hemorrhagic fever with renal syndrome (HFRS), and severe fever with thrombocytopenia syndrome (SFTS), which are climate-sensitive. Dengue cases are mainly distributed in the southwest and southeast coastal areas. Nearly 90% of HFRS cases of the world each year occurred in China (e.g., 5,549 cases in 2023)[70,71]. Climate change impacts the survival, reproduction, and life cycles of pathogens by altering the patterns of ambient temperature and precipitation and by increasing the intensity, frequency, and duration of extreme weather events[72]. It also influences the density and geographic distribution, and behavior of vectors, as well as the opportunities of human exposure to vectors. Evidence suggested that the relative risk (RR) of dengue peaked at a 1-month lag for extreme wet conditions (RR = 1.27, 95% CI: 1.05, 1.53) and at a 6-month lag for extreme dry conditions (RR = 1.63, 95% CI: 1.29, 2.05)[73]. Locations with potential dengue risk in China will expand in the future. By 2100, the annual average excess risks related to hydrometeorological conditions are expected to increase by 3.29%–48.22% under RCP4.5 and 12.56%–173.62% under RCP 8.5, with northwest China least affected and southern China most affected, respectively[74].
-
WBDs are those transmitted through drinking or contacting with water contaminated with pathogens, and more than 40 infectious diseases are known to be transmitted through water[75]. Infectious diarrhea, dysentery, and viral hepatitis are the most common water-borne diseases in China[71]. In 2023, a total of 2,929,559 cases and 2,149 deaths from these diseases were reported[71]. Waterborne diseases are sensitive to climatic conditions such as increased temperature, extreme precipitation, droughts, floods, storms, and sea-level rise[76,77]. For example, the effect of extreme dry conditions on infectious diarrhea peaked at the 2-month lag (RR = 2.67, 95% CI: 2.44, 2.91), while the RR of infectious diarrhea increased immediately under extreme wet conditions[78]. Another study observed that after the 2016 severe flood event in Anhui province the risk of infectious diarrhea increased by 11% (95% CI: 1, 23%) in flooded area compared to non-flooded areas, with effect size progressively higher for locations closer to the Yangtze River[79].
-
FBDs refer to infectious, toxic, and other diseases caused by pathogenic factors (such as toxins, bacterial, and microbial pathogens) in food[80]. In China, there were 7,073 foodborne disease outbreaks in 2020, resulting in 37,454 illnesses and 143 deaths[1]. Bacterial pathogens are the most common cause[81,82]. Climate change and related conditions affect the existence and persistence of pathogens and vectors, leading to increased contamination of water and food by pathogenic microorganisms, which further directly or indirectly affect food safety[83,84]. A study in Chongqing found a significant lag effect of floods on bacillary dysentery cases, with the cumulative RR over a 7-lag day period being 1.39 (95% CI: 1.22, 1.60)[85]. By 2090s, northern, northeast, Inner Mongolia, and northwest China are projected with the highest risk of bacillary dysentery related to non-optimal ambient temperature, which would increase by 7.3%–13.7% under RCP4.5 and by 11.5%–20.2% under RCP8.5, respectively, in comparison to the 2014–2016 baseline[86].
-
ABDs such as influenza, tuberculosis, and mumps are the most common air-borne infectious diseases in China[87,88]. Virus will spread through droplets in the air when an infected individual cough, sneezes or talks. In 2022, the estimated tuberculosis incidence and the influenza-associated all-cause mortality were 52 and 14.3 per 100,000 individuals, respectively[89,90]. Climatic factors such as temperature extremes, anomalous precipitation, and humidity variations are closely associated with air-borne diseases[91]. National analysis showed that low temperatures had a substantial effect on influenza in China, with an Rt of 1.2. The threshold temperatures for reaching a warning for serious influenza outbreaks ranged from −24.3 °C in the northeastern region to 16.6 °C in the northwestern region[92]. A study in Jiangsu province found that the risk of pulmonary tuberculosis increased by 56.2% (95% CI: 32.5, 84.0) over lag 0–16 weeks when average wind speed was < 3 m/s and decreased by 28.1% (lag 0–14 weeks, 95% CI: −39.2, −14.9) over lag 0–14 weeks when average relative humidity was ≥ 72%[93].
-
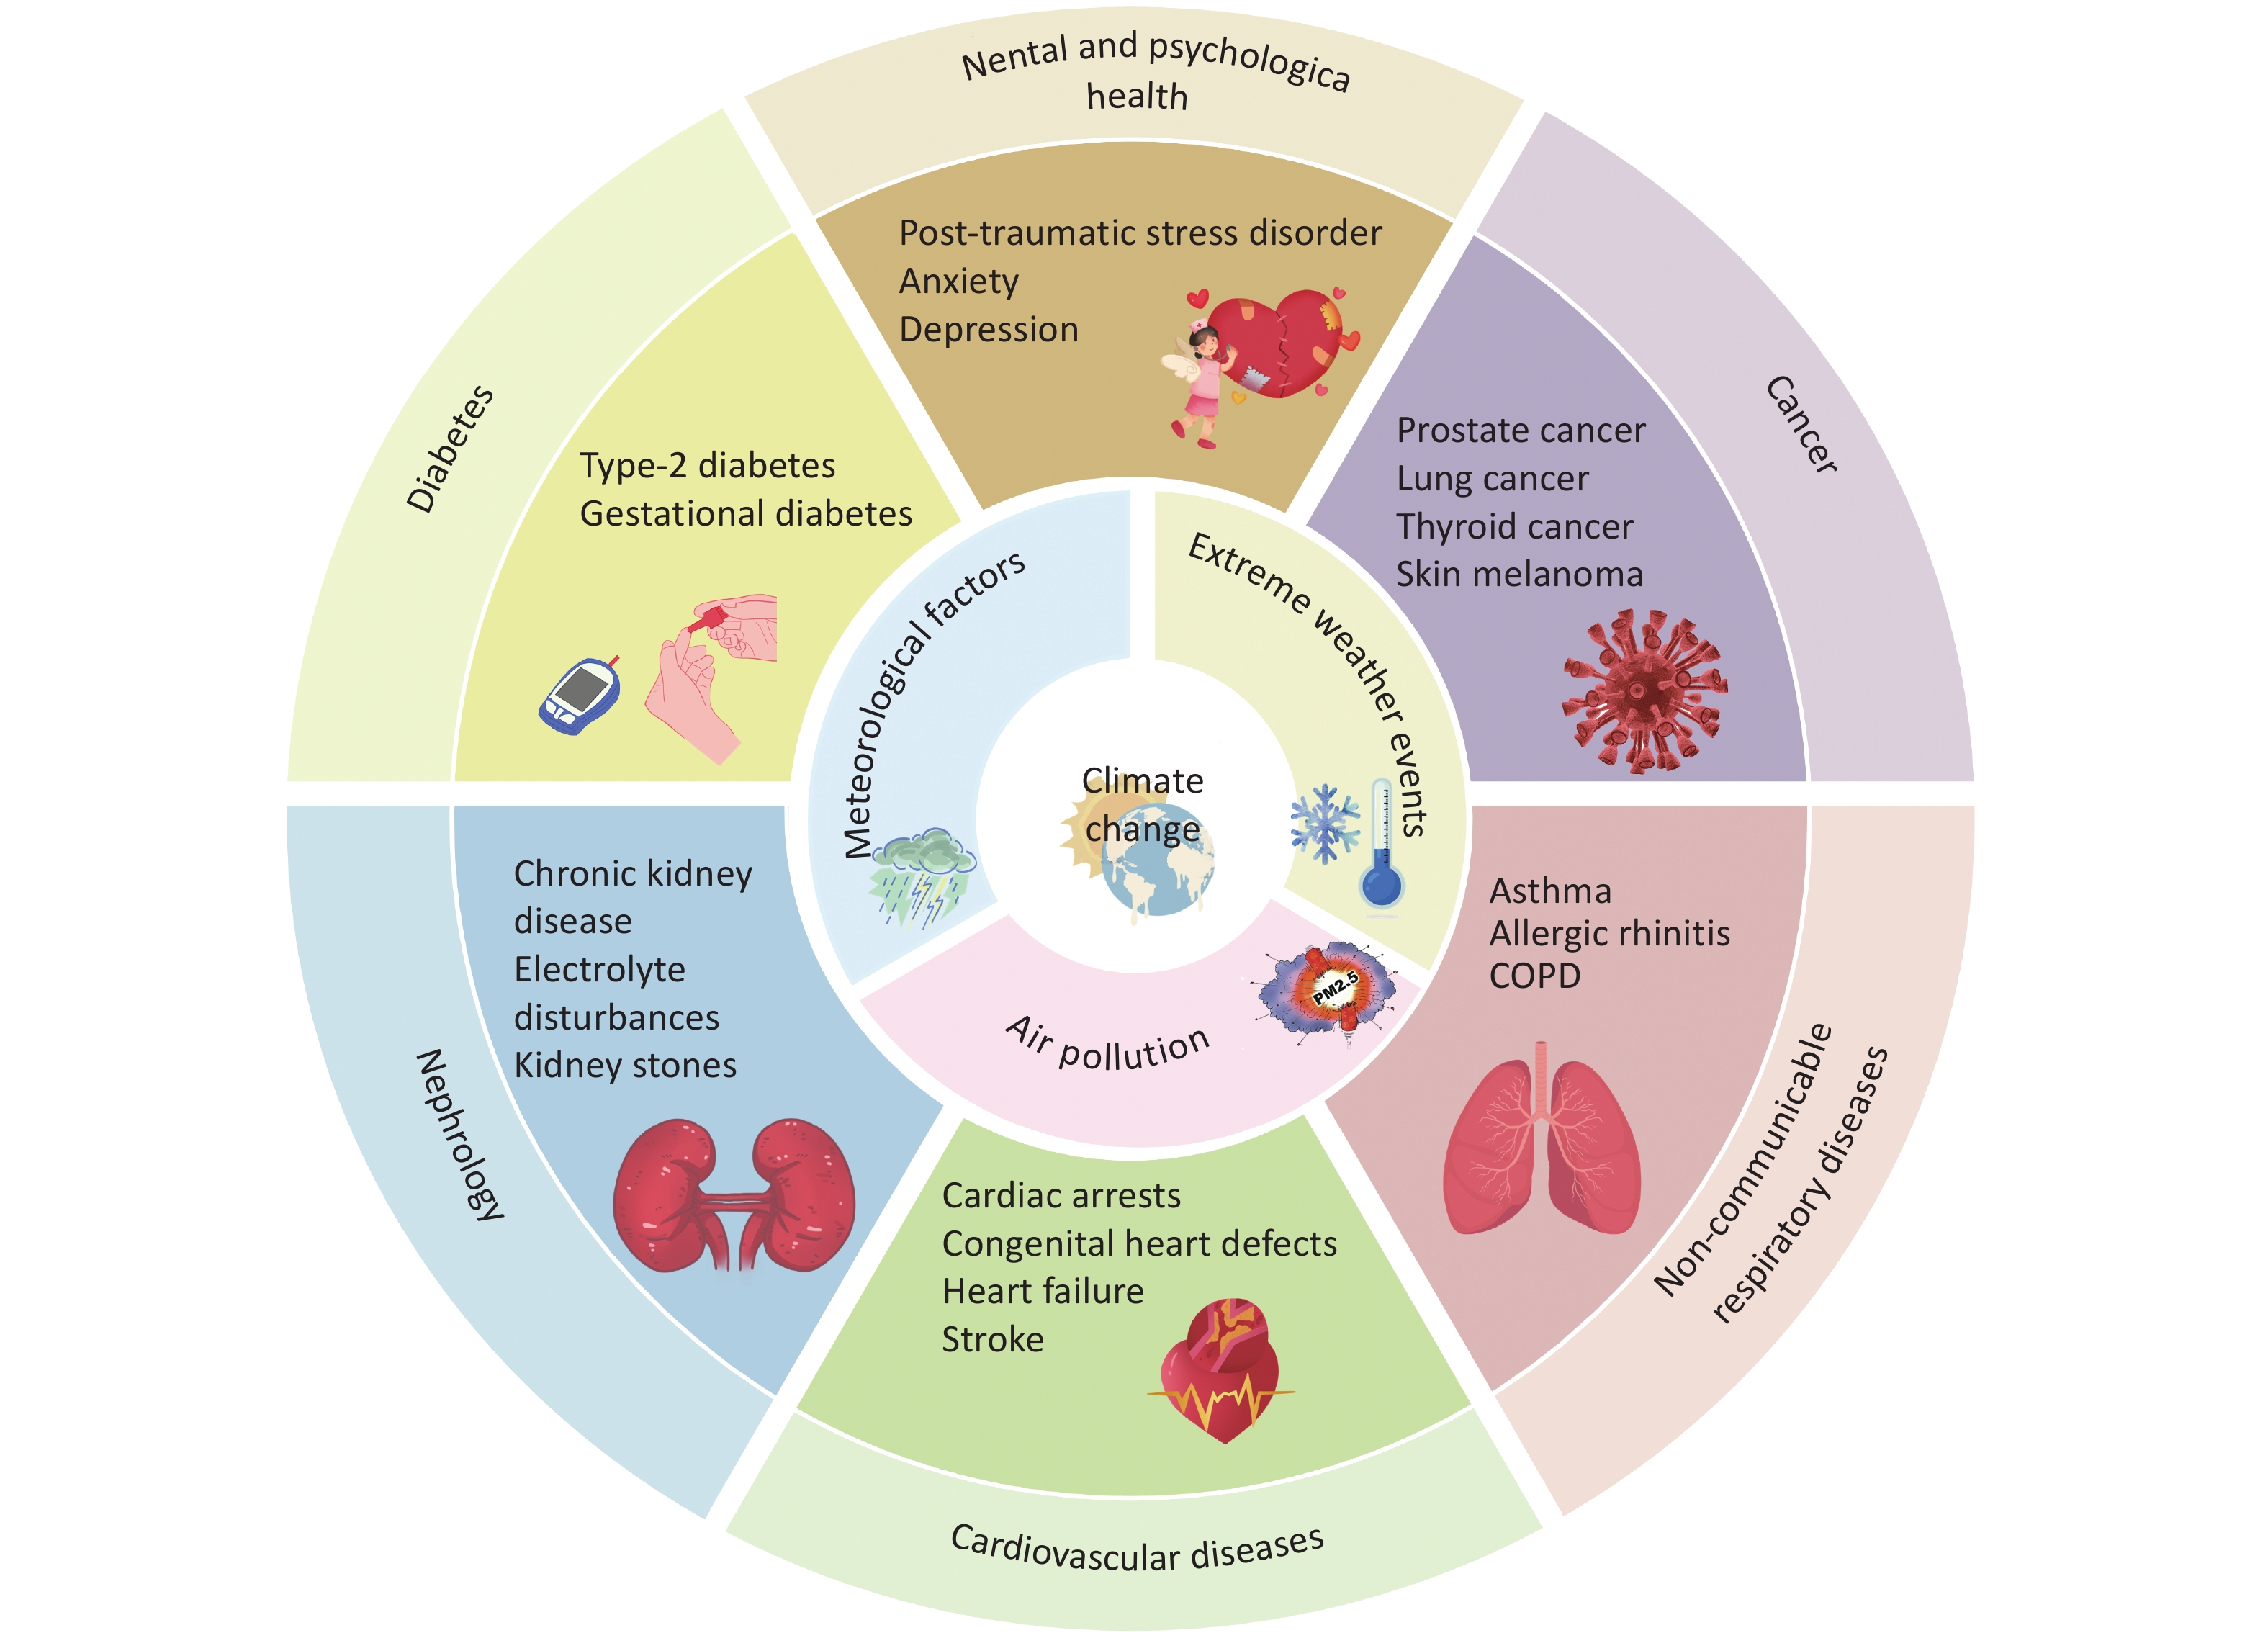
Chronic non-communicable diseases (NCDs) have significantly impacted morbidity and mortality worldwide, including China[94]. As indicated by Figure 4, rising temperatures, extreme weather events and air quality deterioration in the climate change context can intensify symptoms and increase the frequency of episodes for various NCDs, including cardiovascular diseases, diabetes, kidney disease, respiratory disease, mental and psychological health[95]. For example, a study on 272 cities in China showed that heatwaves can lead to a 7% increase in mortality rates, with an increase in mortality from cardiovascular disease, stroke, respiratory system disease, and chronic obstructive pulmonary disease by 14%, 12%, 13%, and 10%, respectively[96]. Besides, the potential impact of climate change on mental and psychological health is also receiving increasing attention[97].
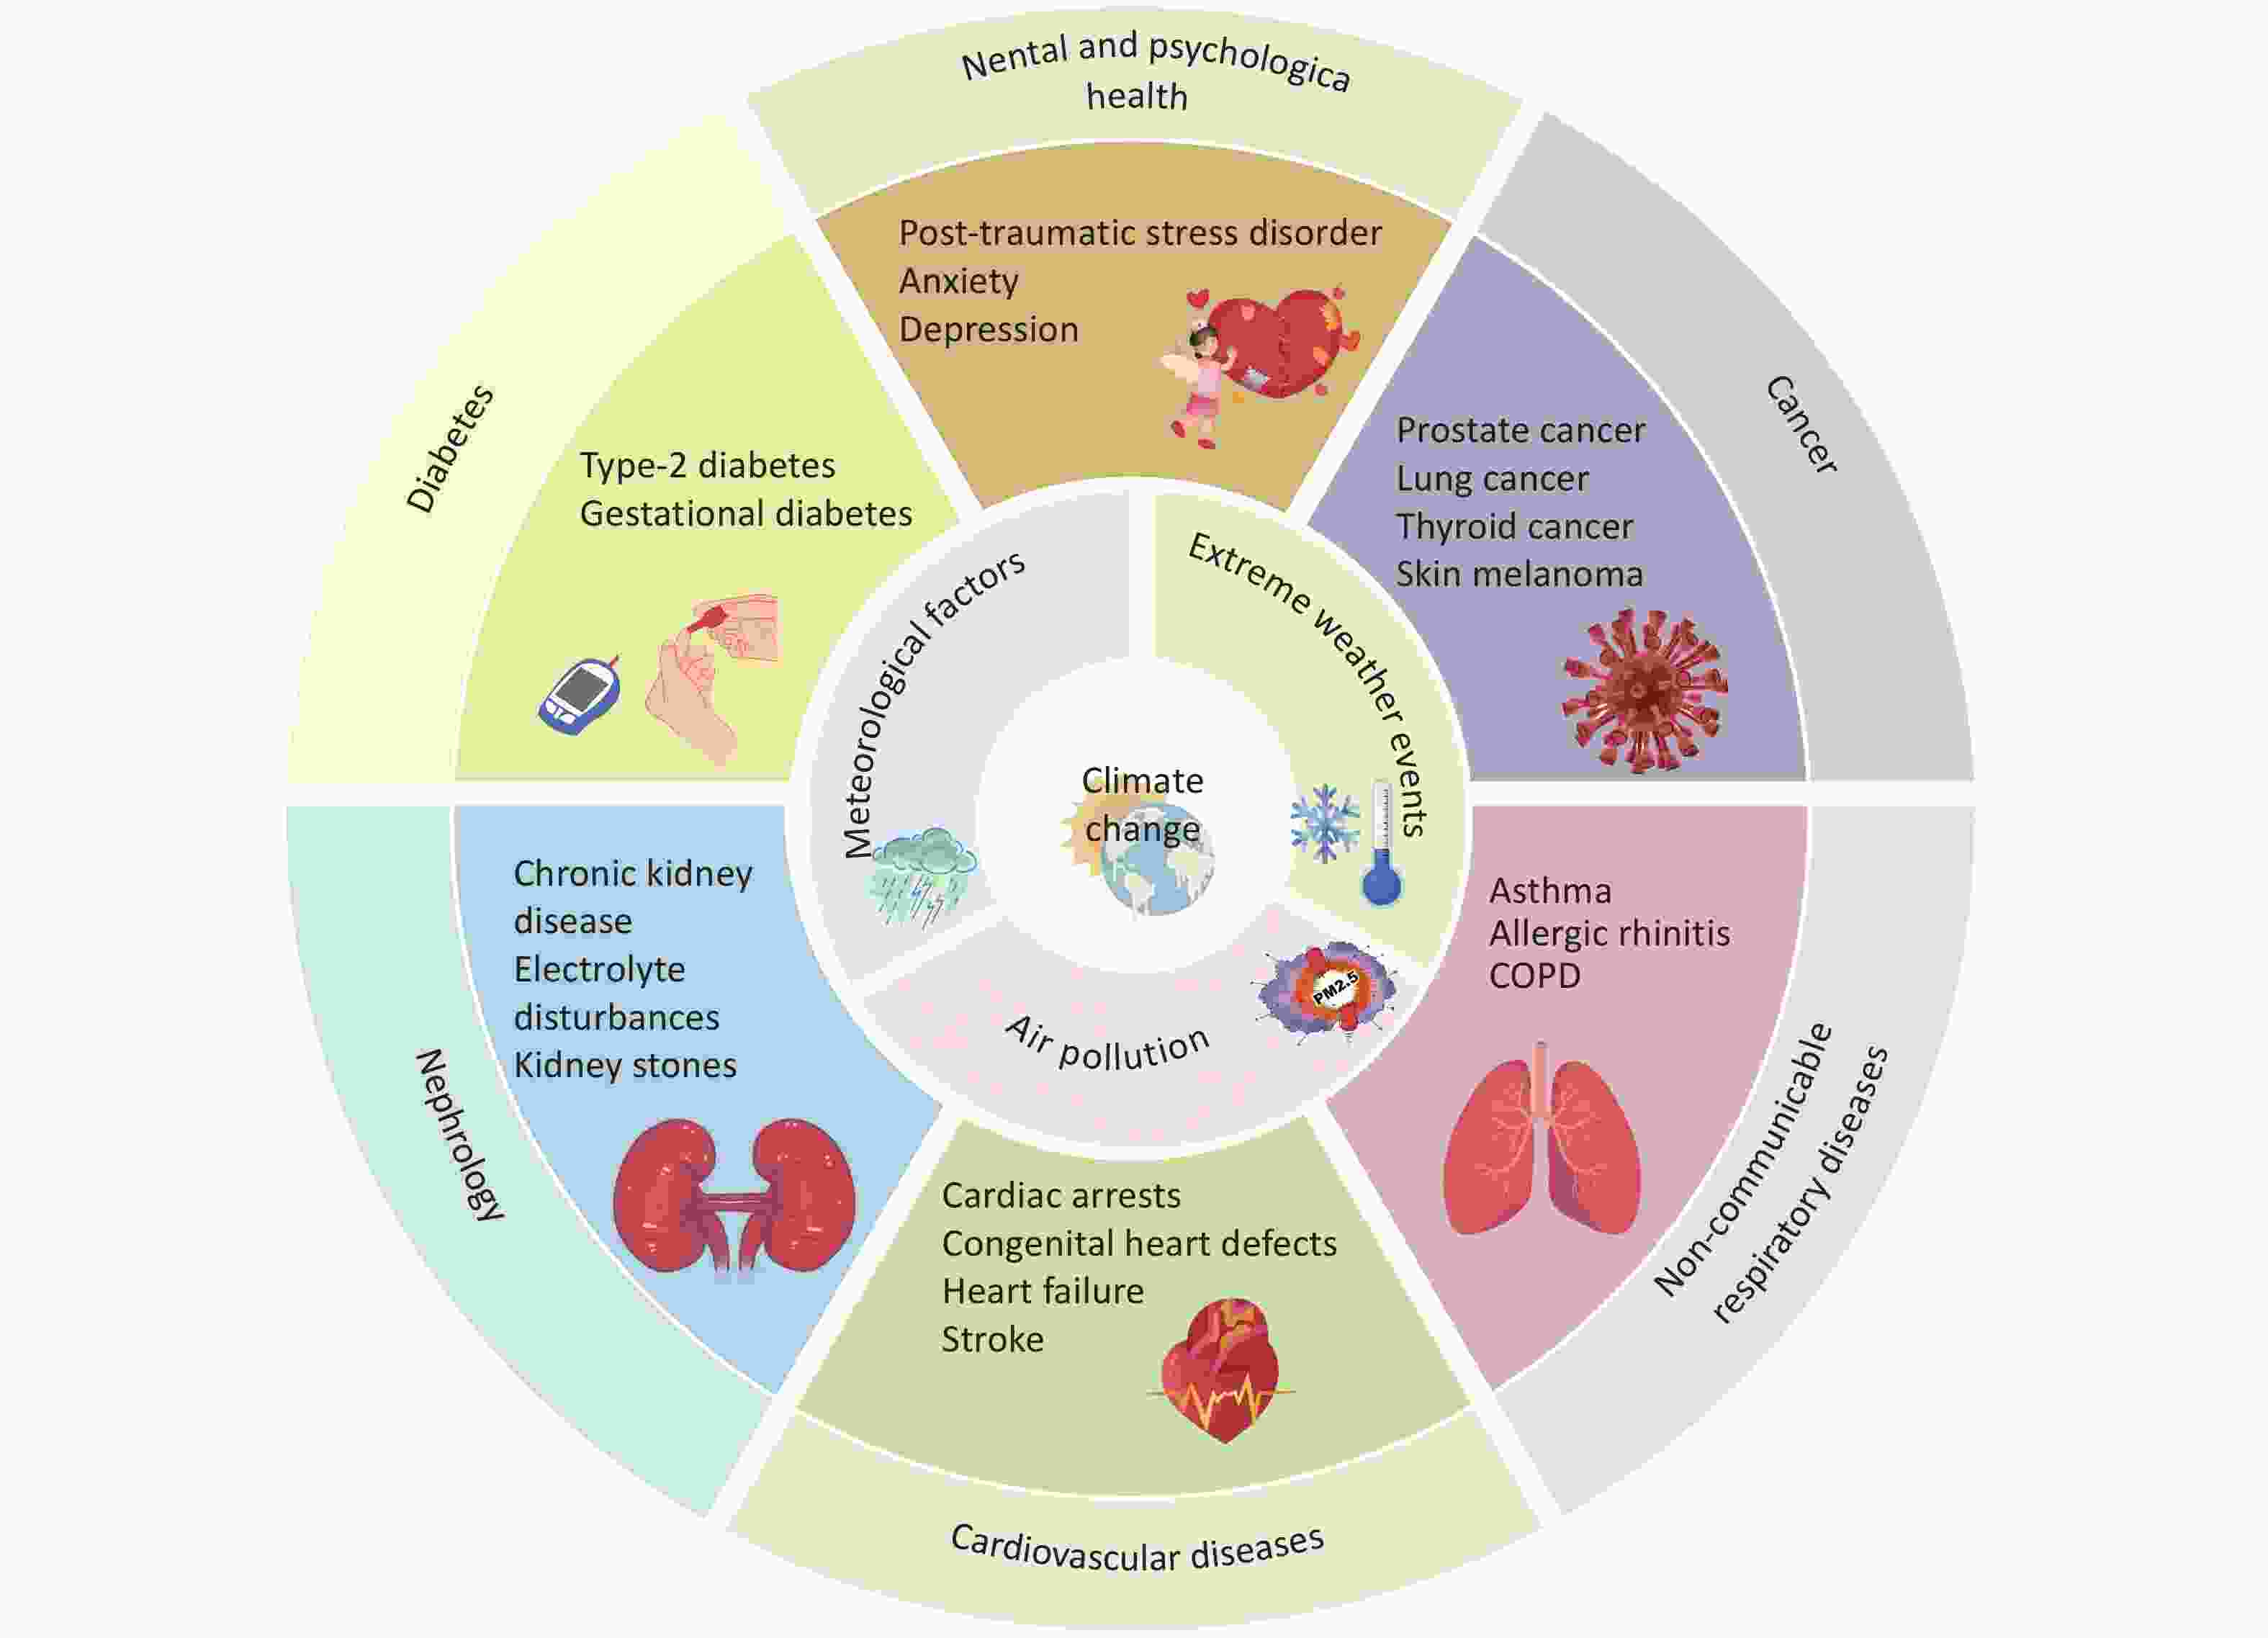
Figure 4. Impacts of climate change on non-communicable diseases.
-
Climate change significantly impacts cardiovascular diseases (CVD), which rank as the No. 1 killer and have a leading burden in China[98]. Increased exposure to high temperatures and extreme heat can exacerbate triggering heart attacks and strokes, while degraded air quality heightens the risks of heart-related complications[99]. Evidence from 272 Chinese cities showed that non-optimal temperatures significantly contribute to premature deaths from heart disease, with both extreme cold and high temperatures increasing the risk of mortality from various cardiovascular diseases, including coronary heart disease and stroke[100]. Exposure to extreme cold during pregnancy is associated with an increased risk of fetal congenital heart defects, particularly pulmonary stenosis and pulmonary atresia[101]. Climate change will increase the occurrence and severity of wildfires[102], and there is evidence of increased risk of CVD morbidity and mortality associated with wildfire smoke[103].
-
Non-communicable respiratory diseases (NCRDs) are also critical health conditions significantly influenced by climate change[95,104,105]. The major subtypes of NCRDs include asthma and chronic obstructive pulmonary disease (COPD)[106]. NCRDs exhibit a multifaceted etiology, wherein climate factors assume a critical position in their pathogenesis[107]. Climate-related pathways associated with NCRDs include increased levels of air pollutants, more frequent extreme temperature events and shifts in aeroallergen distribution and exposure durations[105]. Evidence from Hong Kong, China during the cool season revealed that individuals aged 75 years and older, females and economically inactive exhibited higher risk estimates for COPD associated with extreme cold[108]. A time series study in China indicated that daily mean temperature and air pressure played important roles in the occurrence of childhood allergic diseases (asthma and allergic rhinitis)[109].
-
As the diabetes prevalence continues rising, it is an increasingly important public health issue in China[110]. Previous study showed that an interquartile range increase in temperature was significantly associated with increased diabetes admissions (excess risk: 3.1%–4.8%)[111]. A case-crossover analysis revealed that extreme humidity was a crucial trigger for painful neuropathy onset in diabetes patients[112]. Type 2 diabetes may have impaired thermoregulation, including reduced blood flow and sweat gland function, impeding the radiative heat dissipation[113].
-
The kidney is particularly susceptible to the impacts of climate change[114]. Heat stroke, the most extreme form of heat stress, can result in severe electrolyte imbalances and contribute to both acute and chronic kidney disease (CKD)[115,116]. Even less severe heat stress can exacerbate kidney disease, increase the likelihood of kidney stones, and lead to various electrolyte imbalances, as well as trigger both acute and chronic kidney diseases[114]. A study across 261 cities found warmer temperatures linked to higher CKD hospitalization rates, notably in sub-tropical urban areas[117]. Each 1 °C rise in daily temperature raised the 7-day cumulative risk by 1.008% (95% CI: 1.003, 1.012). Another national survey covering 47,086 adults showed that the number of days per year exposed to heatwaves was associated with an increased prevalence of CKD[118].
-
As the third leading killer in China with increasing incidence, cancer is one of the major public health problems that seriously threaten the health of the Chinese population[119]. Climate change affects the occurrence of cancer through various pathways[120]. For example, climate change may enhance the spread and activity of carcinogens and persistent organic pollutants, including polyaromatic hydrocarbons, bromide, and polychlorinated biphenyls[121]. Environmental factors like precipitation, solar radiation[122], and temperature fluctuations could affect global cancer rates, with prostate, lung, thyroid cancers, and skin melanoma being particularly susceptible to climate change[122]. In addition, changes in ultraviolet exposure associated with changes in precipitation may increase the incidence of malignant melanoma[123].
-
Climate change and frequent meteorological disasters may lead to an increase in mental and psychological disorders[124]. Even 1.5-hour heat exposure may significantly increase anxiety symptoms[112]. Natural disasters such as floods and tornadoes can cause post-traumatic stress disorder (PTSD) and long-term negative effects on the mental health of survivors[124]. Over half of the tornado victims in Yancheng City, China, suffered from PTSD, which might lead to subsequent depression[125]. The impact of climate on the economy, society and food systems may also indirectly contribute to mental health problems[126]. Environmental damage also leads to feelings of worry and sadness. A study has found that natural disasters significantly reduced people’s happiness and well-being[127].
-
Several studies have examined climate change-related impacts on the burden of diseases in China. For example, a study assessed the trend of disease burden caused by high temperatures in China from 1990 to 2019 and predicted the trend of disease burden over the next 10 years[128]. It is reported that, in 2019, there were 13,907 deaths attributed to high temperatures in China, and this was 29.55% higher than the 10,735 deaths in 1990. The burden of disease due to high temperatures in China is estimated to be heavy over the next 10 years, mainly due to global warming, population aging and an increase in non-communicable diseases. Yang et al projected the excess mortality attributable to future high temperatures in 161 Chinese districts/counties under two representative concentration pathways (RCPs) after taking population ageing into account[129]. They found that heat-related excess mortality is projected to increase from 1.9% (95% eCI: 0.2%–3.3%) in the 2010s to 2.4% (0.4%–4.1%) in the 2030 s and 5.5% (0.5%–9.9%) in the 2090 s under RCP8.5. Nevertheless, Yin et al. utilized an ensemble of high-resolution (25 km) climate simulations and nationwide mortality data from 306 Chinese cities to estimate the mortality burden attributable to future warming[130]. They reported that under three climate scenarios (SSP126, SSP245, and SSP585), the national average temperature was projected to increase by 1.45, 2.57, and 4.98 °C by the 2090s, respectively. The corresponding mortality fractions attributable to heat would be 6.5% (eCI:5.2%, 7.7%), 7.9% (eCI:6.3%, 9.4%), and 11.4% (eCI:9.2%, 13.3%). Another study revealed future avoidable heat-related deaths associated with emission mitigation after accounting for population changes in China[131]. They found that 48%–72% (95% CI: 40%–76%) of heat-related deaths are due to human-induced climate change in the 21st century nationwide.
-
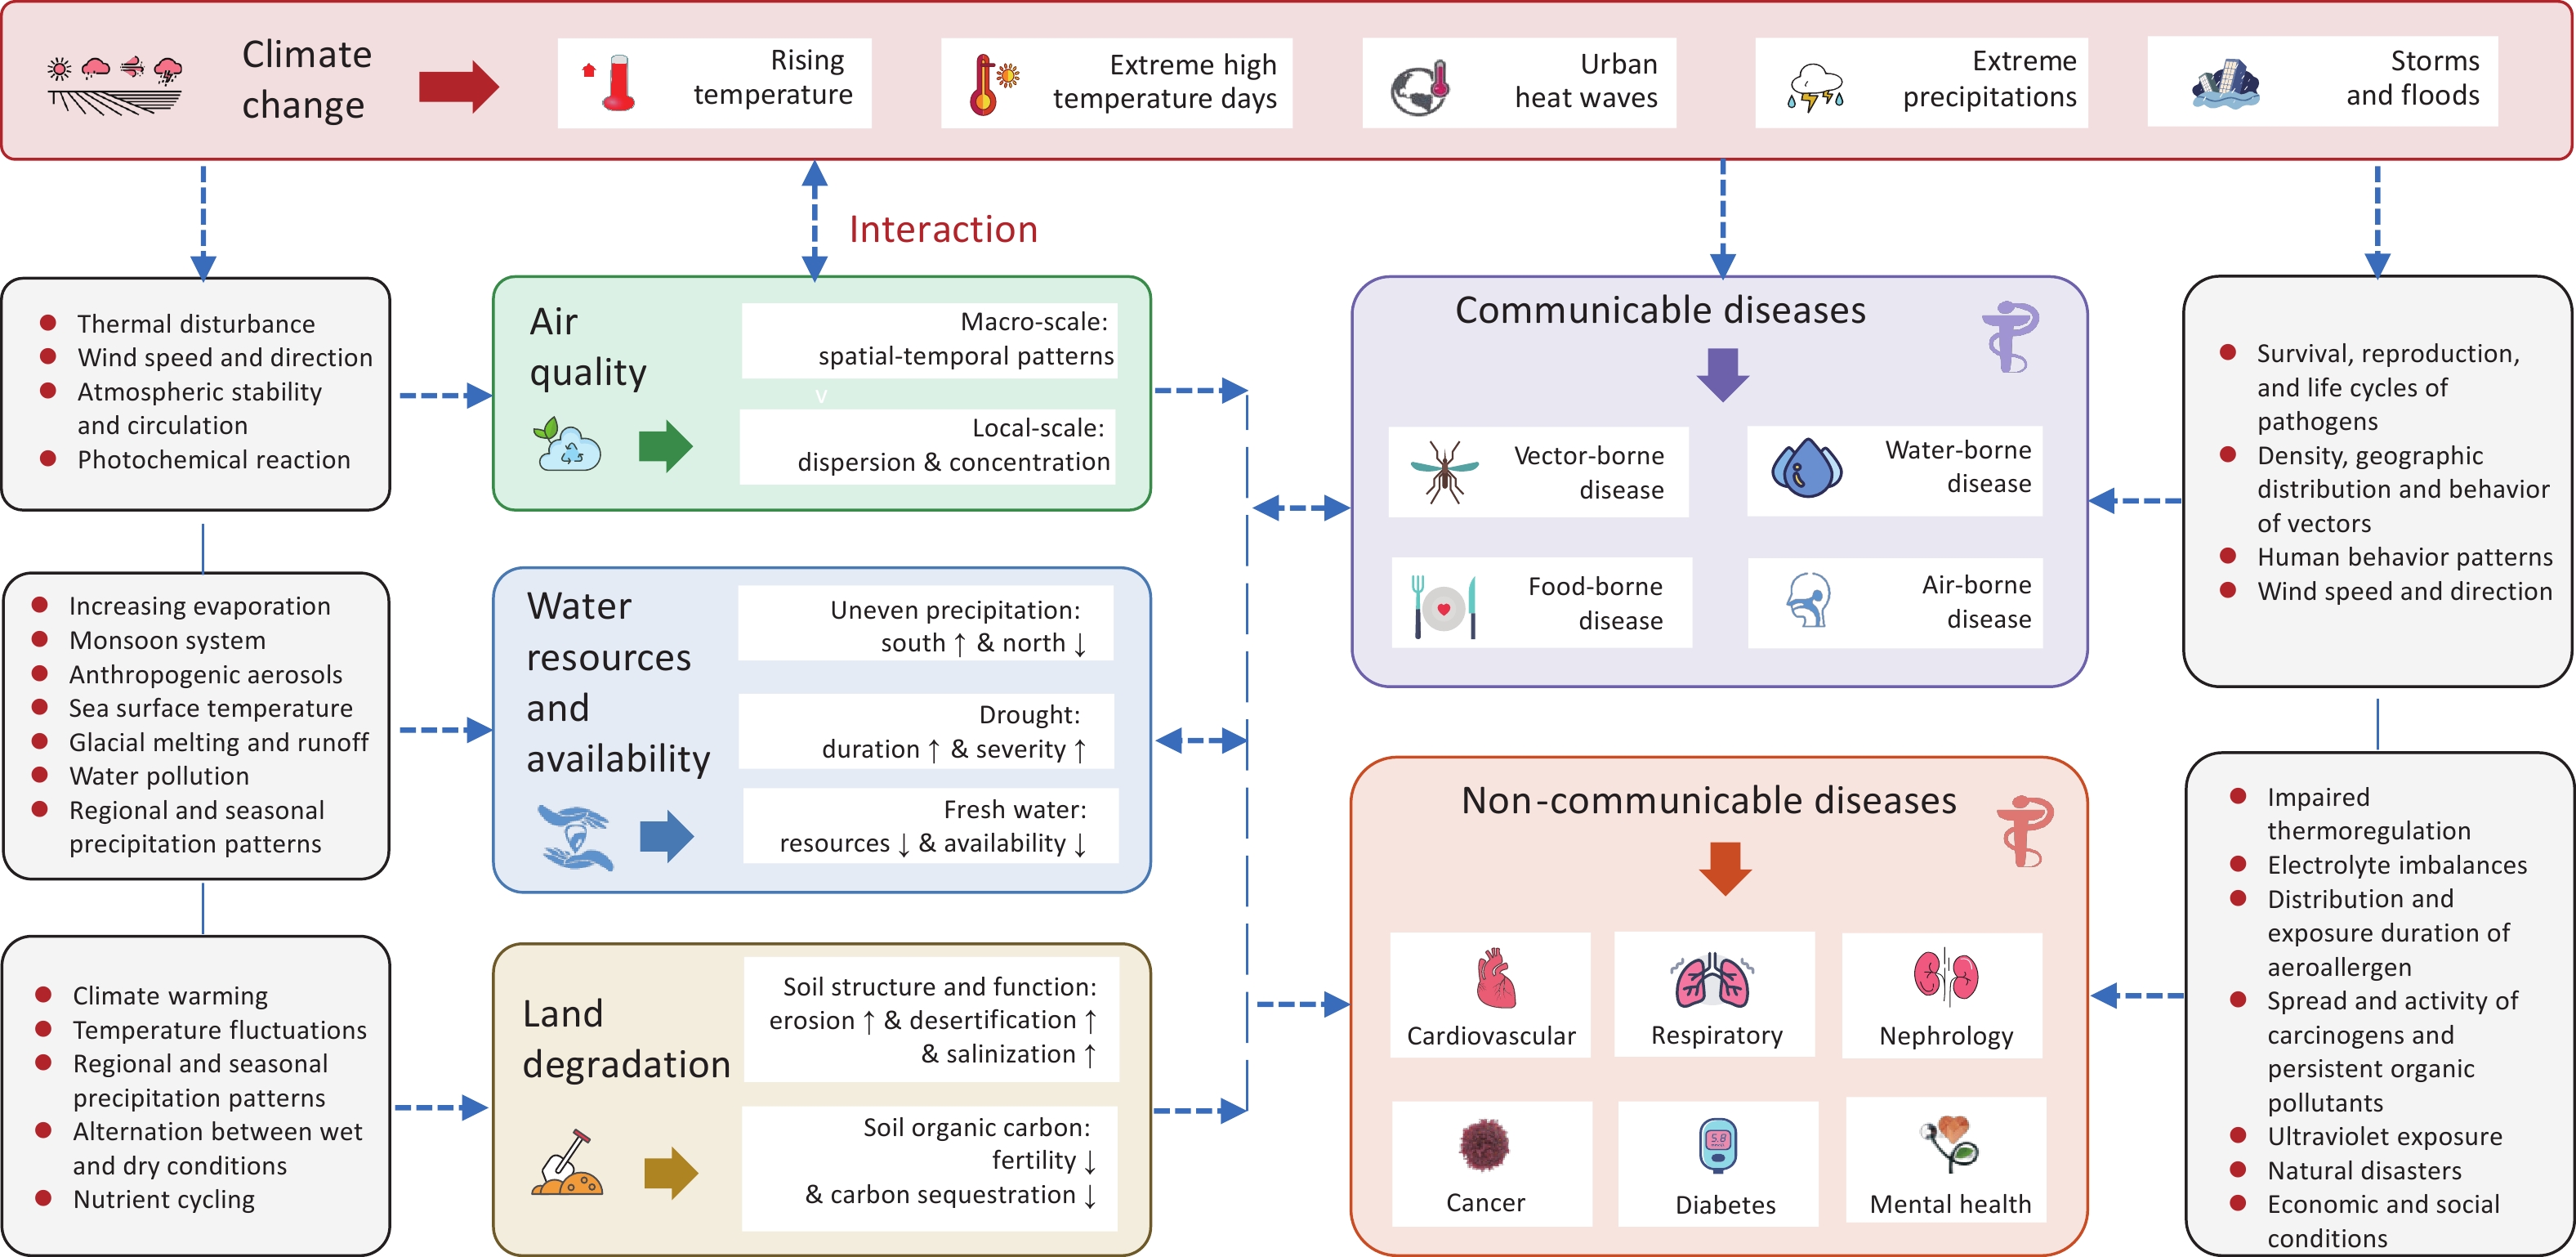
Evidently, the pace of climate change in China is greater than the global average level, with many devastating environmental impacts as demonstrated above. The impacts of climate change on the environment and human health have been consistently observed, and these impacts are escalating, particularly over recent decades. The interlinkage between climate change, environment and human health in China is reviewed by an interdisciplinary team in this study (Figure 5), which provides important evidence for government policy-making. It is imperative to integrate climate policy into China’s national plan for sustainable development because the society could be substantially and adversely affected if climate change exceeds dangerous thresholds, and therefore, more ambitious action is urgently needed. Such evidence may be highly valuable for not only China but also other countries, particularly developing and emerging economies.
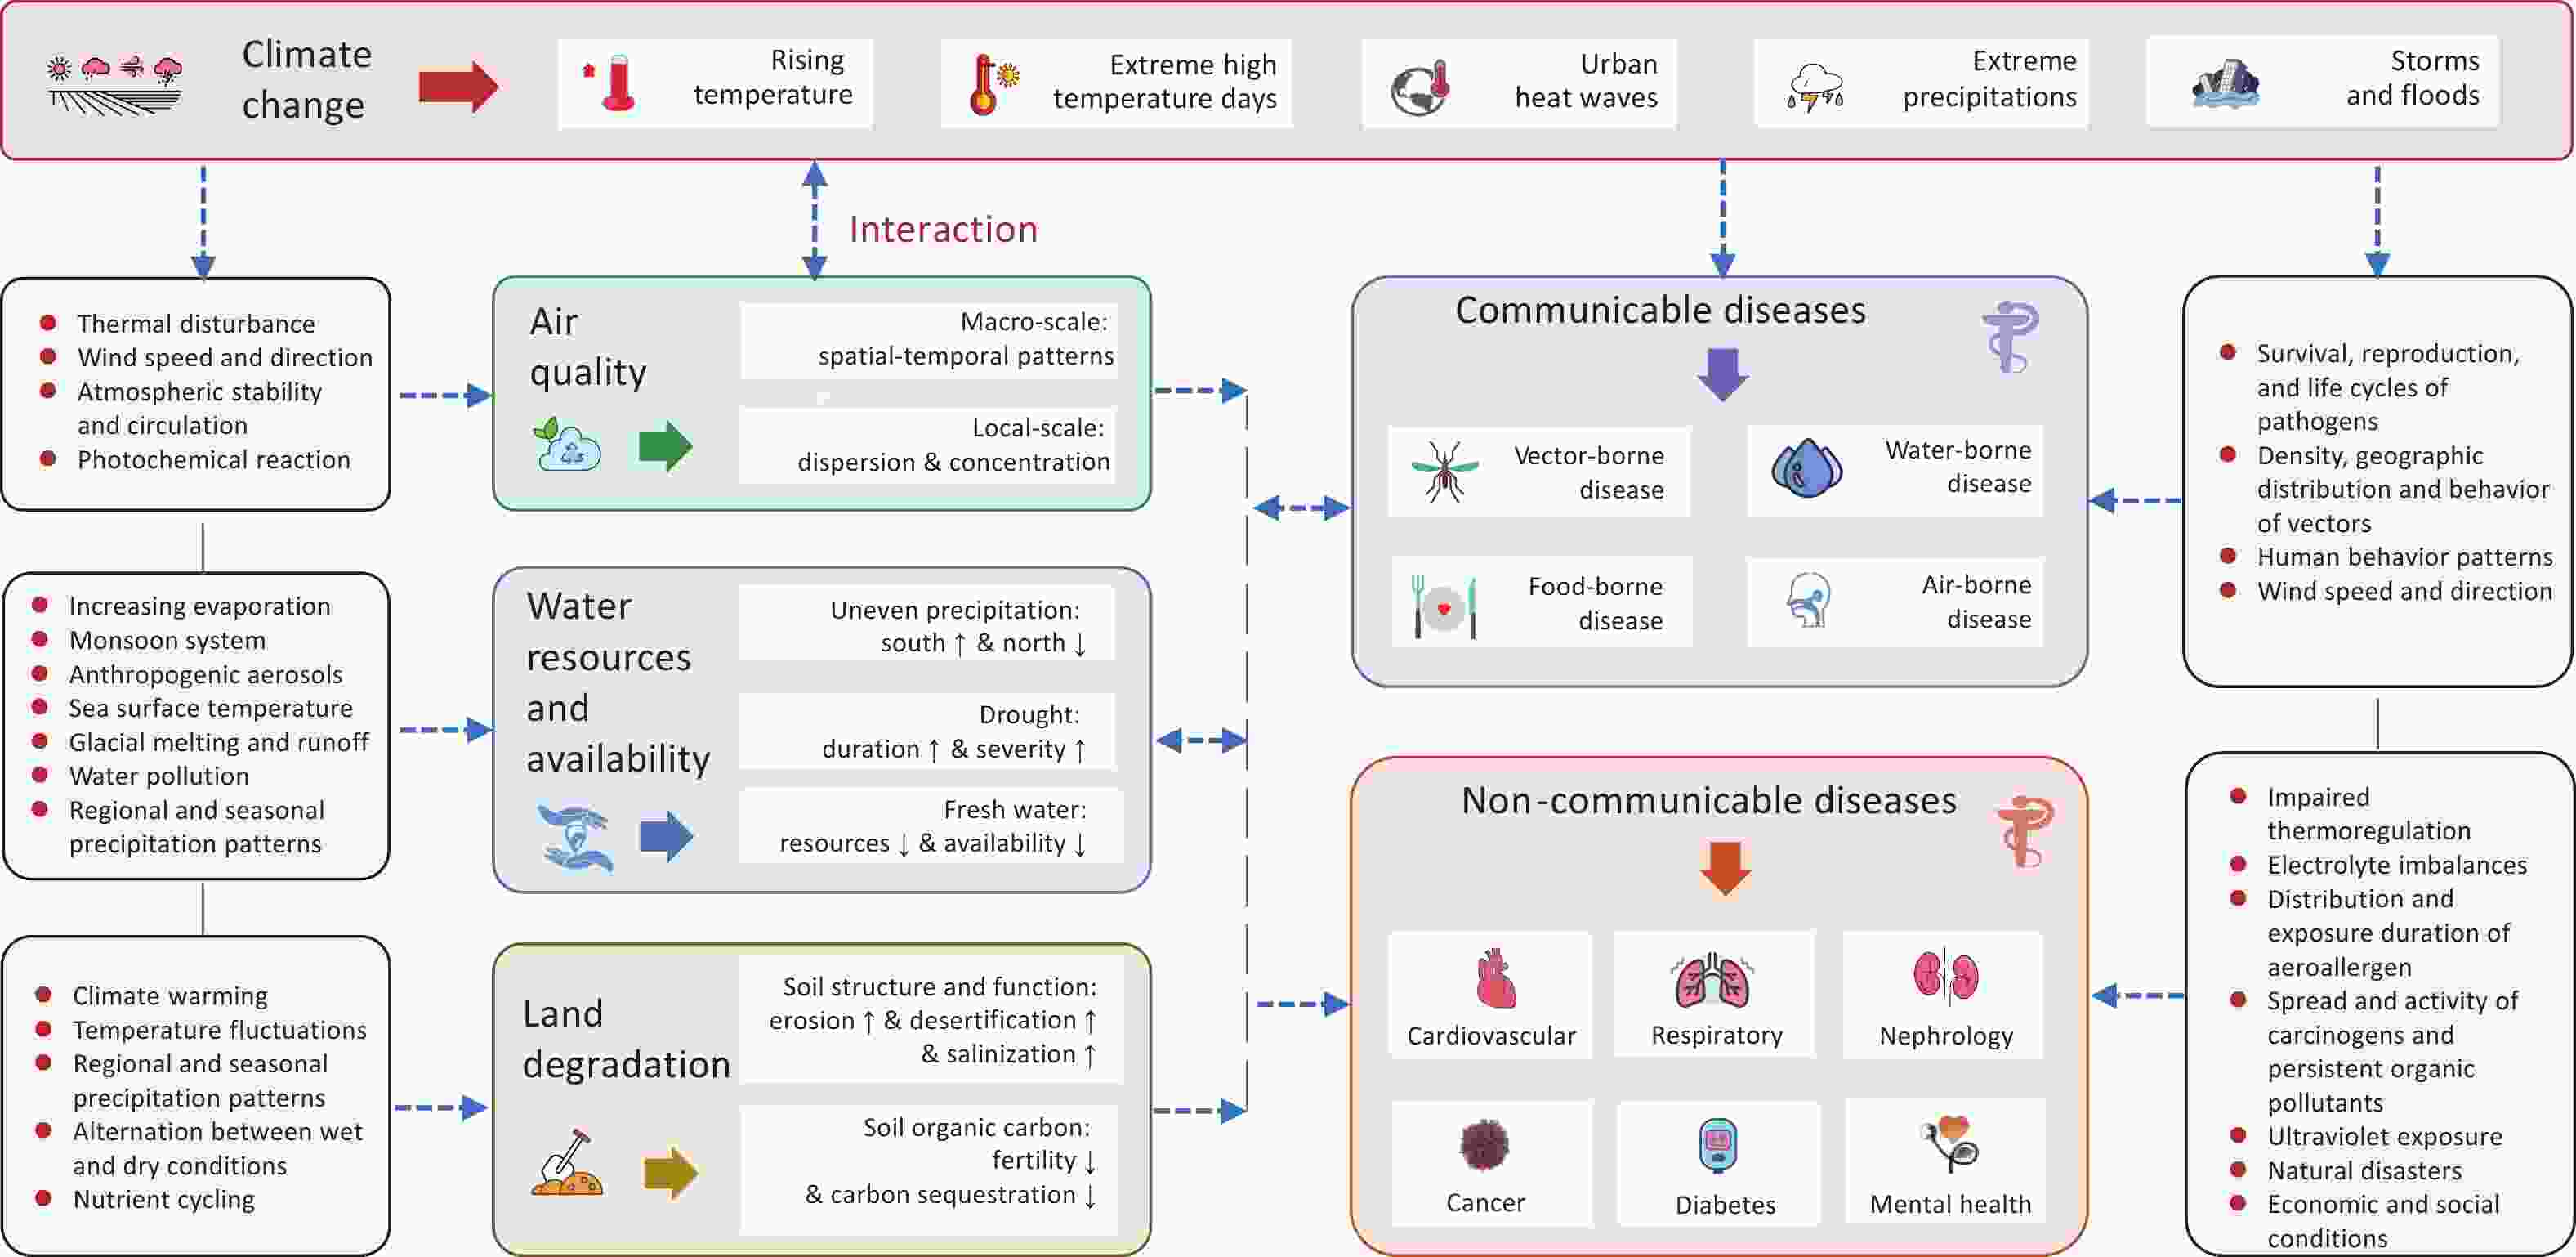
Figure 5. Climate change-related impacts on the environment and human health.
It is worth noting that, over recent years, China has been proactive in tackling the impacts of climate change. For example, in September 2020, China announced that it will peak carbon emissions by 2030 and achieve carbon neutrality by 2060 (so called “Dual Carbon Target” (DCT)) (www.xinhuanet.com/english/2020-09/22/c_139388500.htm). China has set up a schedule and roadmap, and made specific implementation plans for accomplishing this target (www.gov.cn/zhengce/content/2021-10/26/content_5644984.htm). Achieving the DCT is a broad and profound systemic economic and social transformation. It is fundamentally important to actively and steadily promote the DCT for mitigation of climate change and environmental pollution with the enhancement of human health and well-being.
Additionally, some important national strategies have been developed, for example, National Climate Change Adaptation Strategy 2035 (http://www.ncsc.org.cn/SY/syqhbh/202206/W020221026516413083356.pdf), Healthy China Action Plan (2019–2030) (http://en.nhc.gov.cn/HealthyChinaActionPlan.html), and National Action Plan on Health Adaptation to Climate Change (2024–2030) (https://chinadevelopmentbrief.org/reports/national-action-plan-on-health-adaptation-to-climate-change-2024-2030-released). It is abundantly clear that we should integrate both mitigation and adaptation policies in response to climate change and its impacts. Ambitious actions such as DCT for mitigation and improved urban planning, advanced early warning systems, and technological innovation for adaptation need to be implemented effectively. Only with immediate and ambitious climate action, can ecosystems be protected, and human health and wellbeing be sustained[132].
doi: 10.3967/bes2025.016
The Impacts of Climate Change on the Environment and Human Health in China: A Call for more Ambitious Action
-
Abstract: As global greenhouse gases continue rising, the urgency of more ambitious action is clearer than ever before. China is the world’s biggest emitter of greenhouse gases and one of the countries affected most by climate change. The evidence about the impacts of climate change on the environment and human health may encourage China to take more decisive action to mitigate greenhouse gas emissions and adapt to climate impacts. This article aimed to review the evidence of environmental damages and health risks posed by climate change and to provide a new science-based perspective for the delivery of sustainable development goals. Over recent decades, China has experienced a strong warming pattern with a growing frequency of extreme weather events, and the impacts of climate change on China’s environment and human health have been consistently observed, with increasing O3 air pollution, decreases in water resources and availability, land degradation, and increased risks for both communicable and non-communicable diseases. Therefore, China’s climate policy should target the key factors driving climate change and scale up strategic measures to curb carbon emissions and adapt to inevitable increasing climate impacts. It provides new insights for not only China but also other countries, particularly developing and emerging economies, to ensure climate and environmental sustainability whilst pursuing economic growth.Conceptualized the study: Shilu Tong, Yonglong Lu and Xiaoming Shi; Initiated the draft structure and finalized the paper: Shilu Tong; Performed climate change analysis: Cunde Xiao; Projected the trend of population weighted average PM2.5 concentration: Tong Zhu; Provided communicable disease data and performed related analysis: Qi Zhao. All co-authors equally participated in generating ideas, creating content and editing various versions of the manuscript.
The authors declare no competing interests.
No ethical approval is required as no individual data were used in this research.
注释:1) Authors’ Contributions: 2) Competing Interests: 3) Ethics: -
Figure 1. China’s climate and population density. This Figure was drawn by ourselves, based on publicly available online data (i.e., bzdt.ch.mnr.gov.cn/download.html/ and www.geodata.cn). The dark grey areas are not included due to data availability. Map approval number: GS(2025)0224.
Figure 2. The projected trend of population weighted average PM2.5 concentration (µg/m3) and PM2.5 associated loss in life expectance (year), up to 2025 under the Continuous Improvement of Air Quality Action Plan.
Figure 3. Annual incidence of four typical infectious diseases in mainland China between 2021–2022. (A) annual incidence of dengue fever; (B) other infectious diarrhea; (C) bacillary dysentery; (D) influenza. The dark grey areas are not included due to data availability. Map approval number: GS(2025)0224.
1. Climate change: evidence and projection
From 1901 to 2023, the annual mean surface air temperature in China exhibited a significantly upward trend (Box 1A). From 2014 to 2023, the mean surface air temperature was 0.52 °C above the normal, and 1.45 °C above the average value in 1961–1990, but there are remarkable regional differences[6]. The warming rate in northern China was significantly higher than that in the southern region, and it was higher in western China than in the eastern part. The Qinghai-Xizang region exhibited the largest warming rate of 0.35 °C per decade. By contrast, South China and Southwest China had a relatively slow warming rate with 0.21 °C /decade and 0.18 °C /decade, respectively. In 1961–2023, the average annual precipitation in China slightly increased, with inter-decadal variation (Box 1B). We have analyzed regional annual mean temperature (Box 1C) and precipitation (Box 1D) changes (in °C and %) over China (relative to 1995–2014) as projected by the multi-CMIP6 models for different time periods of the 21st century under different emission scenarios. The average daily maximum temperature (TXx) is anticipated to rise by 1.7–5.3 °C by the end of this century (2081–2100) under four scenarios, relative to 1995–2014 (Box 1E). The maximum 5-day rainfall (Rx5day) is projected to increase by 10%–24% by the end of the 21st century under the high emission scenario, with an increment of 3% per decade (Box 1F). Box 1. Observations and projections of climate change in China. (A) An upward trend of the mean surface air temperature. The mean surface air temperatures across China were consistently on the rise since 1900, but the warming rates were greater during 1961–2023 than before, with a remarkable difference by region. (B) In 1961–2023, the precipitation increment reached 5.2 mm/decade with distinct inter-decadal variation. In the 1990s, the average annual precipitation was more than normal, but in the first decade of the 21st century, it was generally below the normal level. Later, the situation was inverted again since 2012. Additionally, the variation trend of annual precipitation differed greatly by region. (C) Changes in annual mean temperature (°C) over China (relative to 1995–2014) as projected by the multi-CMIP6 models for different time periods of the 21st century under different emission scenarios, with the bold bars indicating the mean of the 19-model ensemble and the color boxes indicating the model range of 10%–90%. (D) Precipitation changes (%) as projected by the multi-CMIP6 models for different time periods of the 21st century under different emission scenarios, relative to 1995–2014. (E) Daily maximum temperature changes (TXx; in °C) (relative to 1995–2014) over China in the 21st century as projected by the CMIP6 23-model ensemble. (F) Changes in annual maximum 5-day precipitation amount (Rx5day; %) in 21st century as projected by the CMIP6 23-model ensemble, relative to 1995–2014. Sources: We adapted Box 1 Figure a and b from reference 6 with modification, and drew Box 1 Figure C, D, E and F with new data.  下载: 导出CSV
-
[1] IPCC. Climate change 2023: synthesis report summary for policymakers. IPCC. 2023. [2] World Meteorological Organization (WMO). State of the global climate 2023. WMO. 2024. [3] Larson C. Losing arable land, China faces stark choice: adapt or go hungry. Science, 2013; 339, 644−5. doi: 10.1126/science.339.6120.644 [4] She W. Hu Huanyong: father of China’s population geography. China Popul Today, 1998; 15, 20. [5] Luan GZ, Peng ZY, Zhao F, et al. Spatiotemporal dynamics of ecosystem supply service intensity in China: patterns, drivers, and implications for sustainable development. J Environ Manage, 2024; 367, 122042. [6] China Meteorological Administration. Blue book on climate change in China 2024. Science Press. 2024. (In Chinese) [7] China Meteorological Administration. China climate bulletin 2023. China Meteorological Administration. 2023. (In Chinese) [8] Yao TD, Bolch T, Chen DL, et al. The imbalance of the Asian water tower. Nat Rev Earth Environ, 2022; 3, 618−32. doi: 10.1038/s43017-022-00299-4 [9] Cai WJ, Zhang C, Zhang SH, et al. The 2024 China report of the Lancet Countdown on health and climate change: launching a new low-carbon, healthy journey. Lancet Public Health, 2024; 9, e1070−88. doi: 10.1016/S2468-2667(24)00241-X [10] Qin DH, Ding YJ, Zhai PM, et al. The change of climate and ecological environment in China 2021: synthesis report. Science Press. 2022. (In Chinese) [11] Zhang YX, Sun Y, Hu T. Changes in extreme high temperature warning indicators over China under different global warming levels. Sci China Earth Sci, 2024; 67, 1895−909. doi: 10.1007/s11430-023-1299-1 [12] Li W, Chen Y. Detectability of the trend in precipitation characteristics over China from 1961 to 2017. Int J Climatol, 2021; 41, E1980−91. [13] Zhang JY, Wang GQ, Jin JL, et al. Evolution and variation characteristics of the recorded runoff for the major rivers in China during 1956–2018. Adv Water Sci, 2020; 31, 153−61. (In Chinese) [14] Chen HP, Sun JQ, Lin WQ, et al. Comparison of CMIP6 and CMIP5 models in simulating climate extremes. Sci Bull, 2020; 65, 1415−8. doi: 10.1016/j.scib.2020.05.015 [15] Wang YJ, Wang AQ, Zhai JQ, et al. Tens of thousands additional deaths annually in cities of China between 1.5°C and 2.0°C warming. Nat Commun, 2019; 10, 3376. doi: 10.1038/s41467-019-11283-w [16] Li JD, Hao X, Liao H, et al. Winter particulate pollution severity in North China driven by atmospheric teleconnections. Nat Geosci, 2022; 15, 349−55. doi: 10.1038/s41561-022-00933-2 [17] Shindell DT, Miller RL, Schmidt GA, et al. Simulation of recent northern winter climate trends by greenhouse-gas forcing. Nature, 1999; 399, 452−5. doi: 10.1038/20905 [18] Ryu YH, Min SK. Anthropogenic warming degrades spring air quality in Northeast Asia by enhancing atmospheric stability and transboundary transport. npj Climate Atmos Sci, 2024; 7, 50. doi: 10.1038/s41612-024-00603-7 [19] Guan QY, Sun XZ, Yang J, et al. Dust storms in northern China: long-term spatiotemporal characteristics and climate controls. J Climate, 2017; 30, 6683−700. doi: 10.1175/JCLI-D-16-0795.1 [20] Cai WJ, Li K, Liao H, et al. Weather conditions conducive to Beijing severe haze more frequent under climate change. Nat Climate Change, 2017; 7, 257−62. doi: 10.1038/nclimate3249 [21] Zhao YC, Wang MY, Hu SJ, et al. Economics- and policy-driven organic carbon input enhancement dominates soil organic carbon accumulation in Chinese croplands. Proc Natl Acad Sci USA, 2018; 115, 4045−50. doi: 10.1073/pnas.1700292114 [22] Hong CP, Zhang Q, Zhang Y, et al. Impacts of climate change on future air quality and human health in China. Proc Natl Acad Sci USA, 2019; 116, 17193−200. doi: 10.1073/pnas.1812881116 [23] Hong CP, Zhang Q, Zhang Y, et al. Weakening aerosol direct radiative effects mitigate climate penalty on Chinese air quality. Nat Climate Change, 2020; 10, 845−50. doi: 10.1038/s41558-020-0840-y [24] Zeren YZ, Zhou BN, Zheng YH, et al. Does ozone pollution share the same formation mechanisms in the bay areas of China? Environ Sci Technol, 2022; 56, 14326-37. [25] Beckett KP, Freer‐Smith PH, Taylor G. Particulate pollution capture by urban trees: effect of species and windspeed. Glob Change Biol, 2000; 6, 995−1003. doi: 10.1046/j.1365-2486.2000.00376.x [26] He BJ, Ding L, Prasad D. Wind-sensitive urban planning and design: precinct ventilation performance and its potential for local warming mitigation in an open midrise gridiron precinct. J Build Eng, 2020; 29, 101145. doi: 10.1016/j.jobe.2019.101145 [27] O’Lenick CR, Wilhelmi OV, Michael R, et al. Urban heat and air pollution: a framework for integrating population vulnerability and indoor exposure in health risk analyses. Sci Total Environ, 2019; 660, 715−23. doi: 10.1016/j.scitotenv.2019.01.002 [28] Pfannerstill EY, Arata C, Zhu QD, et al. Temperature-dependent emissions dominate aerosol and ozone formation in Los Angeles. Science, 2024; 384, 1324−9. doi: 10.1126/science.adg8204 [29] Sun SA, Fang CL, Lv JY. Spatial inequality of water footprint in China: a detailed decomposition of inequality from water use types and drivers. J Hydrol, 2017; 553, 398−407. doi: 10.1016/j.jhydrol.2017.08.020 [30] Sun Y, Zhang XB, Ding YH, et al. Understanding human influence on climate change in China. Natl Sci Rev, 2022; 9, nwab113. doi: 10.1093/nsr/nwab113 [31] Ding YH, Wang ZY, Sun Y. Inter‐decadal variation of the summer precipitation in East China and its association with decreasing Asian summer monsoon. Part I: observed evidences. Int J Climatol, 2008; 28, 1139−61. doi: 10.1002/joc.1615 [32] Li HX, Chen HP, Sun B, et al. A detectable anthropogenic shift toward intensified summer hot drought events over northeastern China. Earth Space Sci, 2020; 7, e2019EA000836. doi: 10.1029/2019EA000836 [33] Wan LL, Bento VA, Qu YP, et al. Drought characteristics and dominant factors across China: insights from high-resolution daily SPEI dataset between 1979 and 2018. Sci Total Environ, 2023; 901, 166362. doi: 10.1016/j.scitotenv.2023.166362 [34] Sinha E, Michalak AM, Balaji V. Eutrophication will increase during the 21st century as a result of precipitation changes. Science, 2017; 357, 405−8. doi: 10.1126/science.aan2409 [35] Wang BD, Xin M, Wei QS, et al. A historical overview of coastal eutrophication in the China Seas. Mar Pollut Bull, 2018; 136, 394−400. doi: 10.1016/j.marpolbul.2018.09.044 [36] Wang YJ, Liu DY, Xiao WP, et al. Coastal eutrophication in China: trend, sources, and ecological effects. Harmful Algae, 2021; 107, 102058. doi: 10.1016/j.hal.2021.102058 [37] Wu JY. Challenges for safe and healthy drinking water in China. Curr Environ Health Rep, 2020; 7, 292−302. doi: 10.1007/s40572-020-00274-5 [38] Ding YH, Sun Y, Wang ZY, et al. Inter‐decadal variation of the summer precipitation in China and its association with decreasing Asian summer monsoon Part II: possible causes. Int J Climatol, 2009; 29, 1926−44. doi: 10.1002/joc.1759 [39] Yang K, Wu H, Qin J, et al. Recent climate changes over the Tibetan Plateau and their impacts on energy and water cycle: a review. Glob Planet Change, 2014; 112, 79−91. doi: 10.1016/j.gloplacha.2013.12.001 [40] Yang SL, Ding ZL, Li YY, et al. Warming-induced northwestward migration of the East Asian monsoon rain belt from the Last Glacial Maximum to the mid-Holocene. Proc Natl Acad Sci USA, 2015; 112, 13178−83. doi: 10.1073/pnas.1504688112 [41] Ma RH, Yang GS, Duan HT, et al. China’s lakes at present: number, area and spatial distribution. Sci China Earth Sci, 2011; 54, 283−9. doi: 10.1007/s11430-010-4052-6 [42] Zhang GQ, Yao TD, Chen WF, et al. Regional differences of lake evolution across China during 1960s–2015 and its natural and anthropogenic causes. Remote Sens Environ, 2019; 221, 386−404. doi: 10.1016/j.rse.2018.11.038 [43] Qin Y, Abatzoglou JT, Siebert S, et al. Agricultural risks from changing snowmelt. Nat Climate Change, 2020; 10, 459−65. doi: 10.1038/s41558-020-0746-8 [44] Georgiou K, Jackson RB, Vindušková O, et al. Global stocks and capacity of mineral-associated soil organic carbon. Nat Commun, 2022; 13, 3797. doi: 10.1038/s41467-022-31540-9 [45] Qiao L, Wang XH, Smith P, et al. Soil quality both increases crop production and improves resilience to climate change. Nat Climate Change, 2022; 12, 574−80. doi: 10.1038/s41558-022-01376-8 [46] Piao SL, Ciais P, Huang Y, et al. The impacts of climate change on water resources and agriculture in China. Nature, 2010; 467, 43−51. doi: 10.1038/nature09364 [47] Tang XL, Zhao X, Bai YF, et al. Carbon pools in China’s terrestrial ecosystems: new estimates based on an intensive field survey. Proc Natl Acad Sci USA, 2018; 115, 4021−6. doi: 10.1073/pnas.1700291115 [48] Crowther TW, Todd-Brown KEO, Rowe CW, et al. Quantifying global soil carbon losses in response to warming. Nature, 2016; 540, 104−8. doi: 10.1038/nature20150 [49] Wang MM, Zhang S, Guo XW, et al. Responses of soil organic carbon to climate extremes under warming across global biomes. Nat Climate Change, 2024; 14, 98−105. doi: 10.1038/s41558-023-01874-3 [50] Fang JY, Yu GR, Liu LL, et al. Climate change, human impacts, and carbon sequestration in China. Proc Natl Acad Sci USA, 2018; 115, 4015−20. doi: 10.1073/pnas.1700304115 [51] Zhang LM, Zheng QF, Liu YL, et al. Combined effects of temperature and precipitation on soil organic carbon changes in the uplands of eastern China. Geoderma, 2019; 337, 1105−15. doi: 10.1016/j.geoderma.2018.11.026 [52] Furtak K, Wolińska A. The impact of extreme weather events as a consequence of climate change on the soil moisture and on the quality of the soil environment and agriculture–A review. CATENA, 2023; 231, 107378. doi: 10.1016/j.catena.2023.107378 [53] Lu YL, Jenkins A, Ferrier RC, et al. Addressing China’s grand challenge of achieving food security while ensuring environmental sustainability. Sci Adv, 2015; 1, e1400039. doi: 10.1126/sciadv.1400039 [54] Borrelli P, Robinson DA, Panagos P, et al. Land use and climate change impacts on global soil erosion by water (2015-2070). Proc Natl Acad Sci USA, 2020; 117, 21994−2001. doi: 10.1073/pnas.2001403117 [55] Zhao HF, Lin YH, Zhou J, et al. Quantifying the dynamic processes of soil erosion and lake sediment deposition in the Holocene in China. Quat Sci Rev, 2023; 304, 107993. doi: 10.1016/j.quascirev.2023.107993 [56] Li R, Napier TL, El-Swaify SA, et al. Global degradation of soil and water resources: regional assessment and strategies. Springer. 2022. [57] Wen X, Deng XZ. Current soil erosion assessment in the Loess Plateau of China: a mini-review. J Clean Prod, 2020; 276, 123091. doi: 10.1016/j.jclepro.2020.123091 [58] Zhang Q, Yin ZC, Lu X, et al. Synergetic roadmap of carbon neutrality and clean air for China. Environ Sci Ecotechnol, 2023; 16, 100280. doi: 10.1016/j.ese.2023.100280 [59] Tong D, Cheng J, Liu Y, et al. Dynamic projection of anthropogenic emissions in China: methodology and 2015–2050 emission pathways under a range of socio-economic, climate policy, and pollution control scenarios. Atmos Chem Phys, 2020; 20, 5729−57. doi: 10.5194/acp-20-5729-2020 [60] Qi XM, Zhu CJ, Chen LD, et al. Aerosol‐cloud interactions near cloud base deteriorating the haze pollution in East China. Geophys Res Lett, 2024; 51, e2024GL109975. doi: 10.1029/2024GL109975 [61] Ding AJ, Huang X, Nie W, et al. Enhanced haze pollution by black carbon in megacities in China. Geophys Res Lett, 2016; 43, 2873−9. doi: 10.1002/2016GL067745 [62] Huang W, Cao JJ, Tao YB, et al. Seasonal variation of chemical species associated with short-term mortality effects of PM2.5 in Xi’an, a central city in China. Am J Epidemiol, 2012; 175, 556−66. doi: 10.1093/aje/kwr342 [63] Ai SQ, Lu H, Liu HY, et al. All-cause mortality attributable to long-term changes in mean temperature and diurnal temperature variation in China: a nationwide quasi-experimental study. Environ Res Lett, 2024; 19, 014002. doi: 10.1088/1748-9326/ad0d3d [64] Tong MK, Wang M, Li PF, et al. The short-term effect of ozone on pregnancy loss modified by temperature: findings from a nationwide epidemiological study in the contiguous United States. Sci Total Environ, 2023; 902, 166088. doi: 10.1016/j.scitotenv.2023.166088 [65] Chen X, Zhu T, Wang Q, et al. Higher temperature and humidity exacerbate pollutant-associated lung dysfunction in the elderly. Environ Res, 2024; 245, 118039. doi: 10.1016/j.envres.2023.118039 [66] Xue T, Kang N, Wan W, et al. Health-oriented strategies are needed to optimize China’s 2025 clean air action plan. Sci Bull, 2024; 69, 2007−8. doi: 10.1016/j.scib.2024.05.019 [67] Mora C, McKenzie T, Gaw IM, et al. Over half of known human pathogenic diseases can be aggravated by climate change. Nat Climate Change, 2022; 12, 869−75. doi: 10.1038/s41558-022-01426-1 [68] Thomson MC, Stanberry LR. Climate change and vectorborne diseases. N Engl J Med, 2022; 387, 1969−78. doi: 10.1056/NEJMra2200092 [69] Marselle MR, Stadler J, Korn H, et al. Biodiversity and health in the face of climate change. Springer. 2019. [70] Luo YZ, Lv H, Yan HC, et al. Meteorological change and hemorrhagic fever with renal syndrome epidemic in China, 2004–2018. Sci Rep, 2022; 12, 20037. doi: 10.1038/s41598-022-23945-9 [71] Reported cases and deaths of national notifiable infectious diseases—China, December, 2019. China CDC Wkly 2020; 2, 94-5. [72] Chala B, Hamde F. Emerging and re-emerging vector-borne infectious diseases and the challenges for control: a review. Front Public Health, 2021; 9, 715759. doi: 10.3389/fpubh.2021.715759 [73] Li CX, Wang ZD, Yan Y, et al. Association between hydrological conditions and dengue fever incidence in coastal southeastern China from 2013 to 2019. JAMA Netw Open, 2023; 6, e2249440. doi: 10.1001/jamanetworkopen.2022.49440 [74] Li CX, Liu Z, Li W, et al. Projecting future risk of dengue related to hydrometeorological conditions in mainland China under climate change scenarios: a modelling study. Lancet Planet Health, 2023; 7, e397−406. doi: 10.1016/S2542-5196(23)00051-7 [75] Moore AC, Herwaldt BL, Craun GF, et al. Waterborne disease in the United States, 1991 and 1992. J. AWWA, 1994; 86, 87−97. doi: 10.1002/j.1551-8833.1994.tb06155.x [76] Nichols G, Lake I, Heaviside C. Climate change and water-related infectious diseases. Atmosphere, 2018; 9, 385. doi: 10.3390/atmos9100385 [77] Semenza JC, Ko AI. Waterborne diseases that are sensitive to climate variability and climate change. N Engl J Med, 2023; 389, 2175−87. doi: 10.1056/NEJMra2300794 [78] Yu WH, Zhuang MW, Geng MJ, et al. Association between hydrometeorological conditions and infectious diarrhea in mainland China: a spatiotemporal modeling study. Environ Res Lett, 2024; 19, 064004. doi: 10.1088/1748-9326/ad44b4 [79] Zhang N, Song DD, Zhang J, et al. The impact of the 2016 flood event in Anhui Province, China on infectious diarrhea disease: an interrupted time-series study. Environ Int, 2019; 127, 801−9. doi: 10.1016/j.envint.2019.03.063 [80] Gould LH, Walsh KA, Vieira AR, et al. Surveillance for foodborne disease outbreaks - United States, 1998-2008. MMWR Surveill Summ, 2013; 62, 1−34. [81] Li HQ, Li WW, Dai Y, et al. Characteristics of settings and etiologic agents of foodborne disease outbreaks—China, 2020. China CDC Wkly, 2021; 3, 889−93. doi: 10.46234/ccdcw2021.219 [82] Li WW, Pires SM, Liu ZT, et al. Surveillance of foodborne disease outbreaks in China, 2003–2017. Food Control, 2020; 118, 107359. doi: 10.1016/j.foodcont.2020.107359 [83] Parray JA, Bandh SA, Shameem N. Climate change and microbes. Apple Academic Press. 2022. [84] Singh BK, Delgado-Baquerizo M, Egidi E, et al. Climate change impacts on plant pathogens, food security and paths forward. Nat Rev Microbiol, 2023; 21, 640−56. doi: 10.1038/s41579-023-00900-7 [85] Ma Y, Wen T, Xing DG, et al. Associations between floods and bacillary dysentery cases in main urban areas of Chongqing, China, 2005–2016: a retrospective study. Environ Health Prev Med, 2021; 26, 49. doi: 10.1186/s12199-021-00971-z [86] Liu ZD, Tong MX, Xiang JJ, et al. Daily temperature and bacillary dysentery: estimated effects, attributable risks, and future disease burden in 316 Chinese cities. Environ Health Perspect, 2020; 128, 057008. doi: 10.1289/EHP5779 [87] Jiang Y, Dou XF, Yan CQ, et al. Epidemiological characteristics and trends of notifiable infectious diseases in China from 1986 to 2016. J Glob Health, 2020; 10, 020803. doi: 10.7189/jogh.10.020803 [88] Mao Y, He RX, Zhu B, et al. Notifiable respiratory infectious diseases in China: a spatial–temporal epidemiology analysis. Int J Environ Res Public Health, 2020; 17, 2301. doi: 10.3390/ijerph17072301 [89] Feng QS, Zhang GL, Chen L, et al. Roadmap for ending TB in China by 2035: the challenges and strategies. Biosci Trends, 2024; 18, 11−20. doi: 10.5582/bst.2023.01325 [90] Li J, Chen YZ, Wang XL, et al. Influenza-associated disease burden in mainland China: a systematic review and meta-analysis. Sci Rep, 2021; 11, 2886. doi: 10.1038/s41598-021-82161-z [91] Mirsaeidi M, Motahari H, Taghizadeh Khamesi M, et al. Climate change and respiratory infections. Ann Am Thorac Soc, 2016; 13, 1223−30. doi: 10.1513/AnnalsATS.201511-729PS [92] Yin Y, Lai M, Lu KL, et al. Association between ambient temperature and influenza prevalence: a nationwide time-series analysis in 201 Chinese cities from 2013 to 2018. Environ Int, 2024; 189, 108783. doi: 10.1016/j.envint.2024.108783 [93] Li ZQ, Liu Q, Zhan MY, et al. Meteorological factors contribute to the risk of pulmonary tuberculosis: a multicenter study in eastern China. Sci Total Environ, 2021; 793, 148621. doi: 10.1016/j.scitotenv.2021.148621 [94] Breda J, Wickramasinghe K, Peters DH, et al. One size does not fit all: implementation of interventions for non-communicable diseases. BMJ, 2019; 367, l6434. [95] IPCC. Climate change 2022: impacts, adaptation and vulnerability. Contribution of working group ii to the sixth assessment report of the intergovernmental panel on climate change. Cambridge University Press. 2022. [96] Yin P, Chen RJ, Wang LJ, et al. The added effects of heatwaves on cause-specific mortality: a nationwide analysis in 272 Chinese cities. Environ Int, 2018; 121, 898−905. doi: 10.1016/j.envint.2018.10.016 [97] Li DY, Zhang Y, Li XY, et al. Climatic and meteorological exposure and mental and behavioral health: a systematic review and meta-analysis. Sci Total Environ, 2023; 892, 164435. doi: 10.1016/j.scitotenv.2023.164435 [98] GBD 2021 Forecasting Collaborators. Burden of disease scenarios for 204 countries and territories, 2022–2050: a forecasting analysis for the Global Burden of Disease Study 2021. Lancet, 2024; 403, 2204−56. doi: 10.1016/S0140-6736(24)00685-8 [99] Alahmad B, Khraishah H, Royé D, et al. Associations between extreme temperatures and cardiovascular cause-specific mortality: results from 27 countries. Circulation, 2023; 147, 35−46. doi: 10.1161/CIRCULATIONAHA.122.061832 [100] Chen RJ, Yin P, Wang LJ, et al. Association between ambient temperature and mortality risk and burden: time series study in 272 main Chinese cities. BMJ, 2018; 363, k4306. [101] Guo JH, Ruan YP, Wang YQ, et al. Maternal exposure to extreme cold events and risk of congenital heart defects: a large multicenter study in China. Environ Sci Technol, 2024; 58, 3737−46. doi: 10.1021/acs.est.3c10306 [102] Jain P, Castellanos-Acuna D, Coogan SCP, et al. Observed increases in extreme fire weather driven by atmospheric humidity and temperature. Nat Climate Change, 2022; 12, 63−70. doi: 10.1038/s41558-021-01224-1 [103] Chen GB, Guo YM, Yue X, et al. All-cause, cardiovascular, and respiratory mortality and wildfire-related ozone: a multicountry two-stage time series analysis. Lancet Planet Health, 2024; 8, e452−62. doi: 10.1016/S2542-5196(24)00117-7 [104] Cockcroft DW. Epidemic thunderstorm asthma. Lancet Planet Health, 2018; 2, e236−7. doi: 10.1016/S2542-5196(18)30123-2 [105] Deng SZ, Jalaludin BB, Antó JM, et al. Climate change, air pollution, and allergic respiratory diseases: a call to action for health professionals. Chin Med J, 2020; 133, 1552−60. doi: 10.1097/CM9.0000000000000861 [106] Ferkol T, Schraufnagel D. The global burden of respiratory disease. Ann Am Thorac Soc, 2014; 11, 404−6. doi: 10.1513/AnnalsATS.201311-405PS [107] D’Amato G, Chong-Neto HJ, Monge-Ortega OP, et al. The effects of climate change on respiratory allergy and asthma induced by pollen and mold allergens. Allergy, 2020; 75, 2219−28. doi: 10.1111/all.14476 [108] Qiu H, Tian LW, Ho KF, et al. Who is more vulnerable to death from extremely cold temperatures? A case-only approach in Hong Kong with a temperate climate. Int J Biometeorol, 2016; 60, 711−7. doi: 10.1007/s00484-015-1065-z [109] Hu YB, Xu ZW, Jiang F, et al. Relative impact of meteorological factors and air pollutants on childhood allergic diseases in Shanghai, China. Sci Total Environ, 2020; 706, 135975. doi: 10.1016/j.scitotenv.2019.135975 [110] Bragg F, Holmes MV, Iona A, et al. Association between diabetes and cause-specific mortality in rural and urban areas of China. JAMA, 2017; 317, 280−9. doi: 10.1001/jama.2016.19720 [111] Gao DH, Friedman S, Hosler AS, et al. Ambient heat and diabetes hospitalizations: does the timing of heat exposure matter? Sci Total Environ, 2024; 912, 169011. [112] Fang W, Liu LF, Yin B, et al. Heat exposure intervention, anxiety level, and multi-omic profiles: a randomized crossover study. Environ Int, 2023; 181, 108247. doi: 10.1016/j.envint.2023.108247 [113] Xu RB, Zhao Q, Coelho MSZS, et al. Association between heat exposure and hospitalization for diabetes in Brazil during 2000–2015: a nationwide case-crossover study. Environ Health Perspect, 2019; 127, 117005. doi: 10.1289/EHP5688 [114] Sasai F, Roncal-Jimenez C, Rogers K, et al. Climate change and nephrology. Nephrol Dial Transplant, 2023; 38, 41−8. doi: 10.1093/ndt/gfab258 [115] Zhang LX, Long JY, Jiang WS, et al. Trends in chronic kidney disease in China. N Engl J Med, 2016; 375, 905−6. doi: 10.1056/NEJMc1602469 [116] Burkart KG, Brauer M, Aravkin AY, et al. Estimating the cause-specific relative risks of non-optimal temperature on daily mortality: a two-part modelling approach applied to the Global Burden of Disease Study. Lancet, 2021; 398, 685−97. doi: 10.1016/S0140-6736(21)01700-1 [117] Wang FL, Wang WZ, Zhang FF, et al. Heat exposure and hospitalizations for chronic kidney disease in China: a nationwide time series study in 261 major Chinese cities. Mil Med Res, 2023; 10, 41. [118] Wang WZ, Wang FL, Yang C, et al. Associations between heat waves and chronic kidney disease in China: the modifying role of land cover. Environ Int, 2024; 186, 108657. doi: 10.1016/j.envint.2024.108657 [119] Han BF, Zheng RS, Zeng HM, et al. Cancer incidence and mortality in China, 2022. J Natl Cancer Center, 2024; 4, 47−53. doi: 10.1016/j.jncc.2024.01.006 [120] Hiatt RA, Beyeler N. Cancer and climate change. Lancet Oncol, 2020; 21, e519−27. doi: 10.1016/S1470-2045(20)30448-4 [121] Domínguez-Morueco N, Ratola N, Sierra J, et al. Combining monitoring and modelling approaches for BaP characterization over a petrochemical area. Sci Total Environ, 2019; 658, 424−38. doi: 10.1016/j.scitotenv.2018.12.202 [122] Wang HW, Zeng HM, Miao H, et al. Climate factors associated with cancer incidence: an ecological study covering 33 cancers from population-based registries in 37 countries. PLoS Climate, 2024; 3, e0000362. doi: 10.1371/journal.pclm.0000362 [123] Modenese A, Korpinen L, Gobba F. Solar radiation exposure and outdoor work: an underestimated occupational risk. Int J Environ Res Public Health, 2018; 15, 2063. doi: 10.3390/ijerph15102063 [124] Clayton S, Brown LA. Climate change and mental health. JAMA, 2024; 331, 1761−2. doi: 10.1001/jama.2024.1839 [125] An YY, Huang JL, Chen YR, et al. Longitudinal cross-lagged relationships between posttraumatic stress disorder and depression in adolescents following the Yancheng tornado in China. Psychol Trauma: Theory, Res, Pract, Policy, 2019; 11, 760−6. doi: 10.1037/tra0000455 [126] Hock RS, Bryce CP, Fischer L, et al. Childhood malnutrition and maltreatment are linked with personality disorder symptoms in adulthood: results from a Barbados lifespan cohort. Psychiatry Res, 2018; 269, 301−8. doi: 10.1016/j.psychres.2018.05.085 [127] Lu FM, Sohail MT. Exploring the effects of natural capital depletion and natural disasters on happiness and human wellbeing: a study in China. Front Psychol, 2022; 13, 870623. doi: 10.3389/fpsyg.2022.870623 [128] Zheng JL, Lin HY, Ling JY, et al The trends of disease burden due to high temperature in Mainland China from 1990 to 2019 and its prediction to 2030. Sci Rep, 2023; 13, 22238. [129] Yang J, Zhou MG, Ren ZP, et al. Projecting heat-related excess mortality under climate change scenarios in China. Nat Commun, 2021; 12, 1039. doi: 10.1038/s41467-021-21305-1 [130] Yin P, He C, Chen RJ, et al. Projection of mortality burden attributable to nonoptimum temperature with high spatial resolution in China. Environ Sci Technol, 2024; 58, 6226−35. doi: 10.1021/acs.est.3c09162 [131] Zhang GW, Sun ZB, Han L, et al. Avoidable heat-related mortality in China during the 21st century. npj Climate Atmos Sci, 2023; 6, 81. doi: 10.1038/s41612-023-00404-4 [132] Tong SL, Bambrick H, Ebi KL. Striving for a climate-resilient future. Lancet Planet Health, 2024; 8, e214−5. doi: 10.1016/S2542-5196(24)00044-5 -

 点击查看大图
计量
- 文章访问数: 441
- HTML全文浏览量: 180
- PDF下载量: 52
- 被引次数: 0

 Quick Links