

 下载:
下载:


-
Chronic bronchitis (CB), characterized by persistent coughing with mucus production for at least three consecutive months in two successive years and caused by multiple factors[1], is a progressive condition. Acute exacerbation of chronic bronchitis (AECB), marked by recurrent episodes of bronchial inflammation, have been linked to various adverse health outcomes[2]. Environmental PM2.5 results from complex interactions among multiple emissions and chemical compositions. It comprises a complex mixture of chemical components, including black carbon (BC), nitrate (NO3-), sulfate (SO42-), ammonium (NH4+), and organic matter (OM)[3]. While several epidemiological studies have explored the link between long-term exposure to ambient air pollutants and CB[4,5], no studies have focused on the relationship between PM2.5, its constituents, and acute exacerbation of CB. In addition, the specific populations and seasons most susceptible to the effects of PM2.5 and its constituents remain unclear. Therefore, this study aimed to (1) evaluate the association of short-term exposure to PM2.5 and its constituents and the risk of AECB, and (2) identify seasons and populations that are more susceptible to the adverse effects of PM2.5 and its constituents.
Shanghai, a densely populated first-tier city in the Yangtze River Delta region, belongs to the north subtropical monsoon climate zone. Considering its demographics, location, and urban development, it is an ideal setting to study the interactions between PM2.5, its constituents, and AECB. A total of 269,101 case records were obtained from the Jinshan District Community Health Service Center and Shanghai Hospital System. Patients diagnosed with the International Classification of Diseases, 10th edition [ICD-10]: J44.1, from October 2018 to December 2022, with a total of 2,202 AECB cases, were included in the study. Among these, 1,815 cases were hospitalized before the COVID-19 pandemic, while 387 patients were hospitalized during the pandemic. Basic demographic details of these patients, including sex, age, date of hospitalization, and specified disease codes were extracted. The geographic distribution of AECB cases is shown in Supplementary Figure S1.
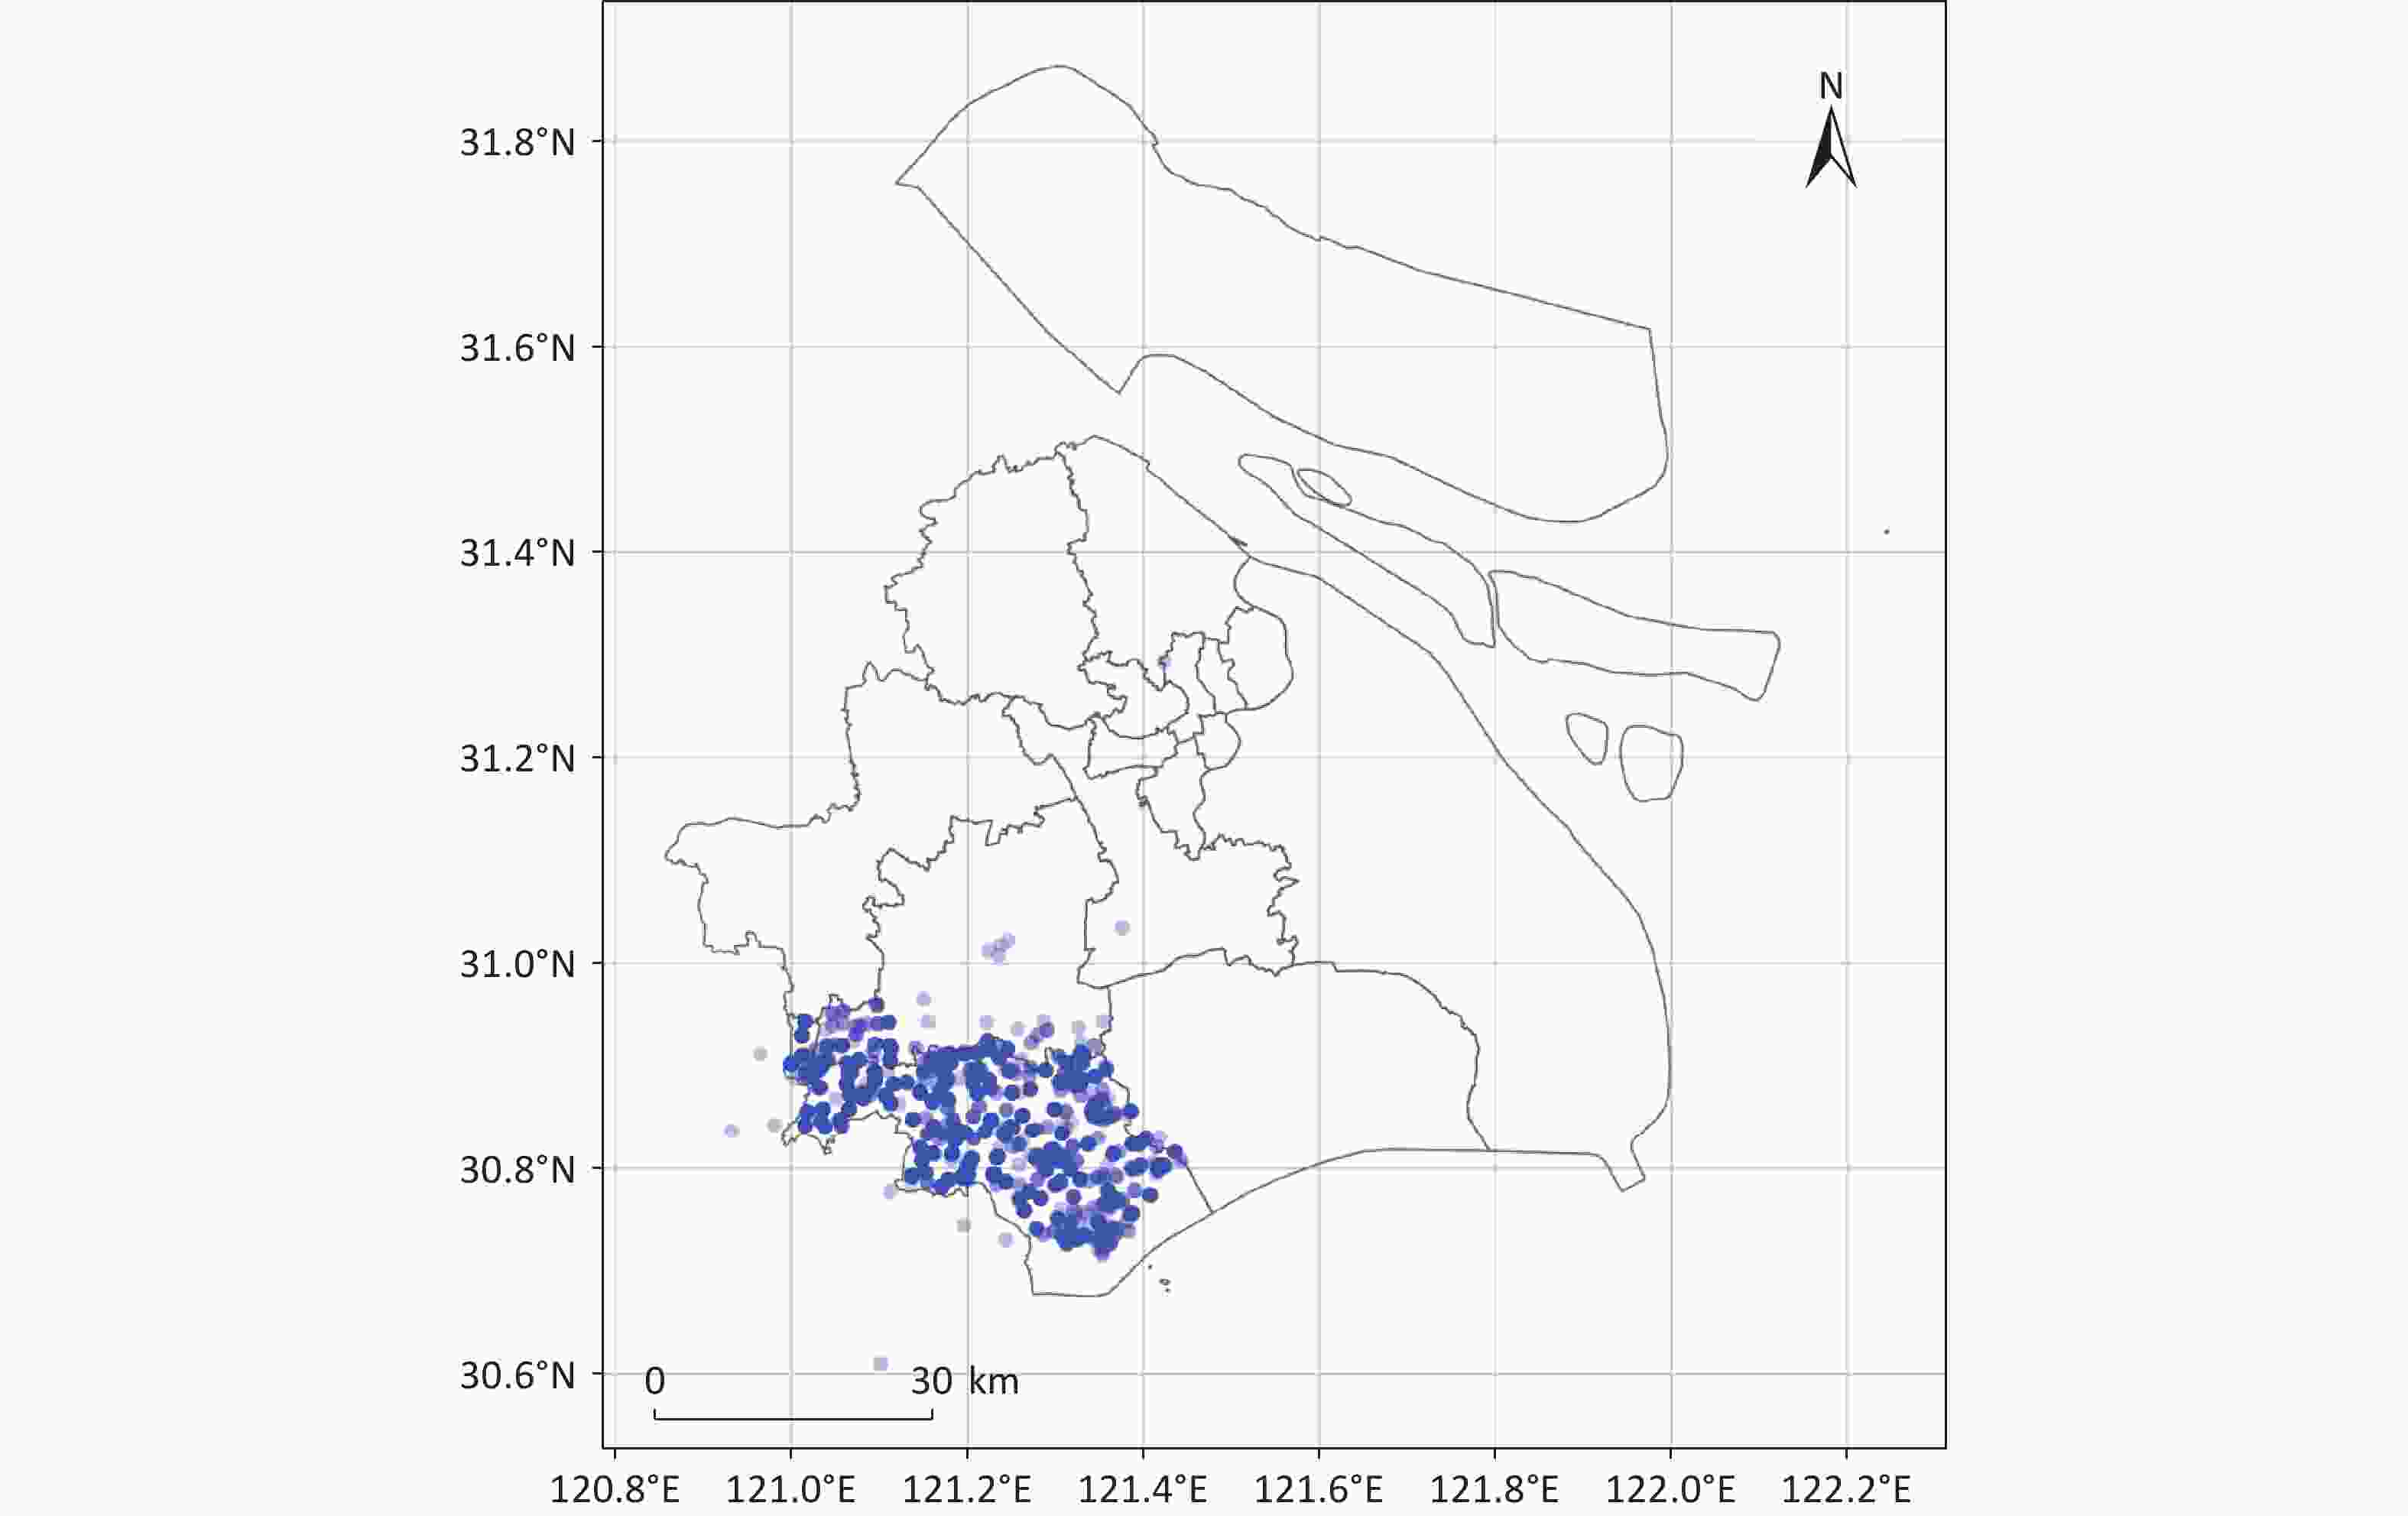
Figure S1. Map distribution of acute exacerbations of chronic bronchitis. Map approval number: SH(2020)037.
PM2.5 and its constituents were obtained as follows: case records provided detailed residential addresses, which were aggregated at the natural village and community level. These addresses were geocoded using Baidu Maps API to generate precise latitudinal and longitudinal coordinates. During the study period, PM2.5 and its constituent data with a spatial resolution of 10 km were obtained from the Tracking Air Pollution in China (TAP) dataset (https://tapdata.org.cn/)[6]. TAP uses multiscale air quality (CMAQ) simulations of operating communities. To correct the simulation deviation of the CMAQ model, the dust emission simulation module was first improved, and then a model was built based on the observed PM2.5, and the extreme gradient boost (XGBoost) algorithm was used to adjust the relative contribution of the simulated PM2.5, to obtain a more accurate conversion factor for PM2.5 constituents. This allowed the acquisition of concentration data of PM2.5 constituents[7]. The PM2.5 constituent data released by TAP included BC, NO3-, SO42-, NH4+ and OM. The resulting exposure data can be viewed as individual horizontal exposure data, based on precise geographic matching.
In this study, we employed a time-stratified case-crossover design to investigate the acute effects of exposure to PM2.5 and its constituents, on AECB. This methodology incorporated temporal strata, such as years and months, into its framework. Each AECB case served as its own control by comparing exposures during the reference periods preceding and following the event day (case day). Specifically, for each individual AECB episode, the environmental exposure to PM2.5 and its constituents on the actual event date was contrasted with that of three or four corresponding matched days (control days) within the same geographic location, identical year, month, and day of the week (DOW). This design effectively mitigated for seasonal fluctuations, long-term trends, DOW effects, spatial variations, and personal-level confounding factors that remain constant over time, including age, sex, behavior, and metabolic factors[8].
The Spearman correlation coefficient (rs) was used to determine the correlation between PM2.5 and its constituents. Conditional logistic regression (CLR) model was utilized to estimate this association between short-term exposure to PM2.5, its constituents, and AECB. Various lag structures were assessed, including single-day lags (0-day to 7-day) and moving-average lags (1-day to 7-day). Lag-0 represented pollutant concentrations on the same day, while lag-1 represented the moving average concentration from the present day to the previous day, with subsequent lag periods following suite. The lag period producing the maximum impact estimate was selected for further analysis. The resulting effect estimates provided the odds ratios (ORs) and their corresponding 95% confidence intervals (CIs) for each increase of 10 µg/m³ in PM2.5 and its constituents. A restricted cubic spline (RCS) model was used to fit the relationship of PM2.5 and its constituents, with the AECB concentration-response[9]. Subgroup analyses stratified the data by sex (men and women) and age (< 80 years vs. ≥80 years) to identify potentially susceptible populations. To examine seasonal variations, the study period was divided into two seasonal categories: warm (April–September) and cold (October–March). To ensure the robustness of the findings, multiple sensitivity analyses were conducted by altering specific parameter configurations within the modeling framework. Based on the original model, gaseous pollutants such as O3 were added to test the two-pollutant model. In addition, we used other high-resolution PM2.5-datasets to fit the high-resolution component data to test the robustness of our results. At the same time, the exposure concentration of PM2.5, was obtained using a previous formula[10]. Given that the study period included the COVID-19 pandemic, the population after December 2019 was excluded from the analysis to test the stability and reliability of the results.
All statistical analyses were conducted using R software (version 4.3.2, R Foundation for Statistical Computing, Vienna, Austria). The “ggcorrplot” package was employed to conduct Spearman’s correlation analysis, while the “survival” package was used to implement conditional logistic regression modeling. Additionally, the “splines” package was utilized for NCS smoothing. In this study, a bilateral test P-value < 0.05 was considered statistically significant.
As shown in Table 1, the study included 2,202 cases of AECB from the Jinshan District in Shanghai, China, between October 2018 and December 2022. Included cases were aged from 42 to 102 years [mean ± SD (standard deviation): 78.47 ± 8.53 years]. Among these cases, 1,348 were men (constituting 61.22% of the total), and more than half (62.85%) of AECB cases occurred in colder months.
Table 1. Summary statistics and characteristics of AECB cases
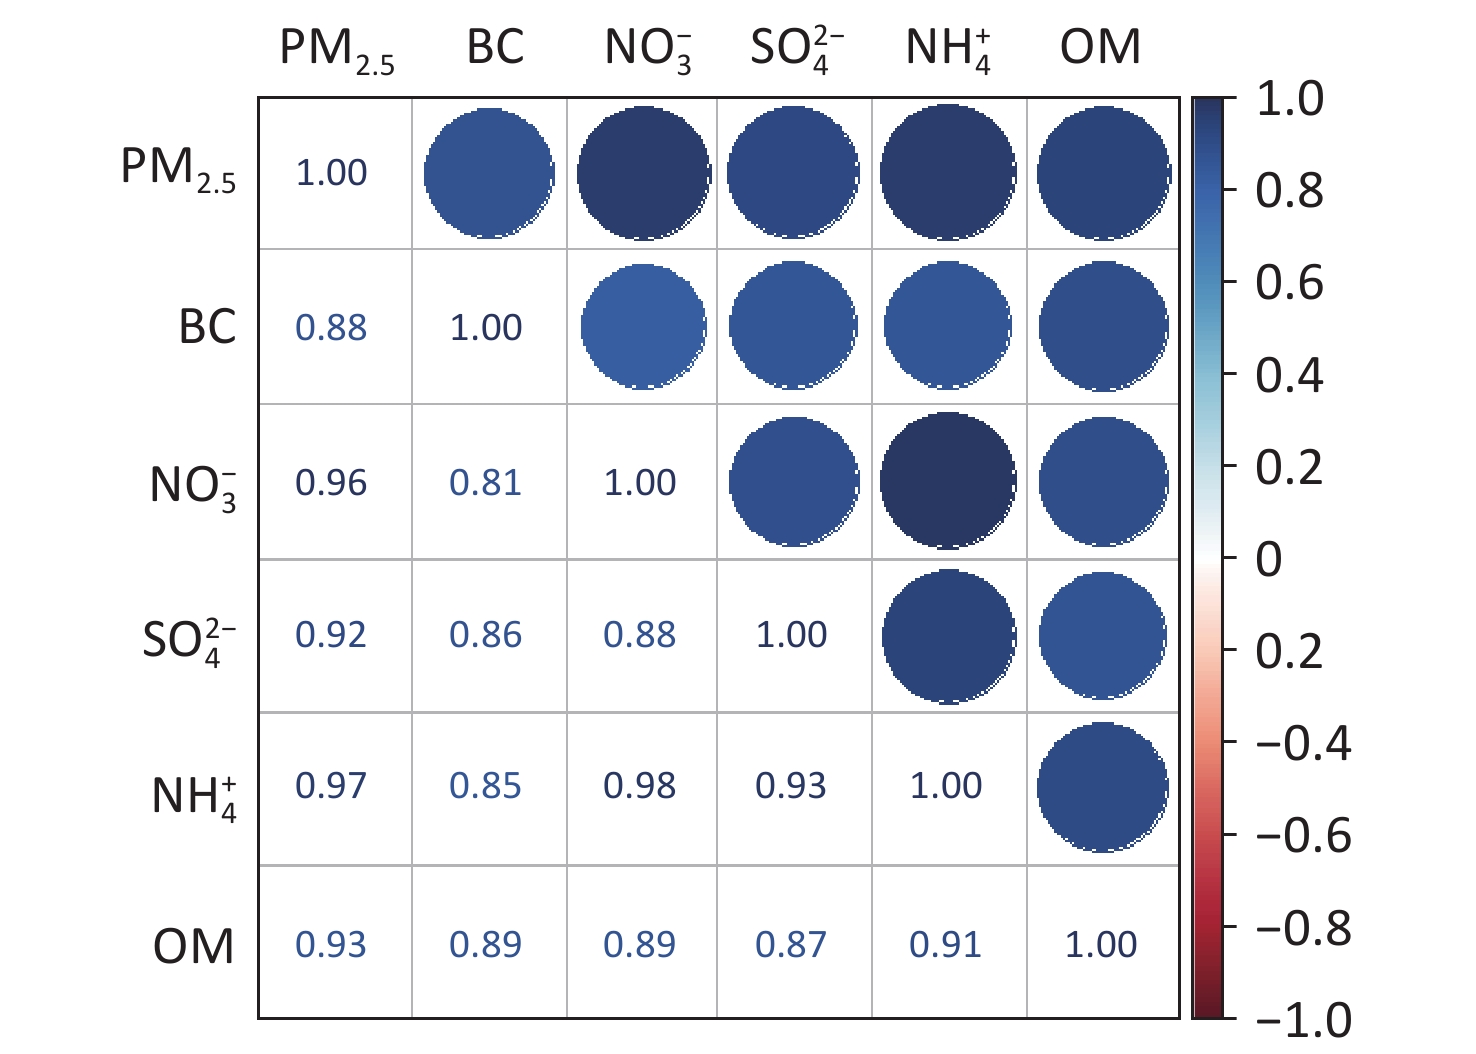
Characteristic Number Percentage (%) AECB (ICD-10 code: J44.1) 2,202 100 Case days 2,202 − Control days 7,381 − Sex Men 1,348 61.22 Women 854 38.78 Age of onset (years, mean ± SD) 78.47 ± 8.53 − < 80 years 1,057 48.00 ≥ 80 years 1,145 52.00 Season at happen Cold (January to March, October to December) 1,384 62.85 Warm (April to September) 818 37.15 Note. Number is frequency, or mean ± SD, or n (%). ICD-10, International Classification of Diseases–Tenth Revision; AECB, acute exacerbation of chronic bronchitis. Supplementary Table S1 summarizes the distribution of ambient PM2.5 and its constituents on case and control days. The mean daily concentrations of PM2.5 were recorded as 34.52 µg/m³ on case days, and 34.53 µg/m³ on control days. Among the five constituents analyzed, their collective contribution to the total PM2.5, was 87.02%, with individual constituent contributions ranging from 4.08% to 23.70%. The average daily concentrations of PM2.5 constituents, including BC, NO3-, SO4²⁻, NH4+, and OM, were found to be 1.41, 8.18, 6.66, 5.33, and 7.46 µg/m³, respectively (Supplementary Table S2). Supplementary Figure S2 presents a heat map of Spearman’s correlation showing the relationship between PM2.5 and its constituents. The figure shows a moderate-to-high correlation between PM2.5 and its five constituents (rs > 0.6).
Table S1. Summary distributions of total PM2.5, PM2.5 constituents on case days and control days, 2018–2022
Variables Min Q1 (25%) Median Q3 (75%) Max Mean SD IQR % of PM2.5 mass On case days (n = 2,202) PM2.5 (µg/m³) 1.00 18.00 27.00 47.00 132.00 34.52 22.85 29.00 100 BC (µg/m³) 0.03 0.79 1.21 1.84 5.26 1.42 0.84 1.05 4.11 NO3- (µg/m³) 0.11 3.09 5.73 11.88 40.59 8.20 6.94 8.79 23.75 SO42- (µg/m³) 0.18 3.76 5.55 8.46 31.05 6.65 4.13 4.70 19.26 NH4+ (µg/m³) 0.09 2.35 4.04 7.66 21.36 5.34 4.03 5.31 15.47 OM (µg/m³) 0.20 3.72 5.83 9.74 32.59 7.47 5.32 6.02 21.64 On control days (n = 7,381) PM2.5 (µg/m³) 1.00 18.00 27.00 47.00 135.00 34.53 22.73 29.00 100 BC (µg/m³) 0.03 0.80 1.23 1.84 4.95 1.41 0.80 1.04 4.08 NO3- (µg/m³) 0.10 3.03 5.80 12.13 42.28 8.17 6.75 9.10 23.66 SO42- (µg/m³) 0.17 3.73 5.60 8.70 31.20 6.66 4.12 4.97 19.29 NH4+ (µg/m³) 0.08 2.32 4.09 7.73 22.12 5.33 3.95 5.41 15.44 OM (µg/m³) 0.17 3.75 5.88 9.75 34.21 7.46 5.22 6.00 21.60 Note. PM2.5, fine particulate matter; BC, black carbon; NO3- , nitrate; SO42- , sulfate; NH4+ , ammonium; OM, organic matter. Min, minimum; Max, maximum; SD, standard deviation; IQR, interquartile range. Table S2. Summary distribution of average levels of PM2.5 its constituents for the study period 2018–2020
Variable Min Q1 (25%) Median Q3 (75%) Max Mean SD IQR PM2.5 (µg/m³) 1.00 18.00 27.00 47.00 135.00 34.52 22.48 29.00 BC (µg/m³) 0.03 0.8 1.22 1.84 5.26 1.41 0.81 1.04 NO3- (µg/m³) 0.10 3.04 5.79 12.09 42.28 8.18 6.79 9.05 SO42- (µg/m³) 0.17 3.74 5.59 8.61 31.20 6.66 4.12 4.87 NH4- (µg/m³) 0.08 2.33 4.07 7.72 22.12 5.33 3.97 5.38 OM (µg/m³) 0.17 3.74 5.86 9.75 34.21 7.46 5.24 6.01 Note. PM2.5, fine particulate matter; BC, black carbon; NO3- , nitrate; SO42- , sulfate; NH4+ , ammonium; OM, organic matter. Min, minimum; Max, maximum; SD, standard deviation; IQR, interquartile range. 
Figure S2. The pairwise coefficients of Spearman correlation between PM2.5 and its constituents.
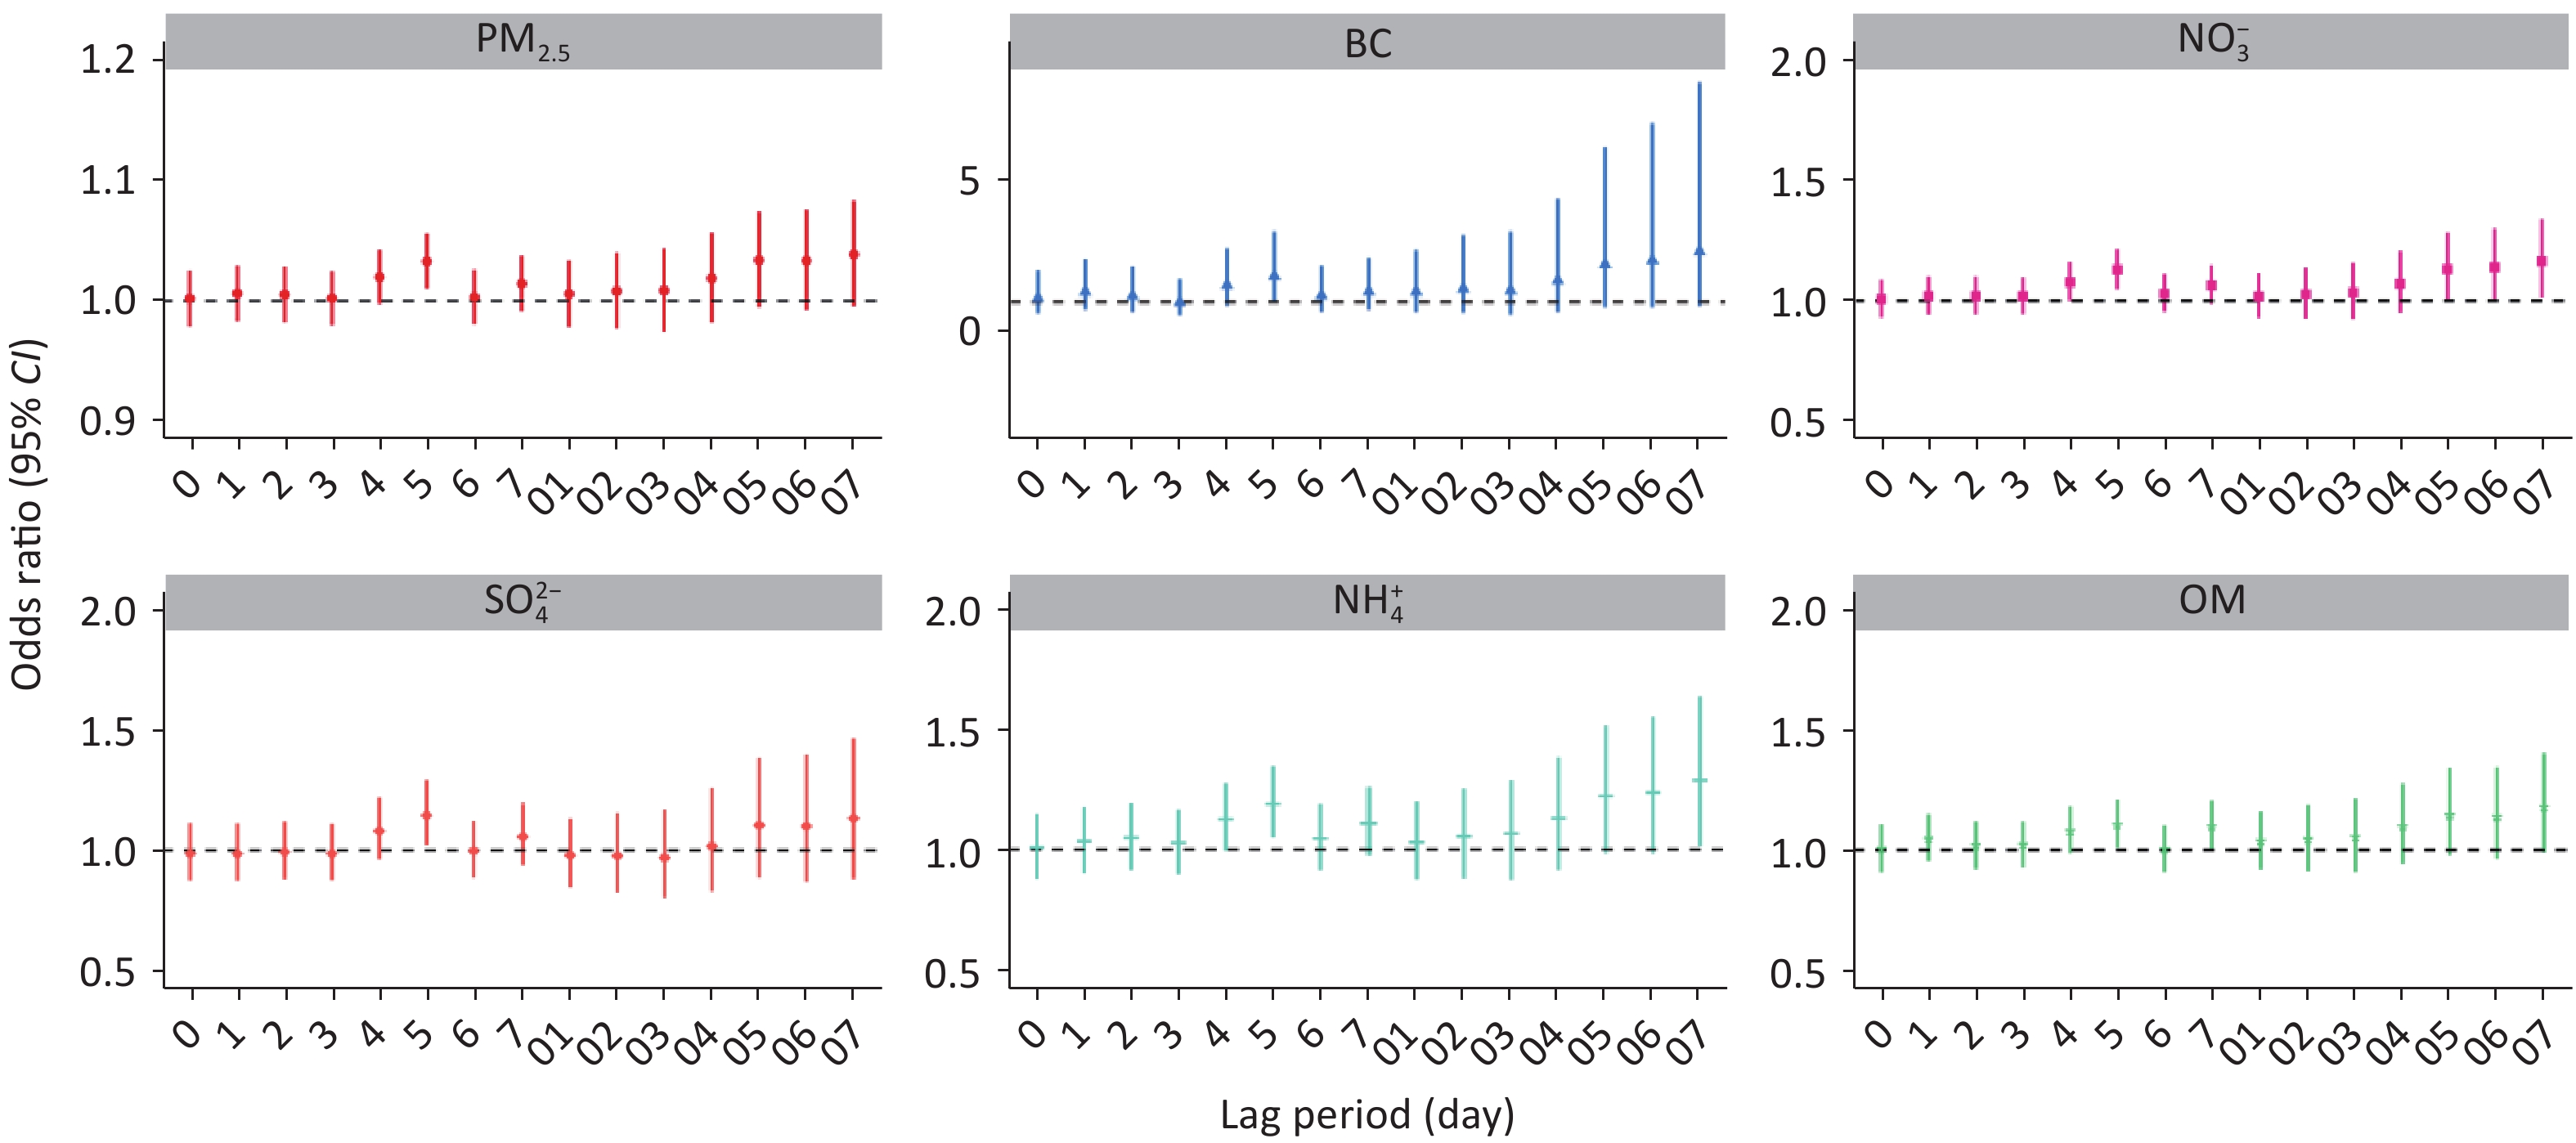
The OR values for AECB incidence at different lag days are estimated in Figure 1, and they correspond to each increment of 10 µg/m3; in PM2.5 and its constituents’ exposure. PM2.5 constituents were found to exert detrimental effects on AECB. The relative risks associated with PM2.5 and its constituents, showed a roughly similar lagged structure, with risks peaking on the 5th day of lagged exposure. This study selected the lag 5th day as the main lag for further analyses The CLR model estimates revealed that a single-day lagged exposure on the 5th day to PM2.5 and its constituents (BC, NO3-, SO42-, NH4+, OM) were linked with an increased incidence of AECB, as indicated by elevated odds ratios (ORs) values of 1.033 (95% CI: 1.010–1.055), 1.862 (1.038–3.342), 1.129 (1.049–1.216), 1.145 (1.021–1.284), 1.190 (1.051–1.346) and 1.105 (1.009–1.209), respectively, for every 10 µg/m3; increase in exposure. The detailed risk estimates for different lag periods can be found in the supplementary material, specifical Supplementary Table S3. Supplementary Table S4 shows that after excluding the COVID-19 population, the OR value of PM2.5 and its components on the risk of AECB reached a maximum on the 7th day lag, and the OR and 95% CI were 1.035 (1.009, 1.061), 2.227 (1.116, 4.444), 1.150 (1.054, 1.255), 1.120 (0.981, 1.279), 1.236 (1.071, 1.427), and 1.183 (1.066, 1.312).
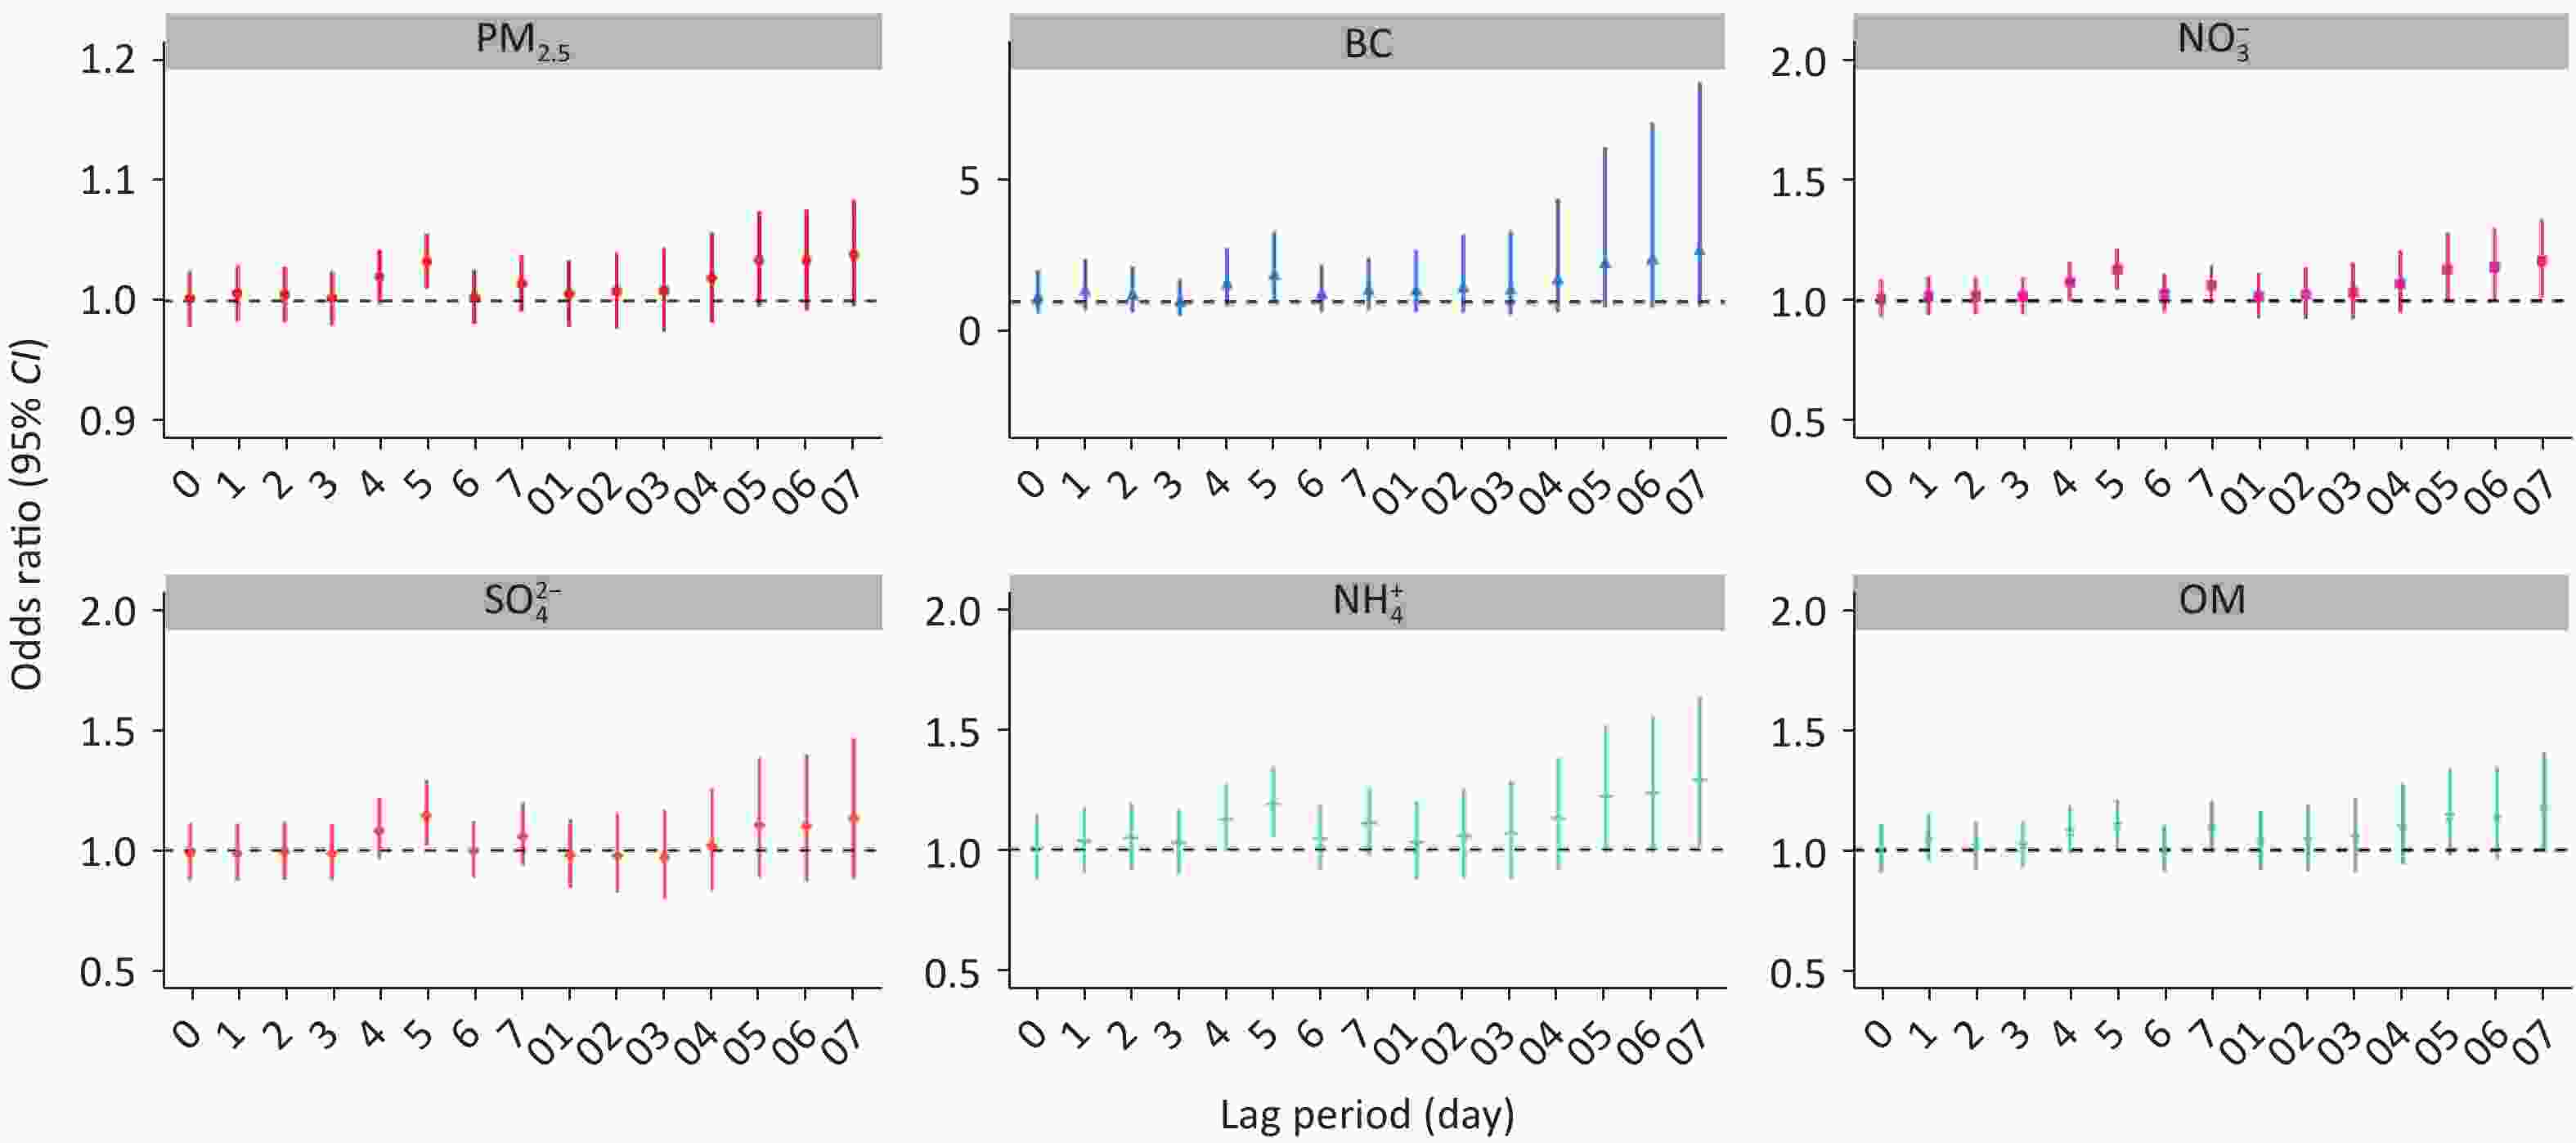
Figure 1. Odds ratios (with 95% CIs) for the increased incidence of acute exacerbation of chronic bronchitis associated with a 10 µg/m³ increment increase in PM2.5 and its constituents at various lag days.
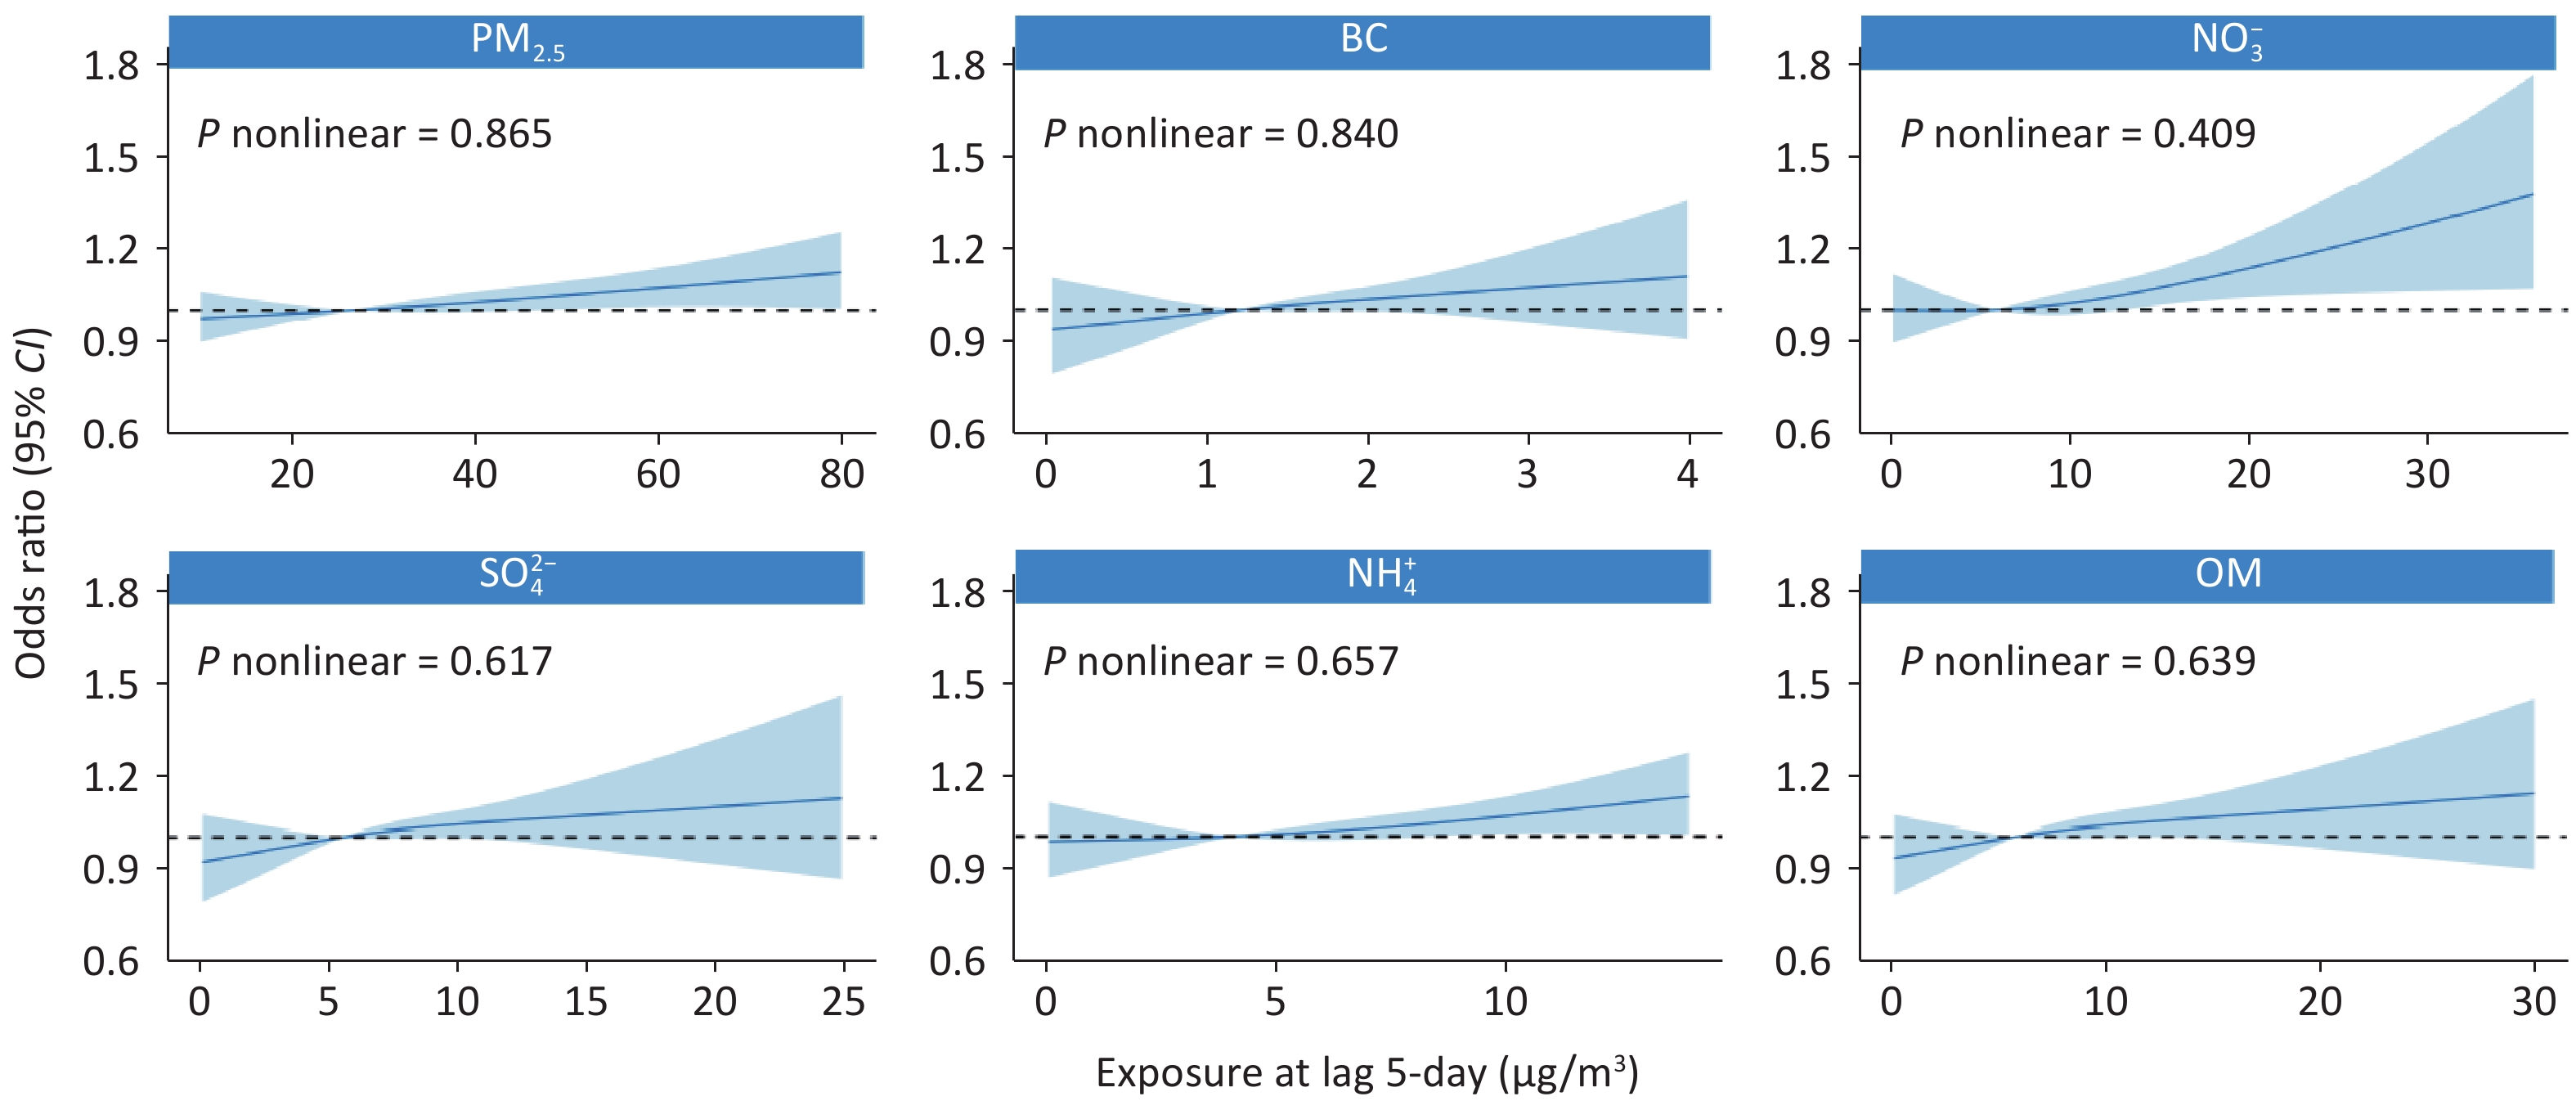
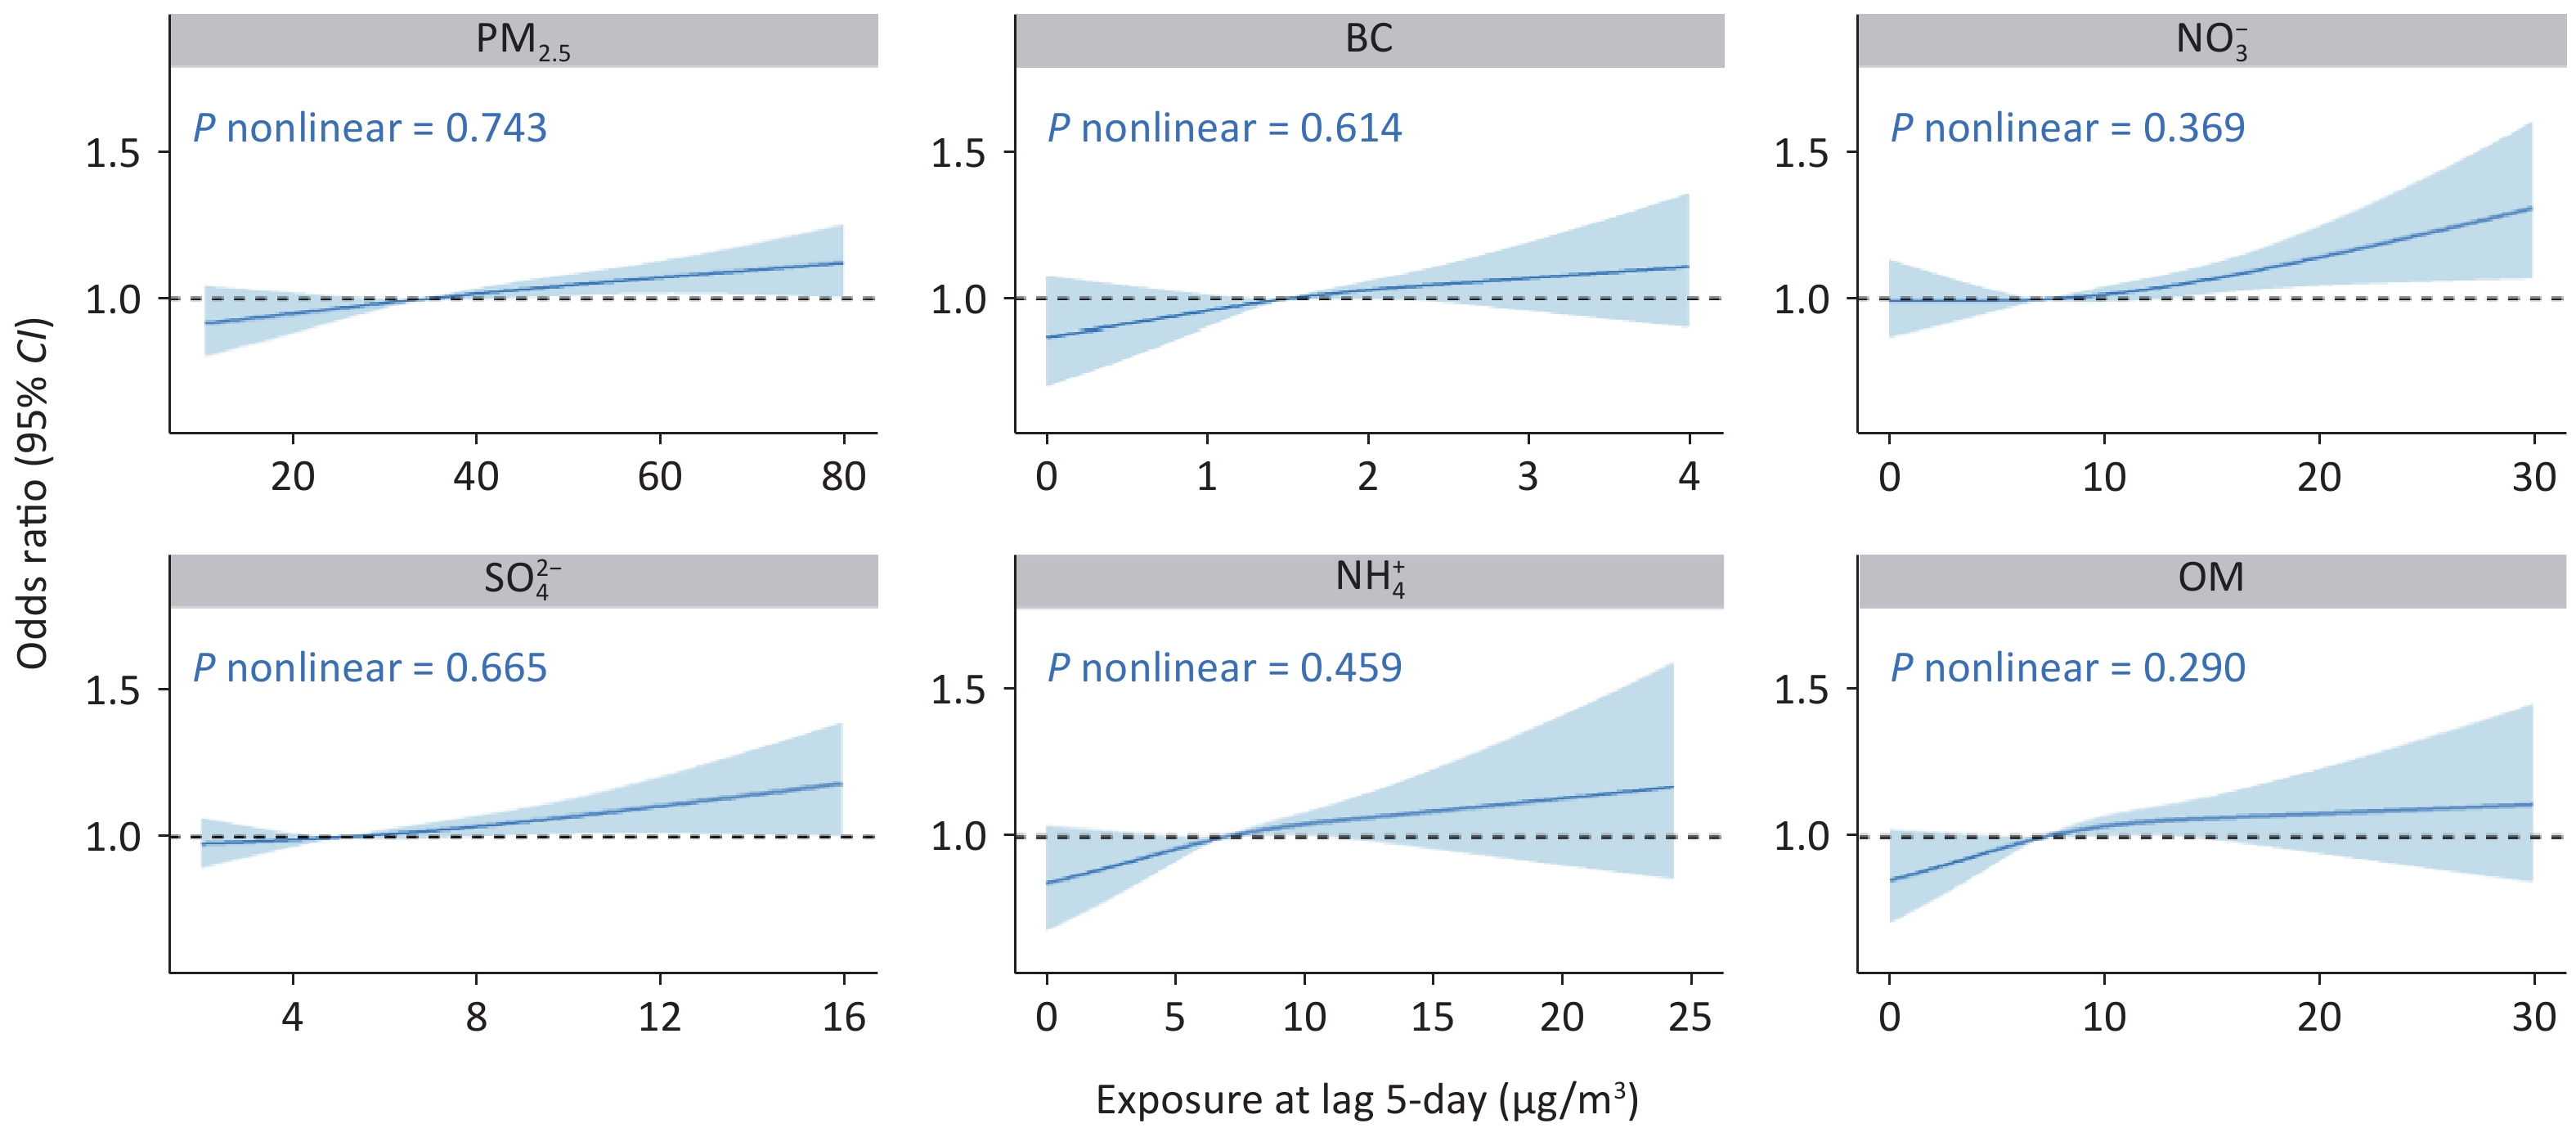
The C-R curves indicating the connection between the fifth day of exposure to PM2.5, its constituents, and the incidence of AECB are shown in Figure 2. There was an increasing trend in the exposure risks linked to PM2.5, NO3-, and NH4+. However, no significant exposure risks were observed for BC, SO42-, or OM. All P-values > 0.05, which corroborated this conclusion, showed that there was no significant deviation from linearity in the correlations between these constituents and the prevalence of AECB when examined using nonlinear likelihood ratio tests.
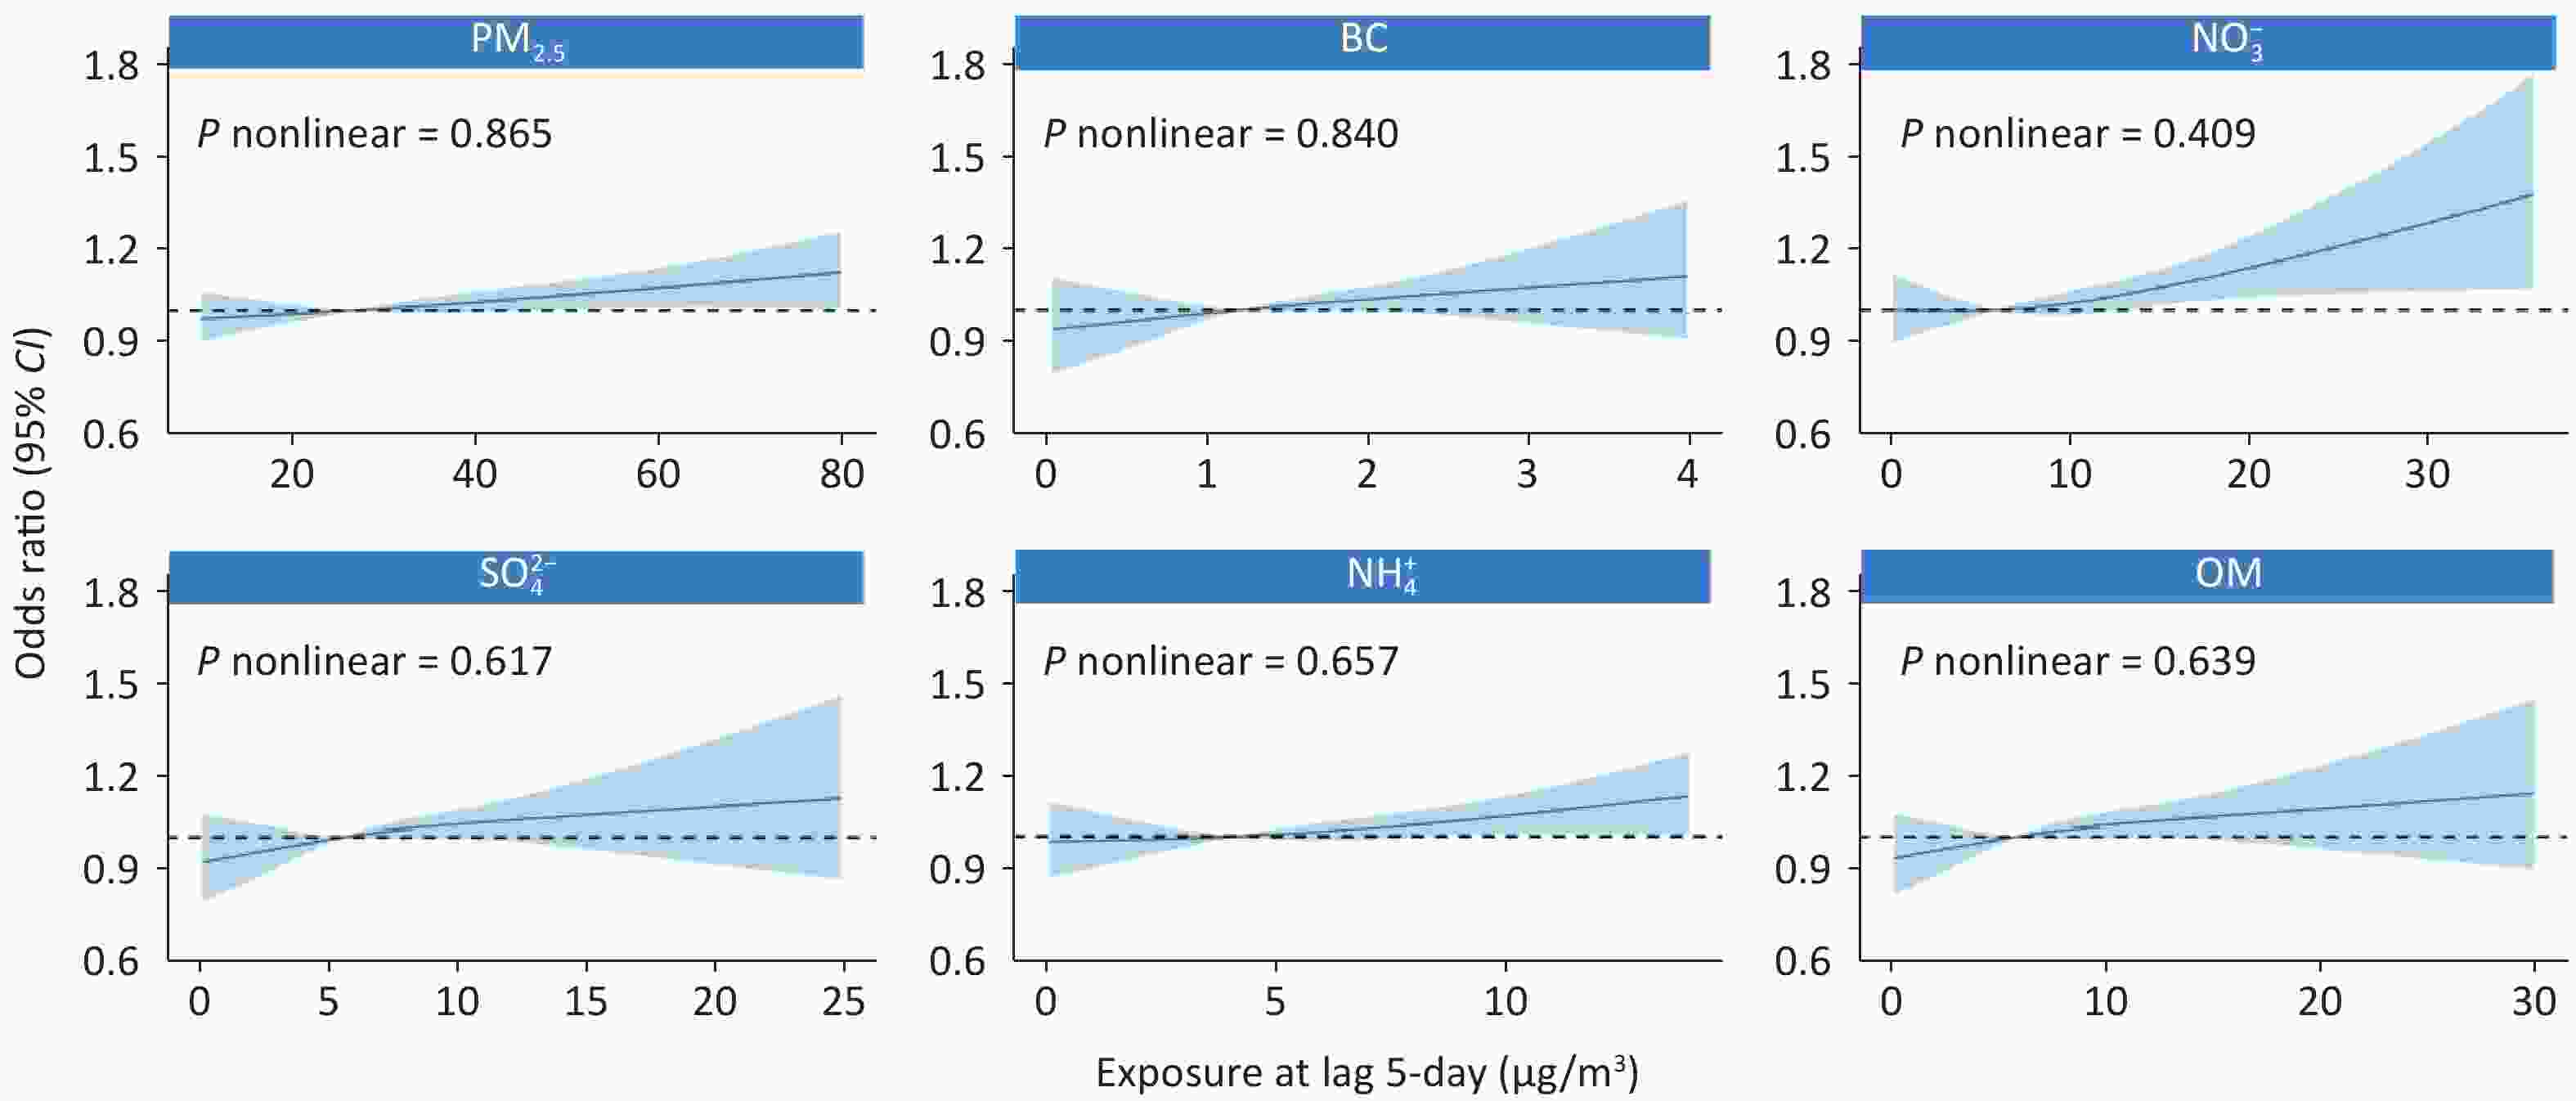
Figure 2. Concentration-response curves PM2.5 and its constituents associated with acute exacerbation of chronic bronchitis. P nonlinear: Likelihood ratio tests for non-linearity with the null hypothesis that there was no difference between the linear assumption and NSC smoothing function. NSC: natural spline cubic.
Based on single-day lagged exposure on the fifth day, Supplementary Table S5 shows the stratified analysis estimates of the connection between PM2.5, its constituents, and AECB. Men were found to have slightly higher illness occurrence risks in the sex-stratified analysis, but there were no statistically significant differences in susceptibility to sex modification (with interaction effects of P.int > 0.05). With respect to age, individuals aged ≥ 80 years demonstrated a higher risk of BC exposure, whereas those < 80 years of age showed a heightened risk of NH4+ exposure. Further contrast across different seasons revealed that PM2.5 and its constituents exerted a greater influence on AECB during colder periods. No significant differences were observed between subgroups.
Table S5. In subgroup analyses, the odds ratio (95% CI) for AECB was associated with each 10µg/m³ increase in exposure to PM2.5 and its constituents
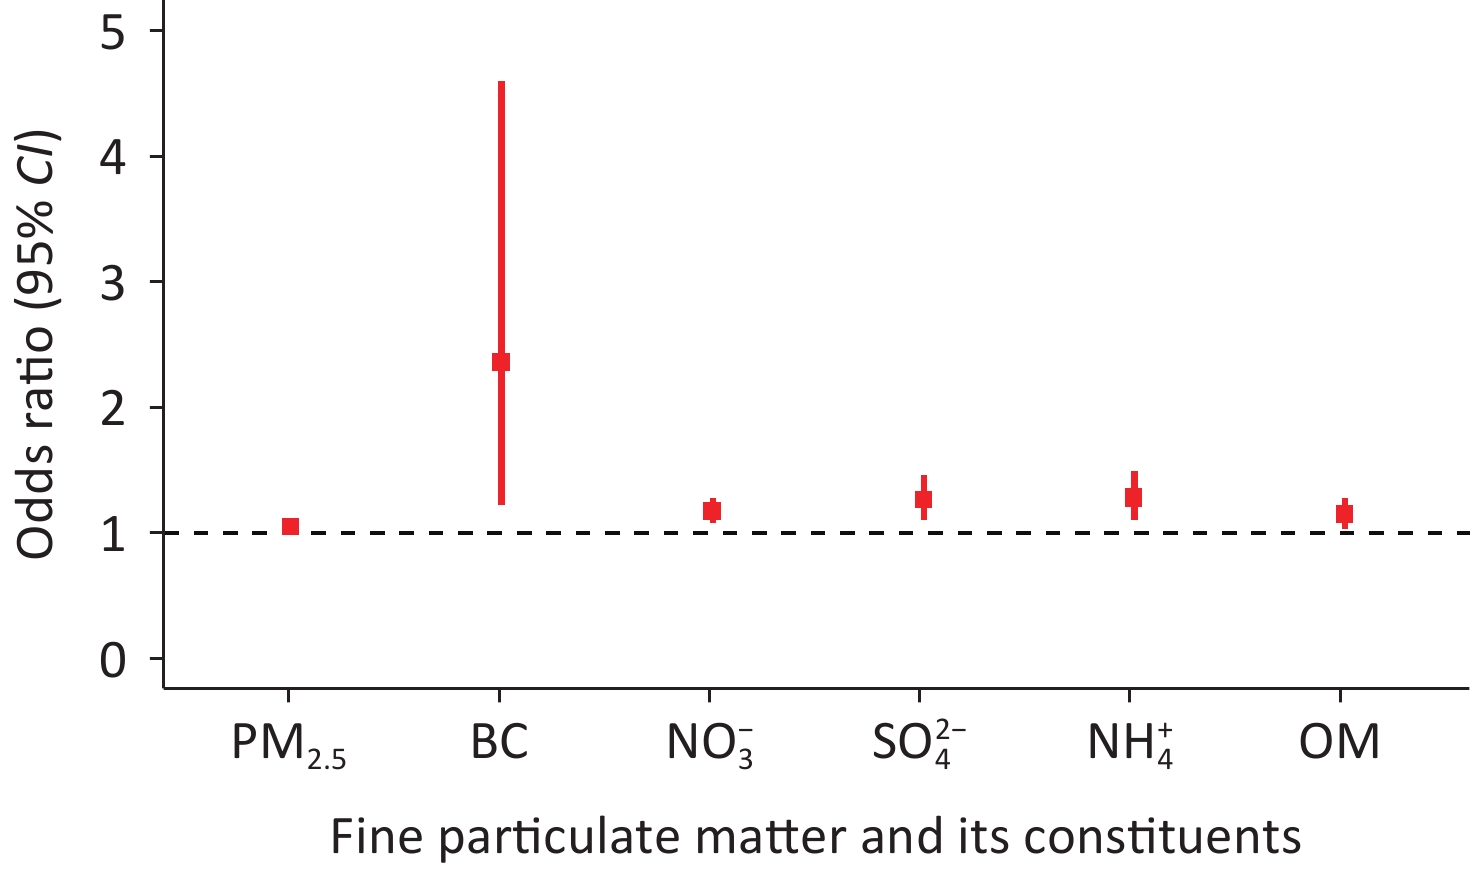
Subgroup PM2.5 BC NO3- OR (95% CI) P-values P.int OR (95% CI) P-values P.int OR (95% CI) P-values P.int Sex Men 1.046 (1.017, 1.076) 0.002 0.165 2.352 (1.104, 5.009) 0.027 0.341 1.168 (1.062, 1.285) 0.001 0.271 Women 1.013 (0.979, 1.049) 0.455 1.317 (0.522, 3.32) 0.559 1.074 (0.956, 1.207) 0.231 Age < 80 years 1.034 (1.002, 1.067) 0.035 0.888 1.549 (0.669, 3.586) 0.307 0.548 1.132 (1.019, 1.258) 0.021 0.951 80+ years 1.031 (1.000, 1.063) 0.048 2.218 (0.981, 5.013) 0.056 1.127 (1.017, 1.249) 0.023 Season at happen Cold 1.034 (1.009, 1.059) 0.008 0.882 2.391 (1.223, 4.674) 0.011 0.138 1.125 (1.037, 1.221) 0.005 0.835 Warm 1.029 (0.980, 1.081) 0.252 0.840 (0.251, 2.813) 0.778 1.148 (0.969, 1.36) 0.110 Subgroup SO42- NH4+ OM OR (95% CI) P-values P.int OR (95% CI) P-values P.int OR (95% CI) P-values P.int Sex Men 1.235 (1.065, 1.432) 0.005 0.119 1.265 (1.077, 1.485) 0.004 0.24 1.145 (1.018, 1.287) 0.023 0.394 Women 1.025 (0.855, 1.229) 0.789 1.087 (0.894, 1.321) 0.404 1.048 (0.909, 1.209) 0.515 Age < 80 years 1.172 (0.996, 1.38) 0.056 0.391 1.207 (1.011, 1.441) 0.037 0.818 1.116 (0.982, 1.269) 0.094 0.826 80+ years 1.119 (0.953, 1.315) 0.170 1.173 (0.986, 1.395) 0.072 1.094 (0.963, 1.242) 0.166 Season Cold 1.171 (1.020, 1.344) 0.025 0.569 1.191 (1.035, 1.37) 0.015 0.972 1.111 (1.005, 1.228) 0.039 0.793 Warm 1.089 (0.884, 1.341) 0.423 1.184 (0.909, 1.544) 0.210 1.077 (0.876, 1.325) 0.480 Note. *P < 0.05; P.int: P-value of regression coefficient hypothesis test. P-values of regression coefficient hypothesis test. A sensitivity analysis verified the robustness of the main findings. Results using the dual-pollutant model showed little change in OR estimates compared to the main model refer to Supplementary Table S6. Similar results were obtained with the high-resolution exposure assessment datasets, as detailed in Supplementary Figures S3 and S4.
Table S6. Sensitivity analysis of odds ratios (95% CI) for each 10 µg/m³-associated increase in exposure to air pollutants in AECB
Exposure Model adjustments OR (95% CI) P-values a P.int PM2.5 Main model 1.033 (1.01, 1.055) 0.004 − and O3 1.029 (1.005, 1.052) 0.016 0.656 BC Main model 1.862 (1.038, 3.342) 0.037 − and O3 1.642 (0.890, 3.027) 0.112 0.209 NO3- Main model 1.129 (1.049, 1.216) 0.001 − and O3 1.116 (1.033, 1.206) 0.005 0.754 SO42- Main model 1.145 (1.021, 1.284) 0.02 − and O3 1.122 (0.997, 1.262) 0.056 0.769 NH4+ Main model 1.190 (1.051, 1.346) 0.006 − and O3 1.162 (1.020, 1.324) 0.024 0.657 OM Main model 1.105 (1.009, 1.209) 0.031 − and O3 1.082 (0.984, 1.191) 0.105 0.595 Note. df: degrees of freedom; P.int: P-value of regression coefficient hypothesis test. P-values of regression coefficient hypothesis test. 
Figure S3. The association between PM2.5 and its constituents and acute exacerbations of chronic bronchitis in the CHAP data set.
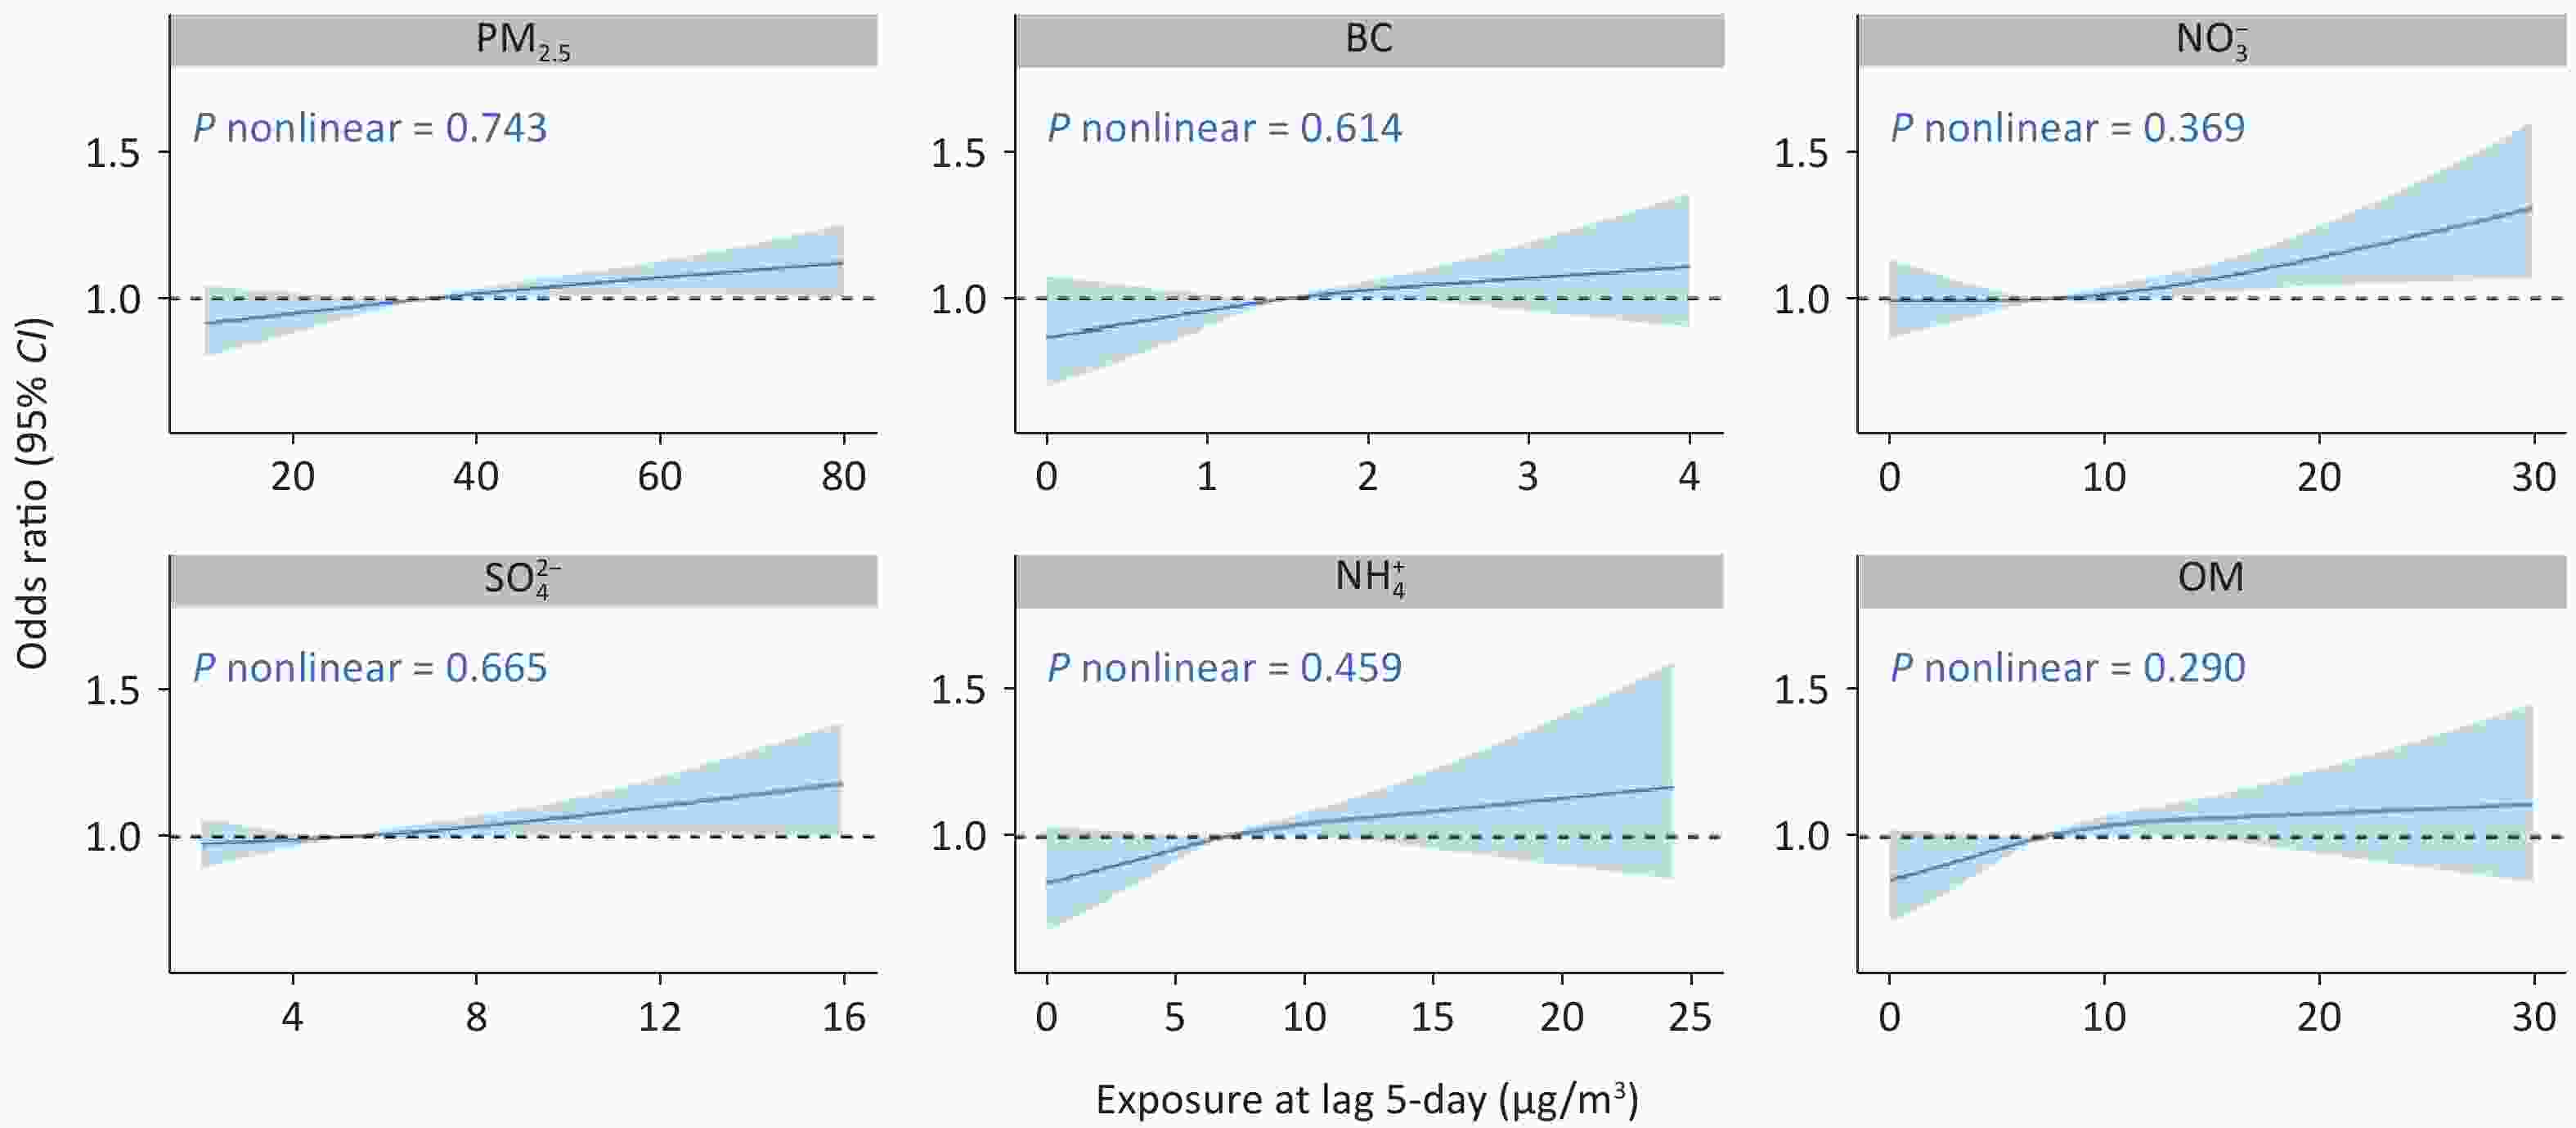
Figure S4. Concentration-response curves PM2.5 and its constituents associated with acute exacerbations of chronic bronchitis in the CHAP data set.
This study has some limitations. First, the data were sourced from the Jinshan District Health Service Medical Center in Shanghai, China, which implies that the findings may not be universally applicable to other regions with distinct meteorological and geographical attributes. Second, as smoking status and indoor air pollutant data were not accessible, we could not adjust for these potential confounders. Instead, we relied on a time-stratified case crossover design, assuming that these conditions remained relatively constant throughout the study period. Third, the high inter-correlation among individual fine particulate matter constituents (rs: 0.62–0.98) constrained our capacity to construct multi-pollutant models that accurately determined the individual contribution of each constituent to the incidence of acute episodes of chronic bronchitis. In addition, because PM2.5 and its constituents with a spatial resolution of 10 km, may lack the accuracy required for research at the level of natural villages and communities, higher-resolution data of PM2.5 and its components are needed for further research. Finally, owing to the limited sample size, there is a possibility of error, and the sampled data may not fully represent the overall population characteristics.
In summary, short-term exposure to PM2.5 and its constituents was associated with an increased AECB incidence. Men exhibited greater susceptibility to PM2.5 and its constituents. Research has demonstrated that during colder seasons, patients are more susceptible to the detrimental effects of fine particulate matter constituents. This study presents novel evidence on the immediate adverse health impacts resulting from exposure to PM2.5 and its constituents in relation to AECB occurrences. These findings underscore the importance of implementing rigorous emission reduction strategies and sustainable environmental management practices in regions with elevated air pollution levels, particularly PM2.5.
-
Table S3. The estimated odds ratios (95% CI) for PM2.5 and its constituents for each 10 (µg/m³) increase in AECB risk on different lag days
Exposure Lag structures OR (95% CI) P-values PM2.5 (10 µg/m³) Lag 0-day 1.002 (0.979, 1.025) 0.869 Lag 1-day 1.006 (0.984, 1.029) 0.598 Lag 2-day 1.005 (0.983, 1.028) 0.656 Lag 3-day 1.002 (0.980, 1.025) 0.849 Lag 4-day 1.020 (0.998, 1.042) 0.081 Lag 5-day 1.033 (1.010, 1.055) 0.004 Lag 6-day 1.003 (0.981, 1.026) 0.785 Lag 7-day 1.014 (0.992, 1.037) 0.217 Lag 01-day 1.006 (0.979, 1.033) 0.679 Lag 02-day 1.008 (0.977, 1.040) 0.606 Lag 03-day 1.009 (0.975, 1.043) 0.619 Lag 04-day 1.019 (0.982, 1.056) 0.316 Lag 05-day 1.034 (0.995, 1.074) 0.088 Lag 06-day 1.033 (0.993, 1.075) 0.108 Lag 07-day 1.038 (0.996, 1.083) 0.078 BC (10 µg/m³) Lag 0-day 1.129 (0.623, 2.046) 0.690 Lag 1-day 1.343 (0.743, 2.427) 0.329 Lag 2-day 1.204 (0.664, 2.184) 0.541 Lag 3-day 0.989 (0.552, 1.771) 0.970 Lag 4-day 1.559 (0.875, 2.775) 0.132 Lag 5-day 1.862 (1.038, 3.342) 0.037 Lag 6-day 1.218 (0.670, 2.215) 0.518 Lag 7-day 1.349 (0.736, 2.474) 0.333 Lag 01-day 1.344 (0.663, 2.724) 0.412 Lag 02-day 1.443 (0.647, 3.217) 0.371 Lag 03-day 1.384 (0.573, 3.342) 0.469 Lag 04-day 1.718 (0.665, 4.440) 0.264 Lag 05-day 2.249 (0.823, 6.144) 0.114 Lag 06-day 2.389 (0.823, 6.938) 0.109 Lag 07-day 2.681 (0.866, 8.299) 0.087 NO3- (10 µg/m³) Lag 0-day 1.006 (0.931, 1.088) 0.871 Lag 1-day 1.020 (0.944, 1.101) 0.623 Lag 2-day 1.020 (0.944, 1.102) 0.617 Lag 3-day 1.019 (0.945, 1.099) 0.620 Lag 4-day 1.078 (1.000, 1.162) 0.049 Lag 5-day 1.129 (1.049, 1.216) 0.001 Lag 6-day 1.030 (0.955, 1.112) 0.439 Lag 7-day 1.064 (0.986, 1.149) 0.109 Lag 01-day 1.018 (0.929, 1.116) 0.699 Lag 02-day 1.027 (0.927, 1.139) 0.608 Lag 03-day 1.035 (0.925, 1.158) 0.546 Lag 04-day 1.072 (0.951, 1.208) 0.254 Lag 05-day 1.131 (0.997, 1.283) 0.055 Lag 06-day 1.140 (0.998, 1.301) 0.054 Lag 07-day 1.165 (1.013, 1.340) 0.032 SO42- (10 µg/m³) Lag 0-day 0.986 (0.874, 1.112) 0.818 Lag 1-day 0.985 (0.873, 1.110) 0.801 Lag 2-day 0.992 (0.879, 1.119) 0.898 Lag 3-day 0.985 (0.876, 1.108) 0.806 Lag 4-day 1.079 (0.962, 1.212) 0.195 Lag 5-day 1.145 (1.021, 1.284) 0.020 Lag 6-day 0.996 (0.885, 1.122) 0.953 Lag 7-day 1.056 (0.937, 1.191) 0.371 Lag 01-day 0.978 (0.846, 1.132) 0.770 Lag 02-day 0.976 (0.824, 1.155) 0.775 Lag 03-day 0.968 (0.801, 1.169) 0.735 Lag 04-day 1.017 (0.828, 1.249) 0.872 Lag 05-day 1.103 (0.885, 1.375) 0.381 Lag 06-day 1.099 (0.868, 1.391) 0.432 Lag 07-day 1.132 (0.880, 1.457) 0.333 NH4+ (10 µg/m³) Lag 0-day 1.008 (0.886, 1.148) 0.903 Lag 1-day 1.035 (0.910, 1.177) 0.602 Lag 2-day 1.048 (0.921, 1.193) 0.475 Lag 3-day 1.027 (0.905, 1.164) 0.682 Lag 4-day 1.127 (0.995, 1.276) 0.061 Lag 5-day 1.190 (1.051, 1.346) 0.006 Lag 6-day 1.046 (0.921, 1.188) 0.490 Lag 7-day 1.109 (0.976, 1.260) 0.114 Lag 01-day 1.030 (0.884, 1.200) 0.704 Lag 02-day 1.055 (0.887, 1.254) 0.544 Lag 03-day 1.065 (0.881, 1.287) 0.514 Lag 04-day 1.129 (0.921, 1.384) 0.242 Lag 05-day 1.222 (0.985, 1.515) 0.068 Lag 06-day 1.237 (0.985, 1.553) 0.068 Lag 07-day 1.288 (1.013, 1.639) 0.039 OM (10 µg/m³) Lag 0-day 1.005 (0.914, 1.106) 0.910 Lag 1-day 1.046 (0.953, 1.149) 0.342 Lag 2-day 1.019 (0.928, 1.119) 0.689 Lag 3-day 1.022 (0.933, 1.119) 0.637 Lag 4-day 1.079 (0.986, 1.180) 0.096 Lag 5-day 1.105 (1.009, 1.209) 0.031 Lag 6-day 1.004 (0.915, 1.101) 0.935 Lag 7-day 1.097 (0.998, 1.205) 0.055 Lag 01-day 1.037 (0.927, 1.160) 0.525 Lag 02-day 1.045 (0.919, 1.187) 0.505 Lag 03-day 1.054 (0.915, 1.214) 0.462 Lag 04-day 1.097 (0.942, 1.276) 0.234 Lag 05-day 1.145 (0.977, 1.342) 0.095 Lag 06-day 1.138 (0.963, 1.344) 0.128 Lag 07-day 1.178 (0.989, 1.403) 0.066 Note. P-values of regression coefficient hypothesis test; the bold indicates correlation is significant at the 0.5 level. Table S4. The estimated odds ratios (95% confidence intervals) for PM2.5 mass and its constituents for each 10 (µg/m³) increase in AECB risk on different lag days (Elimination of the COVID-19 pandemic: Populations after December 2019)
Exposure Lag structures OR (95% CI) P-values PM2.5 (10 µg/m³) Lag 0-day 0.995 (0.969, 1.022) 0.730 Lag 1-day 1.003 (0.977, 1.029) 0.842 Lag 2-day 0.996 (0.971, 1.023) 0.775 Lag 3-day 1.000 (0.975, 1.025) 0.988 Lag 4-day 1.004 (0.979, 1.030) 0.731 Lag 5-day 1.017 (0.992, 1.043) 0.187 Lag 6-day 1.008 (0.982, 1.034) 0.553 Lag 7-day 1.035 (1.009, 1.061) 0.009 Lag 01-day 0.999 (0.968, 1.03) 0.933 Lag 02-day 0.997 (0.962, 1.032) 0.848 Lag 03-day 0.997 (0.959, 1.036) 0.871 Lag 04-day 0.999 (0.959, 1.041) 0.978 Lag 05-day 1.008 (0.965, 1.052) 0.727 Lag 06-day 1.011 (0.966, 1.058) 0.642 Lag 07-day 1.025 (0.978, 1.075) 0.300 BC (10 µg/m³) Lag 0-day 0.869 (0.436, 1.729) 0.688 Lag 1-day 1.137 (0.576, 2.247) 0.711 Lag 2-day 0.972 (0.493, 1.917) 0.934 Lag 3-day 0.882 (0.456, 1.706) 0.708 Lag 4-day 1.082 (0.557, 2.103) 0.815 Lag 5-day 1.232 (0.630, 2.407) 0.542 Lag 6-day 1.364 (0.689, 2.699) 0.373 Lag 7-day 2.227 (1.116, 4.444) 0.023 Lag 01-day 0.993 (0.441, 2.237) 0.987 Lag 02-day 0.977 (0.393, 2.432) 0.961 Lag 03-day 0.912 (0.338, 2.466) 0.856 Lag 04-day 0.957 (0.328, 2.790) 0.936 Lag 05-day 1.059 (0.342, 3.284) 0.920 Lag 06-day 1.212 (0.365, 4.029) 0.753 Lag 07-day 1.691 (0.474, 6.026) 0.418 NO3- (10 µg/m³) Lag 0-day 0.998 (0.911, 1.093) 0.958 Lag 1-day 1.017 (0.930, 1.112) 0.717 Lag 2-day 0.989 (0.904, 1.082) 0.806 Lag 3-day 0.998 (0.915, 1.089) 0.962 Lag 4-day 1.023 (0.936, 1.117) 0.617 Lag 5-day 1.073 (0.984, 1.171) 0.110 Lag 6-day 1.046 (0.958, 1.143) 0.318 Lag 7-day 1.15 (1.054, 1.255) 0.002 Lag 01-day 1.01 (0.908, 1.124) 0.854 Lag 02-day 1.002 (0.889, 1.128) 0.977 Lag 03-day 1.000 (0.879, 1.139) 0.995 Lag 04-day 1.012 (0.881, 1.162) 0.871 Lag 05-day 1.045 (0.903, 1.21) 0.554 Lag 06-day 1.064 (0.911, 1.243) 0.432 Lag 07-day 1.129 (0.958, 1.331) 0.146 SO42- (10 µg/m³) Lag 0-day 0.962 (0.841, 1.102) 0.577 Lag 1-day 0.962 (0.841, 1.100) 0.570 Lag 2-day 0.961 (0.840, 1.100) 0.564 Lag 3-day 0.987 (0.866, 1.124) 0.841 Lag 4-day 0.995 (0.873, 1.134) 0.941 Lag 5-day 1.054 (0.927, 1.199) 0.419 Lag 6-day 0.992 (0.869, 1.133) 0.908 Lag 7-day 1.120 (0.981, 1.279) 0.094 Lag 01-day 0.946 (0.804, 1.112) 0.498 Lag 02-day 0.928 (0.770, 1.118) 0.433 Lag 03-day 0.926 (0.753, 1.138) 0.464 Lag 04-day 0.926 (0.739, 1.161) 0.506 Lag 05-day 0.958 (0.753, 1.220) 0.731 Lag 06-day 0.955 (0.738, 1.237) 0.728 Lag 07-day 1.015 (0.770, 1.337) 0.918 NH4+ (10 µg/m³) Lag 0-day 1.000 (0.862, 1.160) 0.997 Lag 1-day 1.027 (0.887, 1.189) 0.720 Lag 2-day 1.001 (0.864, 1.160) 0.987 Lag 3-day 1.004 (0.871, 1.158) 0.954 Lag 4-day 1.033 (0.895, 1.192) 0.662 Lag 5-day 1.089 (0.945, 1.256) 0.240 Lag 6-day 1.077 (0.932, 1.246) 0.316 Lag 7-day 1.236 (1.071, 1.427) 0.004 Lag 01-day 1.019 (0.857, 1.212) 0.833 Lag 02-day 1.017 (0.836, 1.235) 0.869 Lag 03-day 1.017 (0.822, 1.259) 0.876 Lag 04-day 1.033 (0.821, 1.299) 0.783 Lag 05-day 1.074 (0.842, 1.371) 0.564 Lag 06-day 1.108 (0.856, 1.435) 0.436 Lag 07-day 1.216 (0.925, 1.599) 0.161 OM (10 µg/m³) Lag 0-day 0.989 (0.888, 1.101) 0.841 Lag 1-day 1.049 (0.945, 1.165) 0.367 Lag 2-day 0.995 (0.895, 1.106) 0.921 Lag 3-day 1.012 (0.915, 1.120) 0.815 Lag 4-day 1.025 (0.925, 1.135) 0.637 Lag 5-day 1.053 (0.951, 1.165) 0.324 Lag 6-day 1.018 (0.918, 1.130) 0.732 Lag 7-day 1.183 (1.066, 1.312) 0.002 Lag 01-day 1.028 (0.906, 1.166) 0.670 Lag 02-day 1.021 (0.884, 1.179) 0.781 Lag 03-day 1.026 (0.876, 1.201) 0.749 Lag 04-day 1.038 (0.876, 1.229) 0.667 Lag 05-day 1.061 (0.889, 1.267) 0.509 Lag 06-day 1.066 (0.886, 1.284) 0.497 Lag 07-day 1.143 (0.942, 1.388) 0.176 Note. P-values of regression coefficient hypothesis test; the bold indicates correlation is significant at the 0.5 level.
doi: 10.3967/bes2025.026
Short-term Effects of Fine Particulate Matter and its Constituents on Acute Exacerbations of Chronic Bronchitis: A Time-stratified Case-crossover Study
-
Conceptualization, Investigation, Data curation, Methodology, Formal analysis, Visualization, Writing-original draft: Jingwei Zhang & Jian Zhang. Data curation, Methodology, Writing - Review & Editing: Pengfei Li. Data curation, Methodology: Yandan Xu. Investigation, Writing - Review & Editing: Xuesong Zhou. Investigation, Writing- review & Editing: Xiuli Tang. Investigation, Writing - review & Editing: Jia Qiu. Investigation, Writing - review & Editing: Zhongao Ding. Conceptualization, Methodology, Validation, Supervision, Project administration, Writing - review & editing: Mingjia Xu. Conceptualization, Methodology, Validation, Supervision, Writing - Review & Editing, Funding acquisition, Project administration: Chongjian Wang. All authors have approved the final manuscript.
The authors declare that no potential conflicts of interest exist.
&These authors contributed equally to this work.
注释:1) Authors’ Contributions: 2) Competing Interests: -
S1. Map distribution of acute exacerbations of chronic bronchitis. Map approval number: SH(2020)037.
S2. The pairwise coefficients of Spearman correlation between PM2.5 and its constituents.
Figure 1. Odds ratios (with 95% CIs) for the increased incidence of acute exacerbation of chronic bronchitis associated with a 10 µg/m³ increment increase in PM2.5 and its constituents at various lag days.
Figure 2. Concentration-response curves PM2.5 and its constituents associated with acute exacerbation of chronic bronchitis. P nonlinear: Likelihood ratio tests for non-linearity with the null hypothesis that there was no difference between the linear assumption and NSC smoothing function. NSC: natural spline cubic.
S3. The association between PM2.5 and its constituents and acute exacerbations of chronic bronchitis in the CHAP data set.
S4. Concentration-response curves PM2.5 and its constituents associated with acute exacerbations of chronic bronchitis in the CHAP data set.
Table 1. Summary statistics and characteristics of AECB cases
Characteristic Number Percentage (%) AECB (ICD-10 code: J44.1) 2,202 100 Case days 2,202 − Control days 7,381 − Sex Men 1,348 61.22 Women 854 38.78 Age of onset (years, mean ± SD) 78.47 ± 8.53 − < 80 years 1,057 48.00 ≥ 80 years 1,145 52.00 Season at happen Cold (January to March, October to December) 1,384 62.85 Warm (April to September) 818 37.15 Note. Number is frequency, or mean ± SD, or n (%). ICD-10, International Classification of Diseases–Tenth Revision; AECB, acute exacerbation of chronic bronchitis.  下载: 导出CSV
S1. Summary distributions of total PM2.5, PM2.5 constituents on case days and control days, 2018–2022
Variables Min Q1 (25%) Median Q3 (75%) Max Mean SD IQR % of PM2.5 mass On case days (n = 2,202) PM2.5 (µg/m³) 1.00 18.00 27.00 47.00 132.00 34.52 22.85 29.00 100 BC (µg/m³) 0.03 0.79 1.21 1.84 5.26 1.42 0.84 1.05 4.11 NO3- (µg/m³) 0.11 3.09 5.73 11.88 40.59 8.20 6.94 8.79 23.75 SO42- (µg/m³) 0.18 3.76 5.55 8.46 31.05 6.65 4.13 4.70 19.26 NH4+ (µg/m³) 0.09 2.35 4.04 7.66 21.36 5.34 4.03 5.31 15.47 OM (µg/m³) 0.20 3.72 5.83 9.74 32.59 7.47 5.32 6.02 21.64 On control days (n = 7,381) PM2.5 (µg/m³) 1.00 18.00 27.00 47.00 135.00 34.53 22.73 29.00 100 BC (µg/m³) 0.03 0.80 1.23 1.84 4.95 1.41 0.80 1.04 4.08 NO3- (µg/m³) 0.10 3.03 5.80 12.13 42.28 8.17 6.75 9.10 23.66 SO42- (µg/m³) 0.17 3.73 5.60 8.70 31.20 6.66 4.12 4.97 19.29 NH4+ (µg/m³) 0.08 2.32 4.09 7.73 22.12 5.33 3.95 5.41 15.44 OM (µg/m³) 0.17 3.75 5.88 9.75 34.21 7.46 5.22 6.00 21.60 Note. PM2.5, fine particulate matter; BC, black carbon; NO3- , nitrate; SO42- , sulfate; NH4+ , ammonium; OM, organic matter. Min, minimum; Max, maximum; SD, standard deviation; IQR, interquartile range.
下载: 导出CSV
S2. Summary distribution of average levels of PM2.5 its constituents for the study period 2018–2020
Variable Min Q1 (25%) Median Q3 (75%) Max Mean SD IQR PM2.5 (µg/m³) 1.00 18.00 27.00 47.00 135.00 34.52 22.48 29.00 BC (µg/m³) 0.03 0.8 1.22 1.84 5.26 1.41 0.81 1.04 NO3- (µg/m³) 0.10 3.04 5.79 12.09 42.28 8.18 6.79 9.05 SO42- (µg/m³) 0.17 3.74 5.59 8.61 31.20 6.66 4.12 4.87 NH4- (µg/m³) 0.08 2.33 4.07 7.72 22.12 5.33 3.97 5.38 OM (µg/m³) 0.17 3.74 5.86 9.75 34.21 7.46 5.24 6.01 Note. PM2.5, fine particulate matter; BC, black carbon; NO3- , nitrate; SO42- , sulfate; NH4+ , ammonium; OM, organic matter. Min, minimum; Max, maximum; SD, standard deviation; IQR, interquartile range.
下载: 导出CSV
S5. In subgroup analyses, the odds ratio (95% CI) for AECB was associated with each 10µg/m³ increase in exposure to PM2.5 and its constituents
Subgroup PM2.5 BC NO3- OR (95% CI) P-values P.int OR (95% CI) P-values P.int OR (95% CI) P-values P.int Sex Men 1.046 (1.017, 1.076) 0.002 0.165 2.352 (1.104, 5.009) 0.027 0.341 1.168 (1.062, 1.285) 0.001 0.271 Women 1.013 (0.979, 1.049) 0.455 1.317 (0.522, 3.32) 0.559 1.074 (0.956, 1.207) 0.231 Age < 80 years 1.034 (1.002, 1.067) 0.035 0.888 1.549 (0.669, 3.586) 0.307 0.548 1.132 (1.019, 1.258) 0.021 0.951 80+ years 1.031 (1.000, 1.063) 0.048 2.218 (0.981, 5.013) 0.056 1.127 (1.017, 1.249) 0.023 Season at happen Cold 1.034 (1.009, 1.059) 0.008 0.882 2.391 (1.223, 4.674) 0.011 0.138 1.125 (1.037, 1.221) 0.005 0.835 Warm 1.029 (0.980, 1.081) 0.252 0.840 (0.251, 2.813) 0.778 1.148 (0.969, 1.36) 0.110 Subgroup SO42- NH4+ OM OR (95% CI) P-values P.int OR (95% CI) P-values P.int OR (95% CI) P-values P.int Sex Men 1.235 (1.065, 1.432) 0.005 0.119 1.265 (1.077, 1.485) 0.004 0.24 1.145 (1.018, 1.287) 0.023 0.394 Women 1.025 (0.855, 1.229) 0.789 1.087 (0.894, 1.321) 0.404 1.048 (0.909, 1.209) 0.515 Age < 80 years 1.172 (0.996, 1.38) 0.056 0.391 1.207 (1.011, 1.441) 0.037 0.818 1.116 (0.982, 1.269) 0.094 0.826 80+ years 1.119 (0.953, 1.315) 0.170 1.173 (0.986, 1.395) 0.072 1.094 (0.963, 1.242) 0.166 Season Cold 1.171 (1.020, 1.344) 0.025 0.569 1.191 (1.035, 1.37) 0.015 0.972 1.111 (1.005, 1.228) 0.039 0.793 Warm 1.089 (0.884, 1.341) 0.423 1.184 (0.909, 1.544) 0.210 1.077 (0.876, 1.325) 0.480 Note. *P < 0.05; P.int: P-value of regression coefficient hypothesis test. P-values of regression coefficient hypothesis test.
下载: 导出CSV
S6. Sensitivity analysis of odds ratios (95% CI) for each 10 µg/m³-associated increase in exposure to air pollutants in AECB
Exposure Model adjustments OR (95% CI) P-values a P.int PM2.5 Main model 1.033 (1.01, 1.055) 0.004 − and O3 1.029 (1.005, 1.052) 0.016 0.656 BC Main model 1.862 (1.038, 3.342) 0.037 − and O3 1.642 (0.890, 3.027) 0.112 0.209 NO3- Main model 1.129 (1.049, 1.216) 0.001 − and O3 1.116 (1.033, 1.206) 0.005 0.754 SO42- Main model 1.145 (1.021, 1.284) 0.02 − and O3 1.122 (0.997, 1.262) 0.056 0.769 NH4+ Main model 1.190 (1.051, 1.346) 0.006 − and O3 1.162 (1.020, 1.324) 0.024 0.657 OM Main model 1.105 (1.009, 1.209) 0.031 − and O3 1.082 (0.984, 1.191) 0.105 0.595 Note. df: degrees of freedom; P.int: P-value of regression coefficient hypothesis test. P-values of regression coefficient hypothesis test.
下载: 导出CSV
S3. The estimated odds ratios (95% CI) for PM2.5 and its constituents for each 10 (µg/m³) increase in AECB risk on different lag days
Exposure Lag structures OR (95% CI) P-values PM2.5 (10 µg/m³) Lag 0-day 1.002 (0.979, 1.025) 0.869 Lag 1-day 1.006 (0.984, 1.029) 0.598 Lag 2-day 1.005 (0.983, 1.028) 0.656 Lag 3-day 1.002 (0.980, 1.025) 0.849 Lag 4-day 1.020 (0.998, 1.042) 0.081 Lag 5-day 1.033 (1.010, 1.055) 0.004 Lag 6-day 1.003 (0.981, 1.026) 0.785 Lag 7-day 1.014 (0.992, 1.037) 0.217 Lag 01-day 1.006 (0.979, 1.033) 0.679 Lag 02-day 1.008 (0.977, 1.040) 0.606 Lag 03-day 1.009 (0.975, 1.043) 0.619 Lag 04-day 1.019 (0.982, 1.056) 0.316 Lag 05-day 1.034 (0.995, 1.074) 0.088 Lag 06-day 1.033 (0.993, 1.075) 0.108 Lag 07-day 1.038 (0.996, 1.083) 0.078 BC (10 µg/m³) Lag 0-day 1.129 (0.623, 2.046) 0.690 Lag 1-day 1.343 (0.743, 2.427) 0.329 Lag 2-day 1.204 (0.664, 2.184) 0.541 Lag 3-day 0.989 (0.552, 1.771) 0.970 Lag 4-day 1.559 (0.875, 2.775) 0.132 Lag 5-day 1.862 (1.038, 3.342) 0.037 Lag 6-day 1.218 (0.670, 2.215) 0.518 Lag 7-day 1.349 (0.736, 2.474) 0.333 Lag 01-day 1.344 (0.663, 2.724) 0.412 Lag 02-day 1.443 (0.647, 3.217) 0.371 Lag 03-day 1.384 (0.573, 3.342) 0.469 Lag 04-day 1.718 (0.665, 4.440) 0.264 Lag 05-day 2.249 (0.823, 6.144) 0.114 Lag 06-day 2.389 (0.823, 6.938) 0.109 Lag 07-day 2.681 (0.866, 8.299) 0.087 NO3- (10 µg/m³) Lag 0-day 1.006 (0.931, 1.088) 0.871 Lag 1-day 1.020 (0.944, 1.101) 0.623 Lag 2-day 1.020 (0.944, 1.102) 0.617 Lag 3-day 1.019 (0.945, 1.099) 0.620 Lag 4-day 1.078 (1.000, 1.162) 0.049 Lag 5-day 1.129 (1.049, 1.216) 0.001 Lag 6-day 1.030 (0.955, 1.112) 0.439 Lag 7-day 1.064 (0.986, 1.149) 0.109 Lag 01-day 1.018 (0.929, 1.116) 0.699 Lag 02-day 1.027 (0.927, 1.139) 0.608 Lag 03-day 1.035 (0.925, 1.158) 0.546 Lag 04-day 1.072 (0.951, 1.208) 0.254 Lag 05-day 1.131 (0.997, 1.283) 0.055 Lag 06-day 1.140 (0.998, 1.301) 0.054 Lag 07-day 1.165 (1.013, 1.340) 0.032 SO42- (10 µg/m³) Lag 0-day 0.986 (0.874, 1.112) 0.818 Lag 1-day 0.985 (0.873, 1.110) 0.801 Lag 2-day 0.992 (0.879, 1.119) 0.898 Lag 3-day 0.985 (0.876, 1.108) 0.806 Lag 4-day 1.079 (0.962, 1.212) 0.195 Lag 5-day 1.145 (1.021, 1.284) 0.020 Lag 6-day 0.996 (0.885, 1.122) 0.953 Lag 7-day 1.056 (0.937, 1.191) 0.371 Lag 01-day 0.978 (0.846, 1.132) 0.770 Lag 02-day 0.976 (0.824, 1.155) 0.775 Lag 03-day 0.968 (0.801, 1.169) 0.735 Lag 04-day 1.017 (0.828, 1.249) 0.872 Lag 05-day 1.103 (0.885, 1.375) 0.381 Lag 06-day 1.099 (0.868, 1.391) 0.432 Lag 07-day 1.132 (0.880, 1.457) 0.333 NH4+ (10 µg/m³) Lag 0-day 1.008 (0.886, 1.148) 0.903 Lag 1-day 1.035 (0.910, 1.177) 0.602 Lag 2-day 1.048 (0.921, 1.193) 0.475 Lag 3-day 1.027 (0.905, 1.164) 0.682 Lag 4-day 1.127 (0.995, 1.276) 0.061 Lag 5-day 1.190 (1.051, 1.346) 0.006 Lag 6-day 1.046 (0.921, 1.188) 0.490 Lag 7-day 1.109 (0.976, 1.260) 0.114 Lag 01-day 1.030 (0.884, 1.200) 0.704 Lag 02-day 1.055 (0.887, 1.254) 0.544 Lag 03-day 1.065 (0.881, 1.287) 0.514 Lag 04-day 1.129 (0.921, 1.384) 0.242 Lag 05-day 1.222 (0.985, 1.515) 0.068 Lag 06-day 1.237 (0.985, 1.553) 0.068 Lag 07-day 1.288 (1.013, 1.639) 0.039 OM (10 µg/m³) Lag 0-day 1.005 (0.914, 1.106) 0.910 Lag 1-day 1.046 (0.953, 1.149) 0.342 Lag 2-day 1.019 (0.928, 1.119) 0.689 Lag 3-day 1.022 (0.933, 1.119) 0.637 Lag 4-day 1.079 (0.986, 1.180) 0.096 Lag 5-day 1.105 (1.009, 1.209) 0.031 Lag 6-day 1.004 (0.915, 1.101) 0.935 Lag 7-day 1.097 (0.998, 1.205) 0.055 Lag 01-day 1.037 (0.927, 1.160) 0.525 Lag 02-day 1.045 (0.919, 1.187) 0.505 Lag 03-day 1.054 (0.915, 1.214) 0.462 Lag 04-day 1.097 (0.942, 1.276) 0.234 Lag 05-day 1.145 (0.977, 1.342) 0.095 Lag 06-day 1.138 (0.963, 1.344) 0.128 Lag 07-day 1.178 (0.989, 1.403) 0.066 Note. P-values of regression coefficient hypothesis test; the bold indicates correlation is significant at the 0.5 level.
下载: 导出CSV
S4. The estimated odds ratios (95% confidence intervals) for PM2.5 mass and its constituents for each 10 (µg/m³) increase in AECB risk on different lag days (Elimination of the COVID-19 pandemic: Populations after December 2019)
Exposure Lag structures OR (95% CI) P-values PM2.5 (10 µg/m³) Lag 0-day 0.995 (0.969, 1.022) 0.730 Lag 1-day 1.003 (0.977, 1.029) 0.842 Lag 2-day 0.996 (0.971, 1.023) 0.775 Lag 3-day 1.000 (0.975, 1.025) 0.988 Lag 4-day 1.004 (0.979, 1.030) 0.731 Lag 5-day 1.017 (0.992, 1.043) 0.187 Lag 6-day 1.008 (0.982, 1.034) 0.553 Lag 7-day 1.035 (1.009, 1.061) 0.009 Lag 01-day 0.999 (0.968, 1.03) 0.933 Lag 02-day 0.997 (0.962, 1.032) 0.848 Lag 03-day 0.997 (0.959, 1.036) 0.871 Lag 04-day 0.999 (0.959, 1.041) 0.978 Lag 05-day 1.008 (0.965, 1.052) 0.727 Lag 06-day 1.011 (0.966, 1.058) 0.642 Lag 07-day 1.025 (0.978, 1.075) 0.300 BC (10 µg/m³) Lag 0-day 0.869 (0.436, 1.729) 0.688 Lag 1-day 1.137 (0.576, 2.247) 0.711 Lag 2-day 0.972 (0.493, 1.917) 0.934 Lag 3-day 0.882 (0.456, 1.706) 0.708 Lag 4-day 1.082 (0.557, 2.103) 0.815 Lag 5-day 1.232 (0.630, 2.407) 0.542 Lag 6-day 1.364 (0.689, 2.699) 0.373 Lag 7-day 2.227 (1.116, 4.444) 0.023 Lag 01-day 0.993 (0.441, 2.237) 0.987 Lag 02-day 0.977 (0.393, 2.432) 0.961 Lag 03-day 0.912 (0.338, 2.466) 0.856 Lag 04-day 0.957 (0.328, 2.790) 0.936 Lag 05-day 1.059 (0.342, 3.284) 0.920 Lag 06-day 1.212 (0.365, 4.029) 0.753 Lag 07-day 1.691 (0.474, 6.026) 0.418 NO3- (10 µg/m³) Lag 0-day 0.998 (0.911, 1.093) 0.958 Lag 1-day 1.017 (0.930, 1.112) 0.717 Lag 2-day 0.989 (0.904, 1.082) 0.806 Lag 3-day 0.998 (0.915, 1.089) 0.962 Lag 4-day 1.023 (0.936, 1.117) 0.617 Lag 5-day 1.073 (0.984, 1.171) 0.110 Lag 6-day 1.046 (0.958, 1.143) 0.318 Lag 7-day 1.15 (1.054, 1.255) 0.002 Lag 01-day 1.01 (0.908, 1.124) 0.854 Lag 02-day 1.002 (0.889, 1.128) 0.977 Lag 03-day 1.000 (0.879, 1.139) 0.995 Lag 04-day 1.012 (0.881, 1.162) 0.871 Lag 05-day 1.045 (0.903, 1.21) 0.554 Lag 06-day 1.064 (0.911, 1.243) 0.432 Lag 07-day 1.129 (0.958, 1.331) 0.146 SO42- (10 µg/m³) Lag 0-day 0.962 (0.841, 1.102) 0.577 Lag 1-day 0.962 (0.841, 1.100) 0.570 Lag 2-day 0.961 (0.840, 1.100) 0.564 Lag 3-day 0.987 (0.866, 1.124) 0.841 Lag 4-day 0.995 (0.873, 1.134) 0.941 Lag 5-day 1.054 (0.927, 1.199) 0.419 Lag 6-day 0.992 (0.869, 1.133) 0.908 Lag 7-day 1.120 (0.981, 1.279) 0.094 Lag 01-day 0.946 (0.804, 1.112) 0.498 Lag 02-day 0.928 (0.770, 1.118) 0.433 Lag 03-day 0.926 (0.753, 1.138) 0.464 Lag 04-day 0.926 (0.739, 1.161) 0.506 Lag 05-day 0.958 (0.753, 1.220) 0.731 Lag 06-day 0.955 (0.738, 1.237) 0.728 Lag 07-day 1.015 (0.770, 1.337) 0.918 NH4+ (10 µg/m³) Lag 0-day 1.000 (0.862, 1.160) 0.997 Lag 1-day 1.027 (0.887, 1.189) 0.720 Lag 2-day 1.001 (0.864, 1.160) 0.987 Lag 3-day 1.004 (0.871, 1.158) 0.954 Lag 4-day 1.033 (0.895, 1.192) 0.662 Lag 5-day 1.089 (0.945, 1.256) 0.240 Lag 6-day 1.077 (0.932, 1.246) 0.316 Lag 7-day 1.236 (1.071, 1.427) 0.004 Lag 01-day 1.019 (0.857, 1.212) 0.833 Lag 02-day 1.017 (0.836, 1.235) 0.869 Lag 03-day 1.017 (0.822, 1.259) 0.876 Lag 04-day 1.033 (0.821, 1.299) 0.783 Lag 05-day 1.074 (0.842, 1.371) 0.564 Lag 06-day 1.108 (0.856, 1.435) 0.436 Lag 07-day 1.216 (0.925, 1.599) 0.161 OM (10 µg/m³) Lag 0-day 0.989 (0.888, 1.101) 0.841 Lag 1-day 1.049 (0.945, 1.165) 0.367 Lag 2-day 0.995 (0.895, 1.106) 0.921 Lag 3-day 1.012 (0.915, 1.120) 0.815 Lag 4-day 1.025 (0.925, 1.135) 0.637 Lag 5-day 1.053 (0.951, 1.165) 0.324 Lag 6-day 1.018 (0.918, 1.130) 0.732 Lag 7-day 1.183 (1.066, 1.312) 0.002 Lag 01-day 1.028 (0.906, 1.166) 0.670 Lag 02-day 1.021 (0.884, 1.179) 0.781 Lag 03-day 1.026 (0.876, 1.201) 0.749 Lag 04-day 1.038 (0.876, 1.229) 0.667 Lag 05-day 1.061 (0.889, 1.267) 0.509 Lag 06-day 1.066 (0.886, 1.284) 0.497 Lag 07-day 1.143 (0.942, 1.388) 0.176 Note. P-values of regression coefficient hypothesis test; the bold indicates correlation is significant at the 0.5 level.
下载: 导出CSV
-
[1] Mejza F, Gnatiuc L, Buist AS, et al. Prevalence and burden of chronic bronchitis symptoms: results from the BOLD study. Eur Respir J, 2017; 50, 1700621. doi: 10.1183/13993003.00621-2017 [2] de Oca MM, Halbert RJ, Lopez MV, et al. The chronic bronchitis phenotype in subjects with and without COPD: the PLATINO study. Eur Respir J, 2012; 40, 28−36. doi: 10.1183/09031936.00141611 [3] van Donkelaar A, Martin RV, Li C, et al. Regional estimates of chemical composition of fine particulate matter using a combined geoscience-statistical method with information from satellites, models, and monitors. Environ Sci Technol, 2019; 53, 2595−611. doi: 10.1021/acs.est.8b06392 [4] Doiron D, Bourbeau J, De Hoogh K, et al. Ambient air pollution exposure and chronic bronchitis in the Lifelines cohort. Thorax, 2021; 76, 772−9. doi: 10.1136/thoraxjnl-2020-216142 [5] Hooper LG, Young MT, Keller JP, et al. Ambient air pollution and chronic bronchitis in a cohort of U. S. women. Environ Health Perspect, 2018; 126, 027005. doi: 10.1289/EHP2199 [6] Geng GN, Zhang Q, Tong D, et al. Chemical composition of ambient PM2.5 over China and relationship to precursor emissions during 2005-2012. Atmos Chem Phys, 2017; 17, 9187−203. doi: 10.5194/acp-17-9187-2017 [7] Liu SG, Geng GN, Xiao QY, et al. Tracking daily concentrations of PM2.5 chemical composition in China since 2000. Environ Sci Technol, 2022; 56, 16517−27. doi: 10.1021/acs.est.2c06510 [8] Janes H, Sheppard L, Lumley T. Case-crossover analyses of air pollution exposure data: referent selection strategies and their implications for bias. Epidemiology, 2005; 16, 717−26. doi: 10.1097/01.ede.0000181315.18836.9d [9] Liu LJ, Song FJ, Fang JY, et al. Intraday effects of ambient PM1 on emergency department visits in Guangzhou, China: a case-crossover study. Sci Total Environ, 2021; 750, 142347. doi: 10.1016/j.scitotenv.2020.142347 [10] Song YT, Yang L, Kang N, et al. Associations of incident female breast cancer with long-term exposure to PM2.5 and its constituents: findings from a prospective cohort study in Beijing, China. J Hazard Mater, 2024; 473, 134614. doi: 10.1016/j.jhazmat.2024.134614 -
 24453+Supplementary Materials.pdf

-

 点击查看大图

计量
- 文章访问数: 86
- HTML全文浏览量: 30
- PDF下载量: 14
- 被引次数: 0

 Quick Links