-
Acute exacerbation of idiopathic pulmonary fibrosis (AEIPF) is the most important cause of health deterioration and death as a result of idiopathic pulmonary fibrosis (IPF). In recent years, the hospitalization and mortality rates due to AEIPF have increased significantly[1]. However, until the present, the cause of AEIPF remains unclear, thereby needing research attention. The harm of long-term sustained exposure or short-term acute exposure to air pollutants to respiratory health has been confirmed by a large number of studies[2-3]. Current studies have suggested that the incidence and progression of IPF are related to continuous exposure to atmospheric fine particles[4]. However, few reports are available on the acute aggravation of IPF induced by atmospheric fine particulate matter. In our clinical work in recent years, we found that the hospitalization time of AEIPF patients was related to the occurrence of local air pollution, and the number of hospitalized patients increased significantly during the period of severe air pollution. Thus, we adopted a retrospective analysis of AEIPF patients clinical data from January 2005 to December 2017 (a total of 13 years) in the first affiliated hospital of Harbin Medical University. We further analyzed the correlation between patients’ hospitalization time and atmospheric pollutants to study the effect of air pollutants on the exacerbation of IPF in adults and the characteristics of the affected population.
We screened the hospitalized cases diagnosed as AEIPF in the respiratory department of the hospital. The following were the inclusion criteria: the results of lung HRCT images of patients should be in line with the IPF diagnostic criteria formulated by ATS/ERS in 2011[5] and the AE-IPF diagnostic criteria in 2015[6]. Cases of interstitial pulmonary disease of other causes were excluded. A total of 811 patients were selected, including 327 males and 484 females, with an average age of 64 ± 5.3 years.
Relevant information on air pollution is provided by the School of Environment, Harbin University of Technology. The information provided includes monitoring data on air pollutant composition, and various particle types and concentrations in Heilongjiang from January 2013 to December 2017. In accordance with the environmental air quality standard (GB 3095-2012), the limit of PM2.5 24-h average daily concentration ranges from 0–35 g/m3 as level 1 and 35–75 g/m3 as level 2. The annual average PM2.5 concentration limit of 0–15 g/m3 is level 1 and 15–35 g/m3 is level 2[7]. Combined with the local climate characteristics, January, February, October, November, and December of each year were determined as the serious period of air pollution. The AEIPF patients hospitalized during this period were identified as the high concentration group for inhaled fine particles (group A) and the patients hospitalized during the rest of the months were the low concentration group (group B).
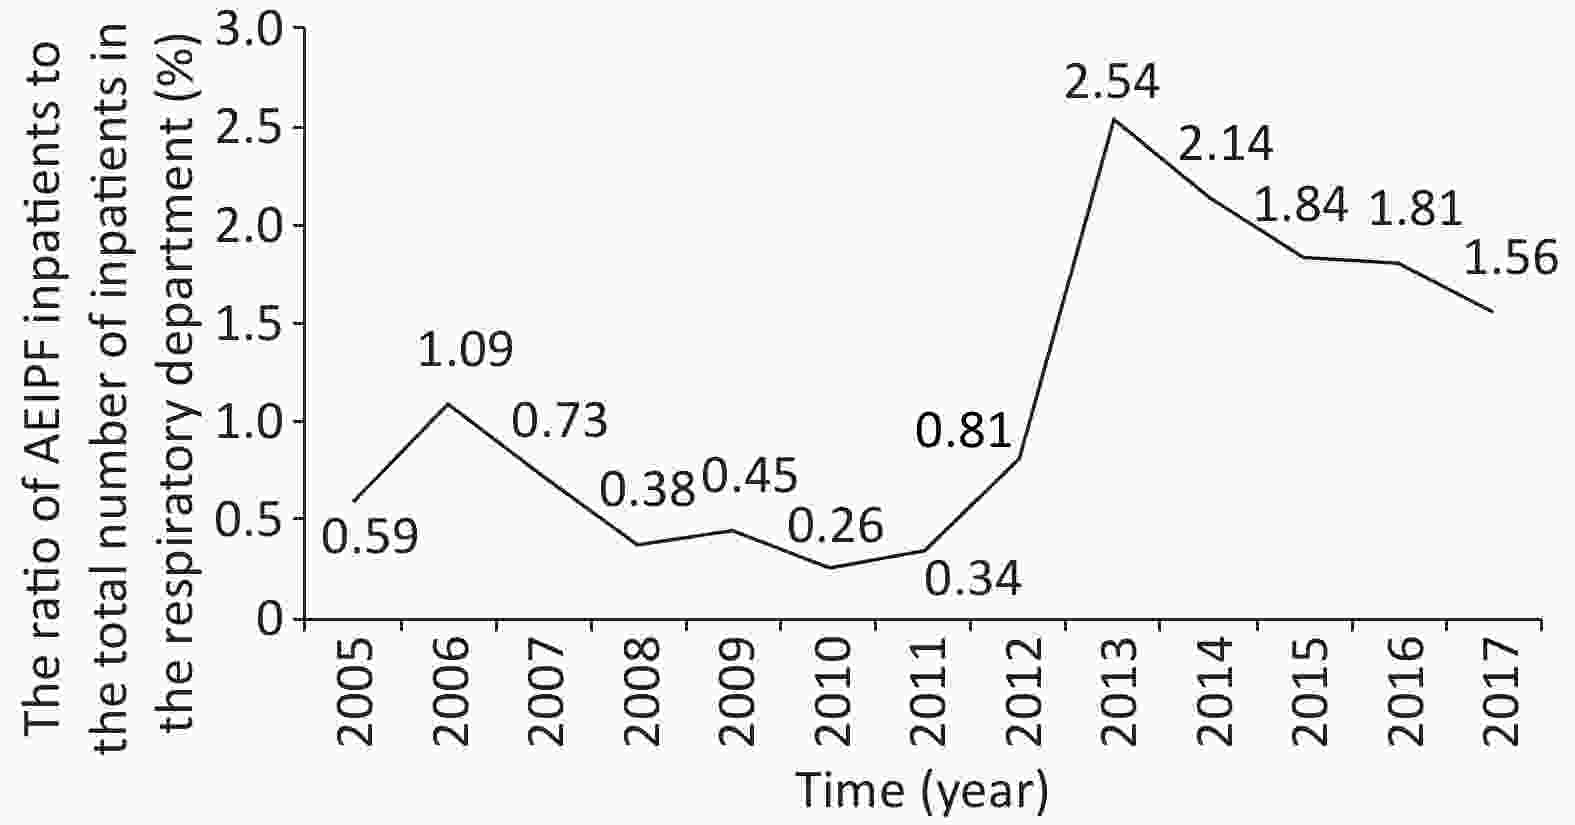
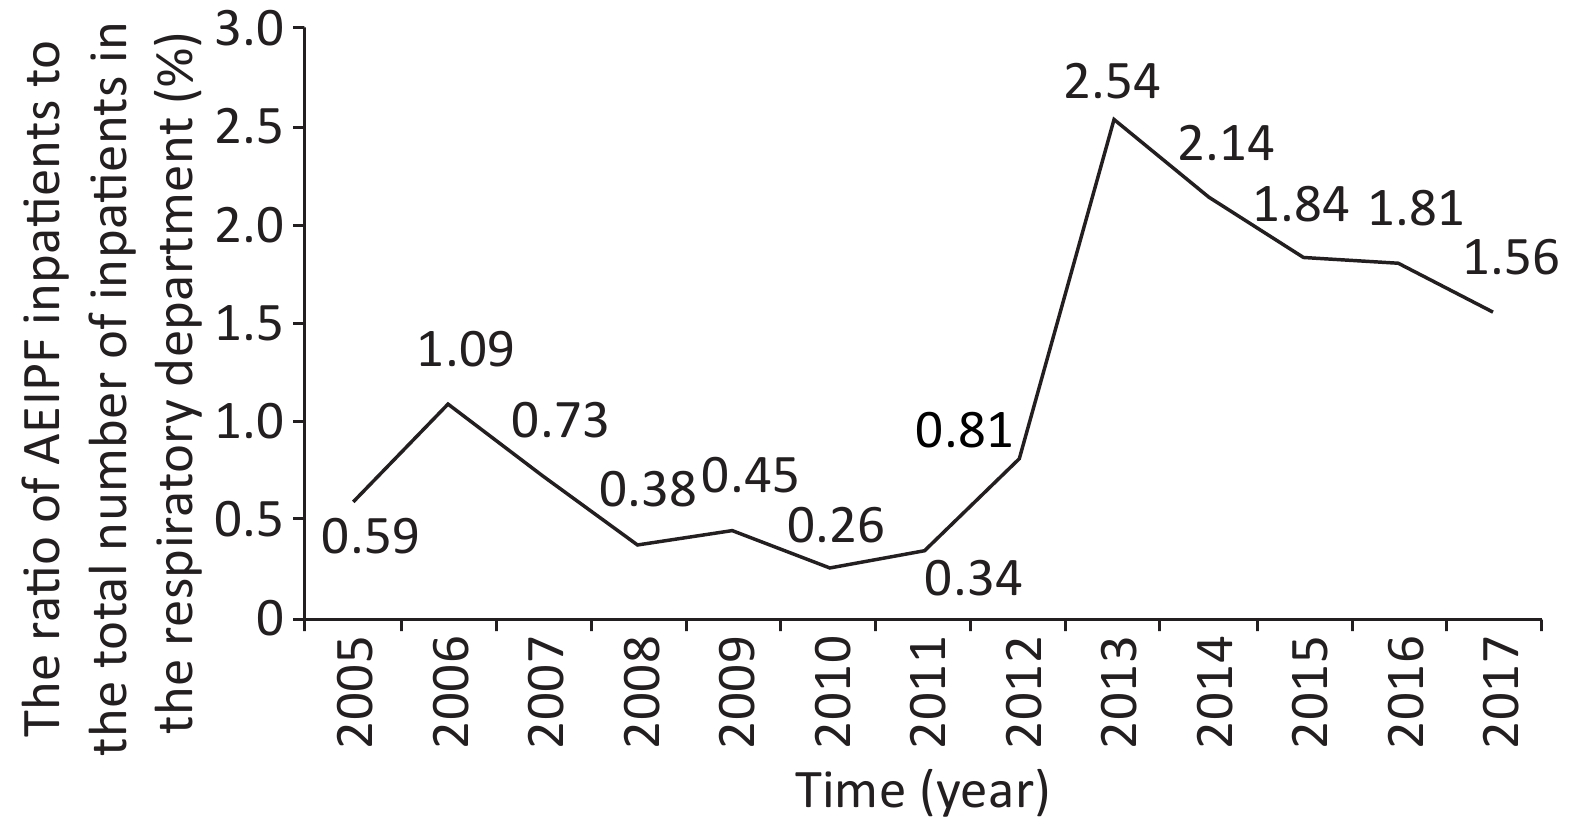
We used SPSS16.0 software to conduct statistical analysis and research on the clinical data of patients and atmospheric environment monitoring data. The analysis results are as follows. The ratio of AEIPF inpatients to the total number of inpatients in the respiratory department from January 2005 to December 2017 is shown in Figure 1, indicating that the ratio of AEIPF inpatients increased in 13 years. The ratio of AEIPF to inpatients has increased significantly since 2012, and 2013 is the year with the highest ratio (P < 0.05).

Figure 1. Trend chart of ratio of AEIPF inpatients to total inpatients in respiratory department over time.The Chi-square value of the linear trend is 141.163, P < 0.0001.
According to the monitoring data of air pollutants in Harbin, the correlation between the concentration of different components of air pollutants and the hospitalization rate of AEIPF from January 2013 to December 2017 was further analyzed. The results are shown in Table 1. As the table indicates, the correlation coefficient OR value between the hospitalization rate of AEIPF and the concentration of PM10, PM2.5, and SO2 in the atmosphere is 0.862, 0.886, and 0.761, respectively, with a positive correlation. The OR values of CO and O3 were –0.371 and –0.525, respectively, showing a negative correlation. The hospital admission rate decreased with the decrease of pollutant concentration in 2017, which further confirmed the existence of a positive correlation between the concentration of different components of air pollutants and the hospitalization rate of AEIPF.
Table 1. Correlation analysis of annual hospitalization rate of AEIPF and concentration of various components of air pollutants from 2013 to 2017
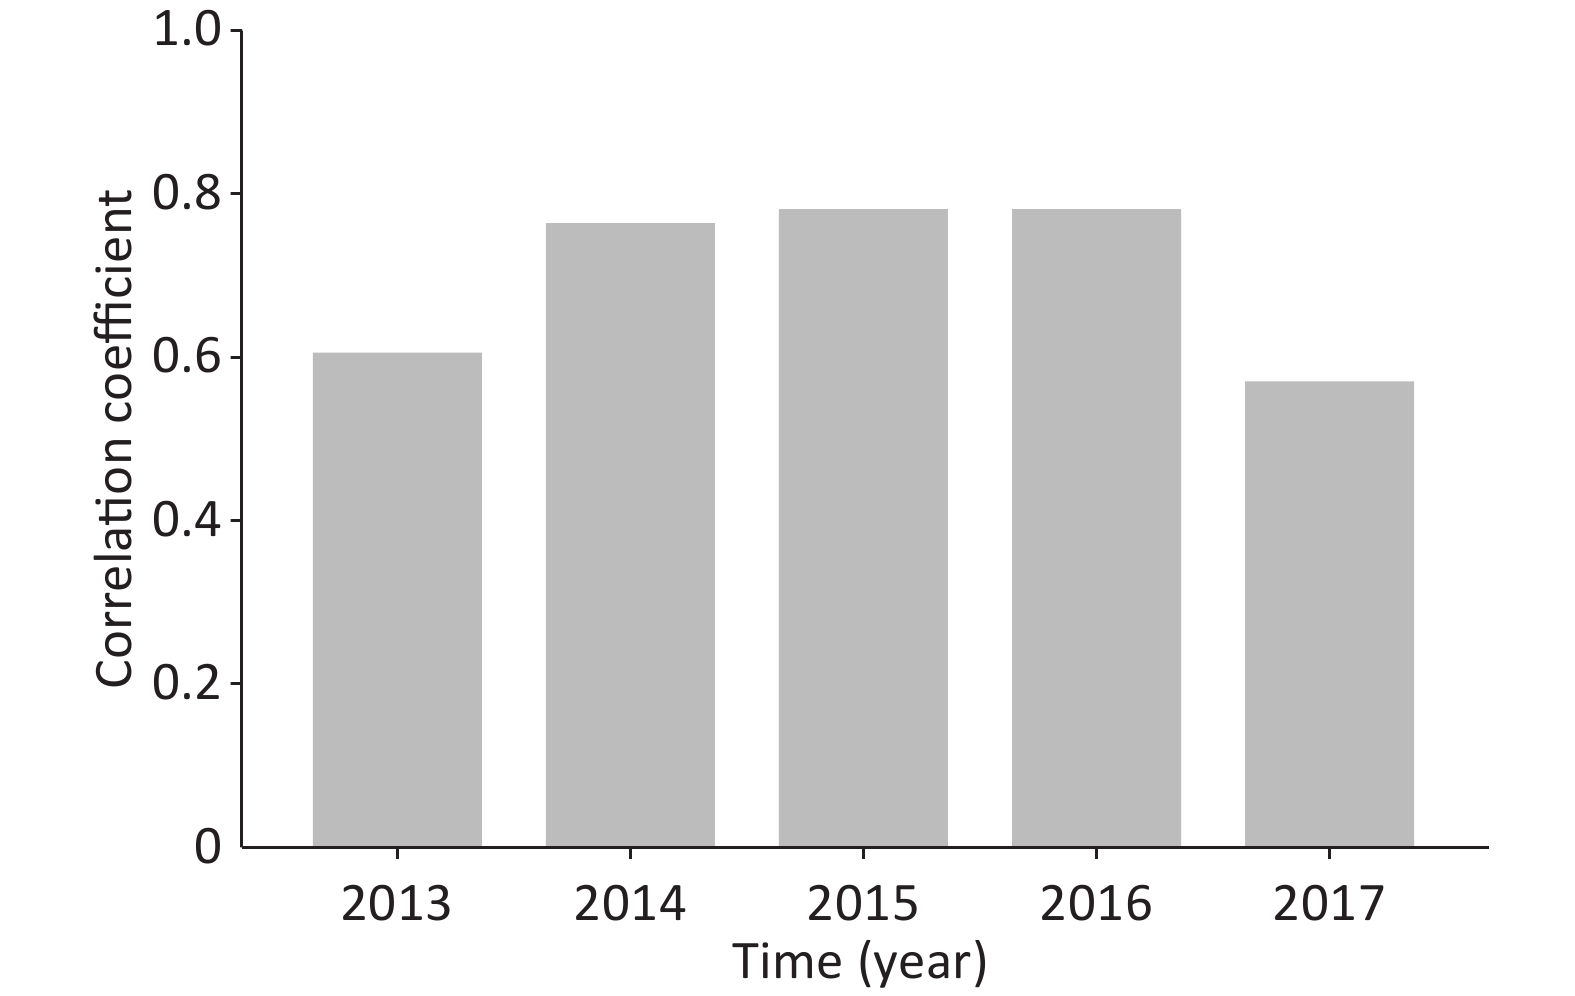
Items 2013 2014 2015 2016 2017 OR value Rate of AEIPF inpatient (%) (n = 811) 18.740 17.020 15.660 14.920 13.560 PM10 (mg/m3) 0.119 0.111 0.103 0.074 0.085 0.862 SO2 (mg/m3) 0.044 0.057 0.040 0.029 0.025 0.761 PM2.5 (mg/m3) 0.081 0.072 0.070 0.051 0.057 0.886 CO (mg/m3) 1.029 0.890 1.800 2.000 1.056 –0.371 O3 (mg/m3) 0.038 0.042 0.106 0.106 0.059 –0.525 As this region is located in the cold temperate zone, the cold climate and low air pressure in winter are not conducive to the diffusion of pollutants. Winter heating time is long, thereby aggravating the slow release of air pollutants and other adverse factors. In this regard, we analyzed the relationship between the concentration of PM2.5 in the atmosphere and the hospitalization rate of AEIPF in different months from 2013 to 2017. The correlation rates were OR = 0.599 (P = 0.039), OR = 0.756 (P = 0.005), OR = 0.772 (P = 0.003), OR = 0.771 (P = 0.003), and OR = 0.564 (P = 0.056). The results of statistical analysis are shown in Supplementary Table S1 and Figure S1 (available in www.besjournal.com). The results of OR value indicate a significant positive correlation between PM2.5 concentration and inpatient ratio in different months of each year. Thus, PM2.5 concentration may be an important risk factor for acute aggravation of IPF hospitalization.
Table S1. Correlation analysis of AEIPF rate and PM2.5 concentration in different months of each year
Month 2013 (n = 152) 2014 (n = 138) 2015 (n = 127) 2016 (n = 121) 2017 (n = 110) AEIPF ratio PM2.5 concentrations AEIPF ratio PM2.5 concentrations AEIPF ratio PM2.5 concentrations AEIPF ratio PM2.5 concentrations AEIPF ratio PM2.5 concentrations Jan. 13.2 189.46 15.2 124.61 15.7 120.97 14.9 96.16 14.5 121.98 Feb. 10.5 88.22 13.0 116.38 11.8 115.86 11.6 66.62 7.3 72.55 Mar. 6.6 48.48 4.3 58.57 4.7 64.19 8.3 55.16 9.1 55.16 Apr. 3.9 44.81 5.1 49.80 2.4 53.03 3.3 39.97 4.5 63.85 May. 3.3 40.87 3.6 27.88 3.1 28.81 4.1 27.35 2.7 30.13 Jun. 3.3 42.85 2.9 29.70 3.9 35.00 1.7 24.32 3.6 23.81 Jul. 3.3 23.52 3.6 48.81 3.1 33.65 3.3 24.30 2.7 24.30 Aug. 10.5 33.39 9.4 28.59 11.0 24.26 12.4 23.15 8.2 15.72 Sep. 7.9 30.53 5.1 22.49 8.7 22.20 7.4 23.49 11.8 20.20 Oct. 3.9 142.16 8.7 157.83 4.7 56.71 3.3 43.78 7.3 92.22 Nov. 14.5 90.39 14.5 145.14 13.4 149.43 13.2 97.55 12.7 96.65 Dec. 19.1 155.14 14.5 98.80 17.3 145.06 16.5 91.31 15.5 73.34 OR 0.599 0.756 0.772 0.771 0.564 P values 0.039 0.005 0.003 0.003 0.056 Note. The unit of AEIPF rate is % and the unit of PM2.5 concentration is μg/m3. 
Figure S1. Correlation analysis of AEIPF hospitalization rate and PM2.5 concentration in different months of each year
To identify susceptible populations affected by atmospheric fine particulate matter, we further analyzed the clinical characteristics of 811 patients with AEIPF. The results showed that in the period of high atmospheric pollutant concentration (group A), female AEIPF inpatients accounted for 67.07% of the hospitalized patients, higher than the figure for male patients (P < 0.05). The hospitalization ratio of patients aged over 65 years during the same period was 59.23%, higher than that of the two other groups (P < 0.05). The inpatient ratio of the smoking group was 61.43%, higher than that of the non-smoking group (P < 0.05). The increased PM2.5 concentration has a greater impact on AEIPF patients who are female, over 65 years old, and smoking. The results are shown in Table 2.
Table 2. Comparison of clinical features among different groups
Patient characteristics Total number (%) Group A (%) Group B (%) Chi-square value F Sex Male 327 (40.32) 189 (32.93) 138 (58.23) 44.624 < 0.0001 Female 484 (59.68) 385 (67.07) 99 (41.77) Age (years) < 40 17 (2.10) 10 (1.74) 7 (2.95) 12.169 0.0005 40–65 345 (42.54) 224 (39.02) 121 (51.05) > 65 449 (55.36) 340 (59.23) 109 (45.99) Smoke Yes 424 (52.35) 352 (61.43) 72 (30.38) 64.803 < 0.0001 No 386 (47.65) 221 (38.57) 165 (69.62) We have consulted the literature on the effect of fine particulate matter on the human body, and found that the effect on women is relatively obvious[8], which is consistent with our research conclusion. However, the reasons for the occurrence need to be clarified. In terms of the influence of smoking, the reasons may be that long-term smoking destroys the defense function of the airway mucosa and directly causes damage on the airway mucosa epithelium, thereby increasing the sensitivity to the damage induced by particulate matter. Several reports indicate that under the effect of fine particles, the smoking population shows a more serious rate of lung function decline and inflammatory response than the non-smoking population[9-10]. This result confirms the reliability of our research conclusions.
The authors declare no conflict of interest.
We are grateful to MA Li Xin and SUN Xia Zhong, postgraduates at the State Key Laboratory of Urban Water Resources and Water Environment, for their assistance in gathering the air pollutant concentration data. We also thank Associate Professor WANG Yu Peng from the Department of Statistics, Harbin Medical University for the patient guidance in the data statistical analysis.
doi: 10.3967/bes2020.018
Retrospective Study of Effect of Fine Particulate Matter on Acute Exacerbation of Patients with Idiopathic Pulmonary Fibrosis
-
-
Table 1. Correlation analysis of annual hospitalization rate of AEIPF and concentration of various components of air pollutants from 2013 to 2017
Items 2013 2014 2015 2016 2017 OR value Rate of AEIPF inpatient (%) (n = 811) 18.740 17.020 15.660 14.920 13.560 PM10 (mg/m3) 0.119 0.111 0.103 0.074 0.085 0.862 SO2 (mg/m3) 0.044 0.057 0.040 0.029 0.025 0.761 PM2.5 (mg/m3) 0.081 0.072 0.070 0.051 0.057 0.886 CO (mg/m3) 1.029 0.890 1.800 2.000 1.056 –0.371 O3 (mg/m3) 0.038 0.042 0.106 0.106 0.059 –0.525 S1. Correlation analysis of AEIPF rate and PM2.5 concentration in different months of each year
Month 2013 (n = 152) 2014 (n = 138) 2015 (n = 127) 2016 (n = 121) 2017 (n = 110) AEIPF ratio PM2.5 concentrations AEIPF ratio PM2.5 concentrations AEIPF ratio PM2.5 concentrations AEIPF ratio PM2.5 concentrations AEIPF ratio PM2.5 concentrations Jan. 13.2 189.46 15.2 124.61 15.7 120.97 14.9 96.16 14.5 121.98 Feb. 10.5 88.22 13.0 116.38 11.8 115.86 11.6 66.62 7.3 72.55 Mar. 6.6 48.48 4.3 58.57 4.7 64.19 8.3 55.16 9.1 55.16 Apr. 3.9 44.81 5.1 49.80 2.4 53.03 3.3 39.97 4.5 63.85 May. 3.3 40.87 3.6 27.88 3.1 28.81 4.1 27.35 2.7 30.13 Jun. 3.3 42.85 2.9 29.70 3.9 35.00 1.7 24.32 3.6 23.81 Jul. 3.3 23.52 3.6 48.81 3.1 33.65 3.3 24.30 2.7 24.30 Aug. 10.5 33.39 9.4 28.59 11.0 24.26 12.4 23.15 8.2 15.72 Sep. 7.9 30.53 5.1 22.49 8.7 22.20 7.4 23.49 11.8 20.20 Oct. 3.9 142.16 8.7 157.83 4.7 56.71 3.3 43.78 7.3 92.22 Nov. 14.5 90.39 14.5 145.14 13.4 149.43 13.2 97.55 12.7 96.65 Dec. 19.1 155.14 14.5 98.80 17.3 145.06 16.5 91.31 15.5 73.34 OR 0.599 0.756 0.772 0.771 0.564 P values 0.039 0.005 0.003 0.003 0.056 Note. The unit of AEIPF rate is % and the unit of PM2.5 concentration is μg/m3. Table 2. Comparison of clinical features among different groups
Patient characteristics Total number (%) Group A (%) Group B (%) Chi-square value F Sex Male 327 (40.32) 189 (32.93) 138 (58.23) 44.624 < 0.0001 Female 484 (59.68) 385 (67.07) 99 (41.77) Age (years) < 40 17 (2.10) 10 (1.74) 7 (2.95) 12.169 0.0005 40–65 345 (42.54) 224 (39.02) 121 (51.05) > 65 449 (55.36) 340 (59.23) 109 (45.99) Smoke Yes 424 (52.35) 352 (61.43) 72 (30.38) 64.803 < 0.0001 No 386 (47.65) 221 (38.57) 165 (69.62) -
[1] Zhu L, Ge X, Chen Y, et al. Short-term effects of am-bient air pollution and childhood lower respiratory disea-ses. Sci Rep, 2017; 7, 4414. doi: 10.1038/s41598-017-04310-7 [2] Li P, Xin J, Wang Y, et al. Association between particulate matter and its chemical constituents of urban air pollution and daily mortality or morbidity in Beijing city. Environ Sci Pollut ResInt, 2015; 22, 358−68. doi: 10.1007/s11356-014-3301-1 [3] Watanabe M, Noma H, Kurai J, et al. A panel study of airborne particulate matter composition versus concentra-tion: Potential for inflammatory response and impaired pulmonary function in children. Allergol Int, 2017; 66, 52−8. doi: 10.1016/j.alit.2016.04.014 [4] Falcon-Rodriguez CI, Osornio-Vargas AR, Sada-Ovalle I, et al. Aeroparticles, composition, and lung diseases. Front Immunol, 2016; 7, 3. [5] Raghu G, Collard HR, Egan JJ, et al. An official ATS/ERS/JRS/ALAT statement: idiopathic pulmonary fibrosis: evidence-based guidelines for diagnosis and management. Am J Respir Crit Care Med, 2011; 183, 788−824. doi: 10.1164/rccm.2009-040GL [6] Collard HR, Ryerson CJ, Corte TJ, et al. Acute exacerbation of idiopathic pulmonary fibrosis. An international working group report. Am J Respir Crit Care Med, 2016; 194, 265−75. doi: 10.1164/rccm.201604-0801CI [7] Jia LL, Chen YX, Cui C, et al. Analysis of element characteristics and enrichment factors in PM2.5 and PM10 during severe haze period in a city in northeast China. Environ Protect Sci, 2015; 60−4. (In Chinese) [8] Cao Yu, Liu Hui, Zhang Jun, et al. Effect of particulate air pollution on hospital admissions for acute exacerbation of chronic obstructive pulmonary disease in Beijing. J Peking University (Health Sci), 2017; 49, 403−8. [9] Wang BY, Xiao D, Wang C. Smoking and chronic obstructive pulmonary disease in Chinese population:a meta-analysis. Clin Respir J, 2015; 9, 165−75. doi: 10.1111/crj.12118 [10] Allinson JP, Hardy R, Donaldson GC, et al. Combined impact of smoking and early-life exposures on adult lung function trajectories. Am J Respir Crit Care Med, 2017; 196, 1021−30. doi: 10.1164/rccm.201703-0506OC -


 下载:
下载:


 Quick Links