

 下载:
下载:

-
Organized into a four-level national–provincial–municipal–county system, the Centers for Disease Control and Prevention (CDC) is a key player in China's public health disease prevention and health promotion[1]. Questions regarding the quantity and quality of the CDC workforce have raised concerns regarding the efficiency and effectiveness of China’s disease prevention and control[2]. Reformed in 2021, China’s National Disease Control and Prevention Administration established a series of regulations on the CDC’s functional organization and staffing, with human resource management as a critical element in the CDC’s redevelopment[2]. In 2023, the government issued further guidance[3] to improve the quality and level of the CDC workforce, promote workforce motivation, and stimulate higher levels of work performance as strategic priorities in the CDC workforce building[4].
Previous studies on the CDC workforce indicated that the total number of CDC staff was insufficient, failing to meet the relevant staffing standards[5,6]. A high rate of labor turnover, particularly in terms of professional and technical staff, was identified as a major challenge in achieving CDC staffing quantity and quality standards[7]. According to the China Health Statistics Yearbook, the CDC staff fell by 9.16% from 2005 to 2019 before increasing by 11.72% in 2021. Based on China’s CDC staffing standards of 1.75 CDC staff per 10,000 people, the total number of CDC staff in 2021 met only 85.72% of the standard. Faced with a brain drain crisis, the CDC must stabilize its existing workforce and attract more workers. Some studies have also recognized income, location, and bianzhi (China’s institutionalized lifelong employment system within the public sector, which is characterized by state-guaranteed permanence and comprehensive state-funded welfare provisions, including healthcare, pensions, and housing subsidies[7,8]) as the main considerations influencing the employment choices of public health doctors[7]. A 2013 Shandong Province study analyzing the job preferences of 157 county-level CDC workers identified basic benefits as the key attribute in retaining and attracting staff[9]. Another study on 455 Shandong Province municipal-level CDC workers identified bianzhi, followed by income, as a key factor in workforce planning[3]. Other studies demonstrated that CDC staff turnover was related to declining income, high job risk, mismatched workload and salary, and poor promotion paths[10-12].
During the reform of China's disease prevention and control cause in recent years, there has been a lack of large-sample studies with broad national representation to guide the CDC’s human resource management policies. However, there is an urgent need to adjust and optimize the current CDC workforce management system, establish a high-quality CDC workforce, retain staff, and promote innovation to develop China’s disease prevention and control systems.[3] Uniquely, this study conducted a representative national sample survey to address three key questions: What job attributes and levels do CDC staff value? What is the magnitude of the effect of different levels of job attributes on job preferences? Is there heterogeneity in job choice preferences? By answering these three key questions, we assessed job preferences under different policy conditions, revealed the differences in preferences among different populations, and provided a reference for CDC’s retention policies and recruitment strategies.
-
A combination of systematic and convenience sampling was used to study bianzhi and general contract staff at the CDC. To ensure a nationally representative sample, we based the sampling principles on the level of economic development (per capita Gross Domestic Product and per capita health expenditure of each province) and geographic location characteristics (China’s three-tiered topographic division into eastern, central, and western regions) across nine provinces: three high economic level eastern region provinces (Shandong, Jiangsu, and Zhejiang); three medium economic level central region provinces (Henan, Hubei, and Jiangxi); and three low economic level western region provinces (Sichuan, Yunnan, and Guizhou). Within each province, three cities and counties were sampled. To account for varying staff numbers across different administrative levels of the CDC, at least 80 cases (per province), 50 cases (per city), and 30 cases (per county) were randomly selected, yielding 117 CDCs, comprising 9 at the provincial level, 27 at the city level, and 81 at the county level. Employees who were on leave during the survey period or unwilling to participate were excluded.
-
To measure preferences for different interventions, programs, and policies, we conducted a DCE[13-15], which is an effective and reliable method used in the health field.[16,17] Specifically, our DCE assessed the job preferences of CDC staff by forming simulation scenarios with differential utility through different cross-combinations of attributes[7,18]. The minimum DCE sample size (N) was determined using the formula N > 500c/(t×a)[19], where c refers to the maximum number of levels for all attributes, t refers to the number of DCE option tasks in the questionnaire, and a refers to the number of options. Based on this rule, the minimum sample size was calculated to be 125, and our sample size met this requirement.
-
Attributes and levels are essential elements constituting a DCE choice scenario. Based on a literature review, we first compiled a list of 15 attributes related to the CDC’s job scenarios: income, welfare benefits, work resources, interpersonal relationships, bianzhi, workload, acceptance and respect from the public, opportunities for career development, institutional reform direction, organizational positioning, job category, work stress, living facilities, management systems, and job skill training. Subsequently, we consulted health workforce research experts, CDC administrators, and CDC staff and then combined literature review attributes, expert consultation forms, and seminars to identify the seven highest-ranked attributes: income, welfare benefits, bianzhi, workload, public acceptance and respect, opportunities for career development, and job skill training. The conceptual definitions and attribute levels are listed in Supplementary Table S1.
-
When a full factorial DCE design is used[17,20], the inclusion of all attributes and their levels will generate 1,458 ( = 36 × 2) hypothetical scenarios, which are cross-combined to give 1,062,153 [ = (1,458 × 1,457) / 2] groups. To reduce the difficulty of the questionnaire and the burden on the respondents, we implemented a D-efficient design[13] using SAS software version 9.2 to minimize inefficient overlaps between attribute levels[3,20]. Finally, 18 choice sets were generated and divided into three versions, each of which included six choice sets and two simulated work scenarios. Supplementary Table S2 presents an example of a choice set. The questionnaire collected self-reported data on the respondents' age, sex, education, job title, marital status, years of employment, monthly income, region, and location. To strengthen the quality of the questionnaire, we added one consistency test question to each version, and samples that failed to answer this question were excluded. Before finalizing the final version of the questionnaire, we conducted a pilot study to adjust its wording and layout. We released an electronic questionnaire to the sampled organizations through an online questionnaire application platform (wjx.com). Each version included an informed consent form and instructions for completion. During the investigation period, weekly communication and feedback on the quality of recycling and other major issues were conducted with the investigation coordinators from each province. Trained researchers followed the anonymous collection of questionnaires throughout the process and provided online and telephone advice to address respondents' questions or concerns. The questionnaire survey was conducted from July to August 2022 and March to April 2024.
-
The theoretical basis for DCE is the random utility theory, in which respondents, when faced with a choice of options, make decisions according to the principle of utility maximization[21,22]. Selecting the appropriate number of classes is a critical step in model construction. Information criteria such as the Akaike information criterion (AIC) and Bayesian information criterion (BIC) are commonly used statistical tools for balancing model goodness of fit and complexity, thereby identifying the optimal number of classes. Under the premise of model fitting, the category number with the smallest AIC or BIC value was prioritized. Additionally, because the BIC imposes a stronger penalty on model complexity than the AIC (particularly with larger sample sizes), greater emphasis should be placed on BIC. Based on the BIC and AIC, a mixed logit model and a latent class model were used to estimate the job preferences of CDC workers. Individual utility was estimated using a mixed logit model, as follows:
$$ \begin{aligned} {U}_{ijt}=& {\beta }_{1n}{Income}_{njt}+{\beta }_{2n}{Welfare}_{njt}+{\beta }_{3n}{Bianzhi}_{njt}+\\ & {\beta }_{4n}{Workload}_{njt}+{\beta }_{5n}{Respect}_{njt}+\\ &{\beta }_{6n}{Opportunitie}_{njt}+ {\beta }_{7n}{Training}_{njt}+{\epsilon }_{njt} \end{aligned} $$ (1) where U is the utility (U) that participant i derives for scenario j in the choice set s and ɛ is the participant-specific random error. Latent class analysis (LCA) was conducted to explore the preference heterogeneity among individuals classified into mutually exclusive groups[20,23]:
$$ {U}_{njt}={\beta }_{q}^{\text{'}}{X}_{njt}+{\epsilon }_{njt} $$ (2) where βq is a class‐specific parameter vector and the other variables have the same meaning as in Equation 1. In addition, demographic characteristics were compared for differences between categories using the chi-square and Mann-Whitney tests. We also calculated the relative importance ($ RI=\beta_{tmax}/{\Sigma }_{1}^{m}{\beta }_{mmax} $) of each attribute. The RI evaluates the significance of a specific attribute compared to all other attributes included in the study, where the RI score for attribute *t* is defined as the ratio of the maximum regression coefficient for attribute *t* to the sum of the maximum regression coefficients across all attributes. Specifically, a higher proportion of an attribute indicates that the respondents place greater importance on it when making job choices. Finally, the uptake rate–a post-assessment tool for predictive analyses of how the probability of uptake varies with attributes–was measured using a policy simulation. The criterion for statistical significance was a P-value of < 0.05. The survey data were cleaned and coded using Microsoft Excel version 2016. Statistical analyses were performed using Stata MP version 17.0 with the mixlogit and lclogit2 programs[16].
-
We investigated 7071 responses from 117 CDCs in nine provinces and achieved a response rate of 100%. After consistency testing and data cleaning, 5944 valid responses were included in the analysis, with an effective response rate of 84.06%. The median age of the respondents was 38 years, and the median length of service was 14 years. Of the respondents, 63% were female, 52.27% had intermediate and higher titles, 15.48% held administrative positions, 57.67% had undergraduate degrees, and 61.29% had experience in public health education. The median monthly income was RMB 6,000, with 23.22% of respondents having a monthly income of RMB 8,000 or higher.
-
The results of the mixed-logit model are presented in Table 1. All attributes had a significant effect on the respondents' job choice preferences; however, there were slight differences in distribution at different levels. Respondents favor jobs with higher income (β: 0.094, odds ratio [OR]: 1.098); and had a higher preference for jobs with higher levels of benefits (β: 1.201, OR: 3.324) and average levels of benefits (β: 0.555, OR: 1.742). In Table 1, respondents preferred bianzhi jobs (β: 2.700, OR: 14.881); jobs with lighter workloads (β: 0.763, OR: 2.144) over jobs with heavier workloads; and jobs with higher public respect (β: 0.475, OR: 1.608) and jobs with average public respect (β: 0.199, OR: 1.220) over jobs with low public respect. Respondents preferred jobs with abundant development opportunities (β: 0.929, OR: 2.533) and some development opportunities (β: 0.160, OR: 1.173) over jobs with inadequate development opportunities, and jobs with abundant training opportunities (β: 0.361, OR: 1.434) and some training opportunities (β: 0.668, OR: 1.950) over jobs with inadequate training.
Table 1. Estimation results of mixed logit model
Attribute levels β OR SE 95% CI SD Income (by 1%) 0.094*** 1.098 0.004 1.090–1.106 0.067*** Welfare (ref: low) high 1.201*** 3.324 0.057 2.972–3.718 0.900*** general 0.555*** 1.742 0.040 1.612–1.883 0.019 Bianzhi (ref: no) yes 2.700*** 14.881 0.104 12.137–18.246 2.140*** Workload (ref: heavy) light 0.763*** 2.144 0.057 1.918–2.396 1.402*** medium −0.040 0.961 0.040 0.888–1.040 0.035 Respect (ref: low) high 0.475*** 1.608 0.049 1.460–1.771 0.540** general 0.199*** 1.220 0.039 1.130–1.317 0.574*** Opportunity (ref: insufficient) sufficient 0.929*** 2.533 0.052 2.288–2.804 1.205*** some 0.160*** 1.173 0.037 1.092–1.261 0.306 Training (ref: insufficient) sufficient 0.361*** 1.434 0.037 1.334–1.542 0.206 some 0.668*** 1.950 0.049 1.771–2.148 0.884*** Log-likelihood −16,961.131 AIC 33,970.26 BIC 34,190.46 Note. ***P < 0.001 **P < 0.01 *P < 0.05. OR, odds ratio; SE, standard error; CI, confidence interval; SD, standard deviation; RI, relative importance; AIC, akaike information criterion; BIC, bayesian information criterion. The SDs of the coefficients showed significant heterogeneity in terms of income, benefits (high), establishment, workload (heavy), respect (high, average), opportunities (abundant), and training (some).
-
Table 2 presents the outcomes for the Class 1 and Class 2 LCA models based on the AIC and BIC of each model. Class 1 respondents had statistically significant job choice preferences for each of the seven levels included in the study. Class 2 respondents had statistically insignificant job choice preferences at the general welfare level (ref: low) and rich opportunities for advancement (ref: insufficient). Class 2 respondents (β: -0.125, OR: 0.806) had the opposite job preference to Class 1 respondents (β: 0.495, OR: 1.641), in which the workload was at the medium (ref: heavy) level. Conditional on development opportunities being some level, Class 1 respondents (β: 0.208, OR: 1.231) showed positive preferences, whereas Class 2 respondents (β: 0.317, OR: 0.728) exhibited the opposite. The different preferences of the two groups suggest the need to consider differentiation policies when developing work incentive systems.
Table 2. Estimation results of the LCA model
Attribute levels Class 1 (n1 = 3,417, 57.49%) Class 2 (n2 = 2,527, 42.51%) β OR 95% CI β OR 95% CI Income (by 1%) 0.065*** 1.067 0.062 to 0.067 0.026*** 1.026 0.02 to 0.032 Welfare (ref: low) high 0.803*** 2.232 0.745 to 0.861 0.917*** 2.502 0.776 to 1.058 general 0.497*** 1.643 0.433 to 0.561 0.136 1.145 −0.016 to 0.287 Bianzhi (ref: no) yes 0.566*** 1.762 0.513 to 0.619 2.832*** 16.985 2.674 to 2.991 Workload (ref: heavy) light 0.548*** 1.731 0.482 to 0.615 0.533*** 1.704 0.357 to 0.708 medium −0.215*** 0.806 −0.28 to −0.15 0.495*** 1.641 0.324 to 0.667 Respect (ref: low) high 0.424*** 1.528 0.356 to 0.493 0.329*** 1.389 0.218 to 0.44 general 0.098** 1.103 0.041 to 0.155 0.547*** 1.728 0.371 to 0.724 Opportunity (ref: insufficient) sufficient 0.853*** 2.348 0.787 to 0.92 −0.075 0.927 −0.222 to 0.072 some 0.208*** 1.231 0.145 to 0.27 −0.317*** 0.728 −0.451 to −0.184 Training (ref: insufficient) sufficient 0.269*** 1.309 0.212 to 0.327 0.146* 1.157 0.028 to 0.263 some 0.093** 1.097 0.024 to 0.162 0.594*** 1.812 0.448 to 0.741 Log-likelihood AIC BIC -
Supplementary Table S3 summarizes the basic characteristics of the two groups based on the LCA model. Class 1 had more respondents (n1 = 3417, 57.49%) than Class 2 (n2 = 2,527, 42.51%). The demographic characteristics of the two groups significantly differed with respect to bianzhi, marital status, job title, educational qualifications, experience in public health education, length of service, monthly income, and location of the organization. Class 1 had a higher percentage of respondents with master’s degrees or above (24.29%) than Class 2 (20.85%). Furthermore, the percentage of respondents with experience in public health education was higher in Class 1 (63.94%) than in Class 2 (57.70%). In terms of the distribution proportion of working-age groups, Class 1 respondents had a shorter working age, and the proportion of subgroups with a working age ≤5 years was higher in Class 1 (25.46%) than in Class 2 (21.13%). Regarding the inter-group distribution of monthly income, the proportion of respondents in the sub-group with ≤RMB 5000 was higher in Class 1 (42.61%) than in Class 2 (35.06%). In terms of unit-level distribution, the proportion of respondents working in county-level units was higher in Class 1 (39.01%) than in Class 2 (35.89%).
-
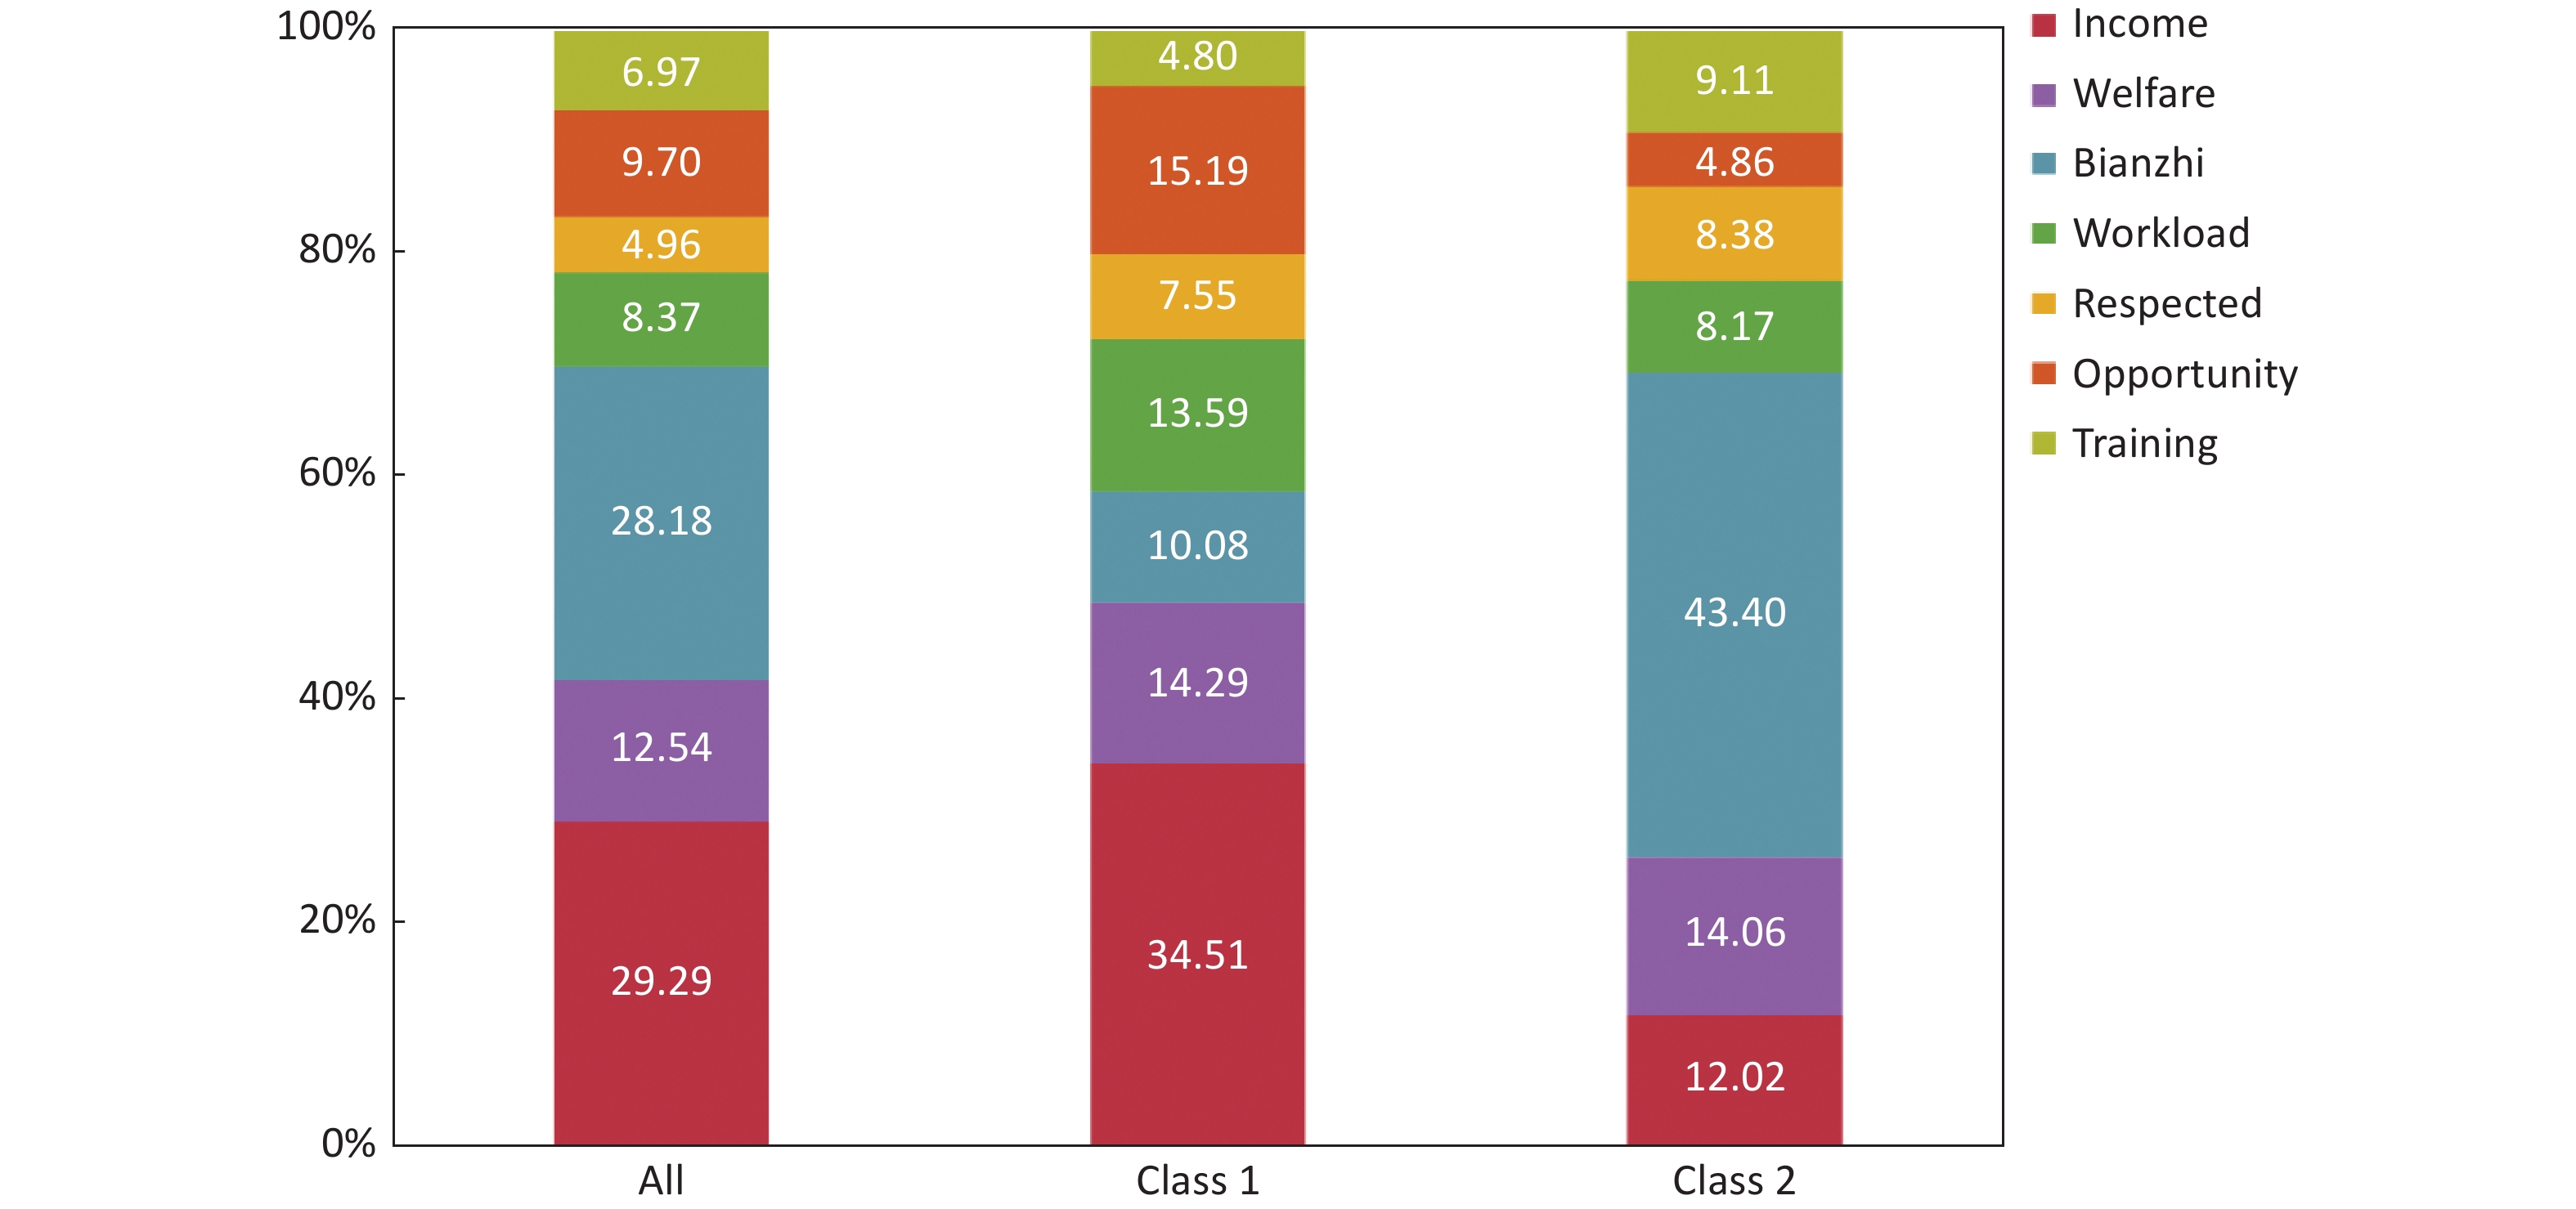
The RI respondents placed on different attributes showed that income (29.29%) and bianzhi (28.18%) were the two most highly valued, followed by welfare (12.54%) (Figure 1). After analyzing the latent class, respondents in the two classes exhibited different preference characteristics, and both had preference characteristics that differed from those of the total sample. Class 1 respondents (income-prioritizers) valued the attribute of income (34.51%), followed by three attributes of similar importance—namely, opportunities for personal development (15.19%), benefits (14.29%), and workload (13.59%), with training being the least valued attribute (4.80%). Class 2 respondents (bianzhi-prioritizers) placed extra importance on the attributes of bianzhi (43.40%), followed by benefits (14.06%) and income (12.02%), with opportunities for personal development being the least valued attribute (4.86%).
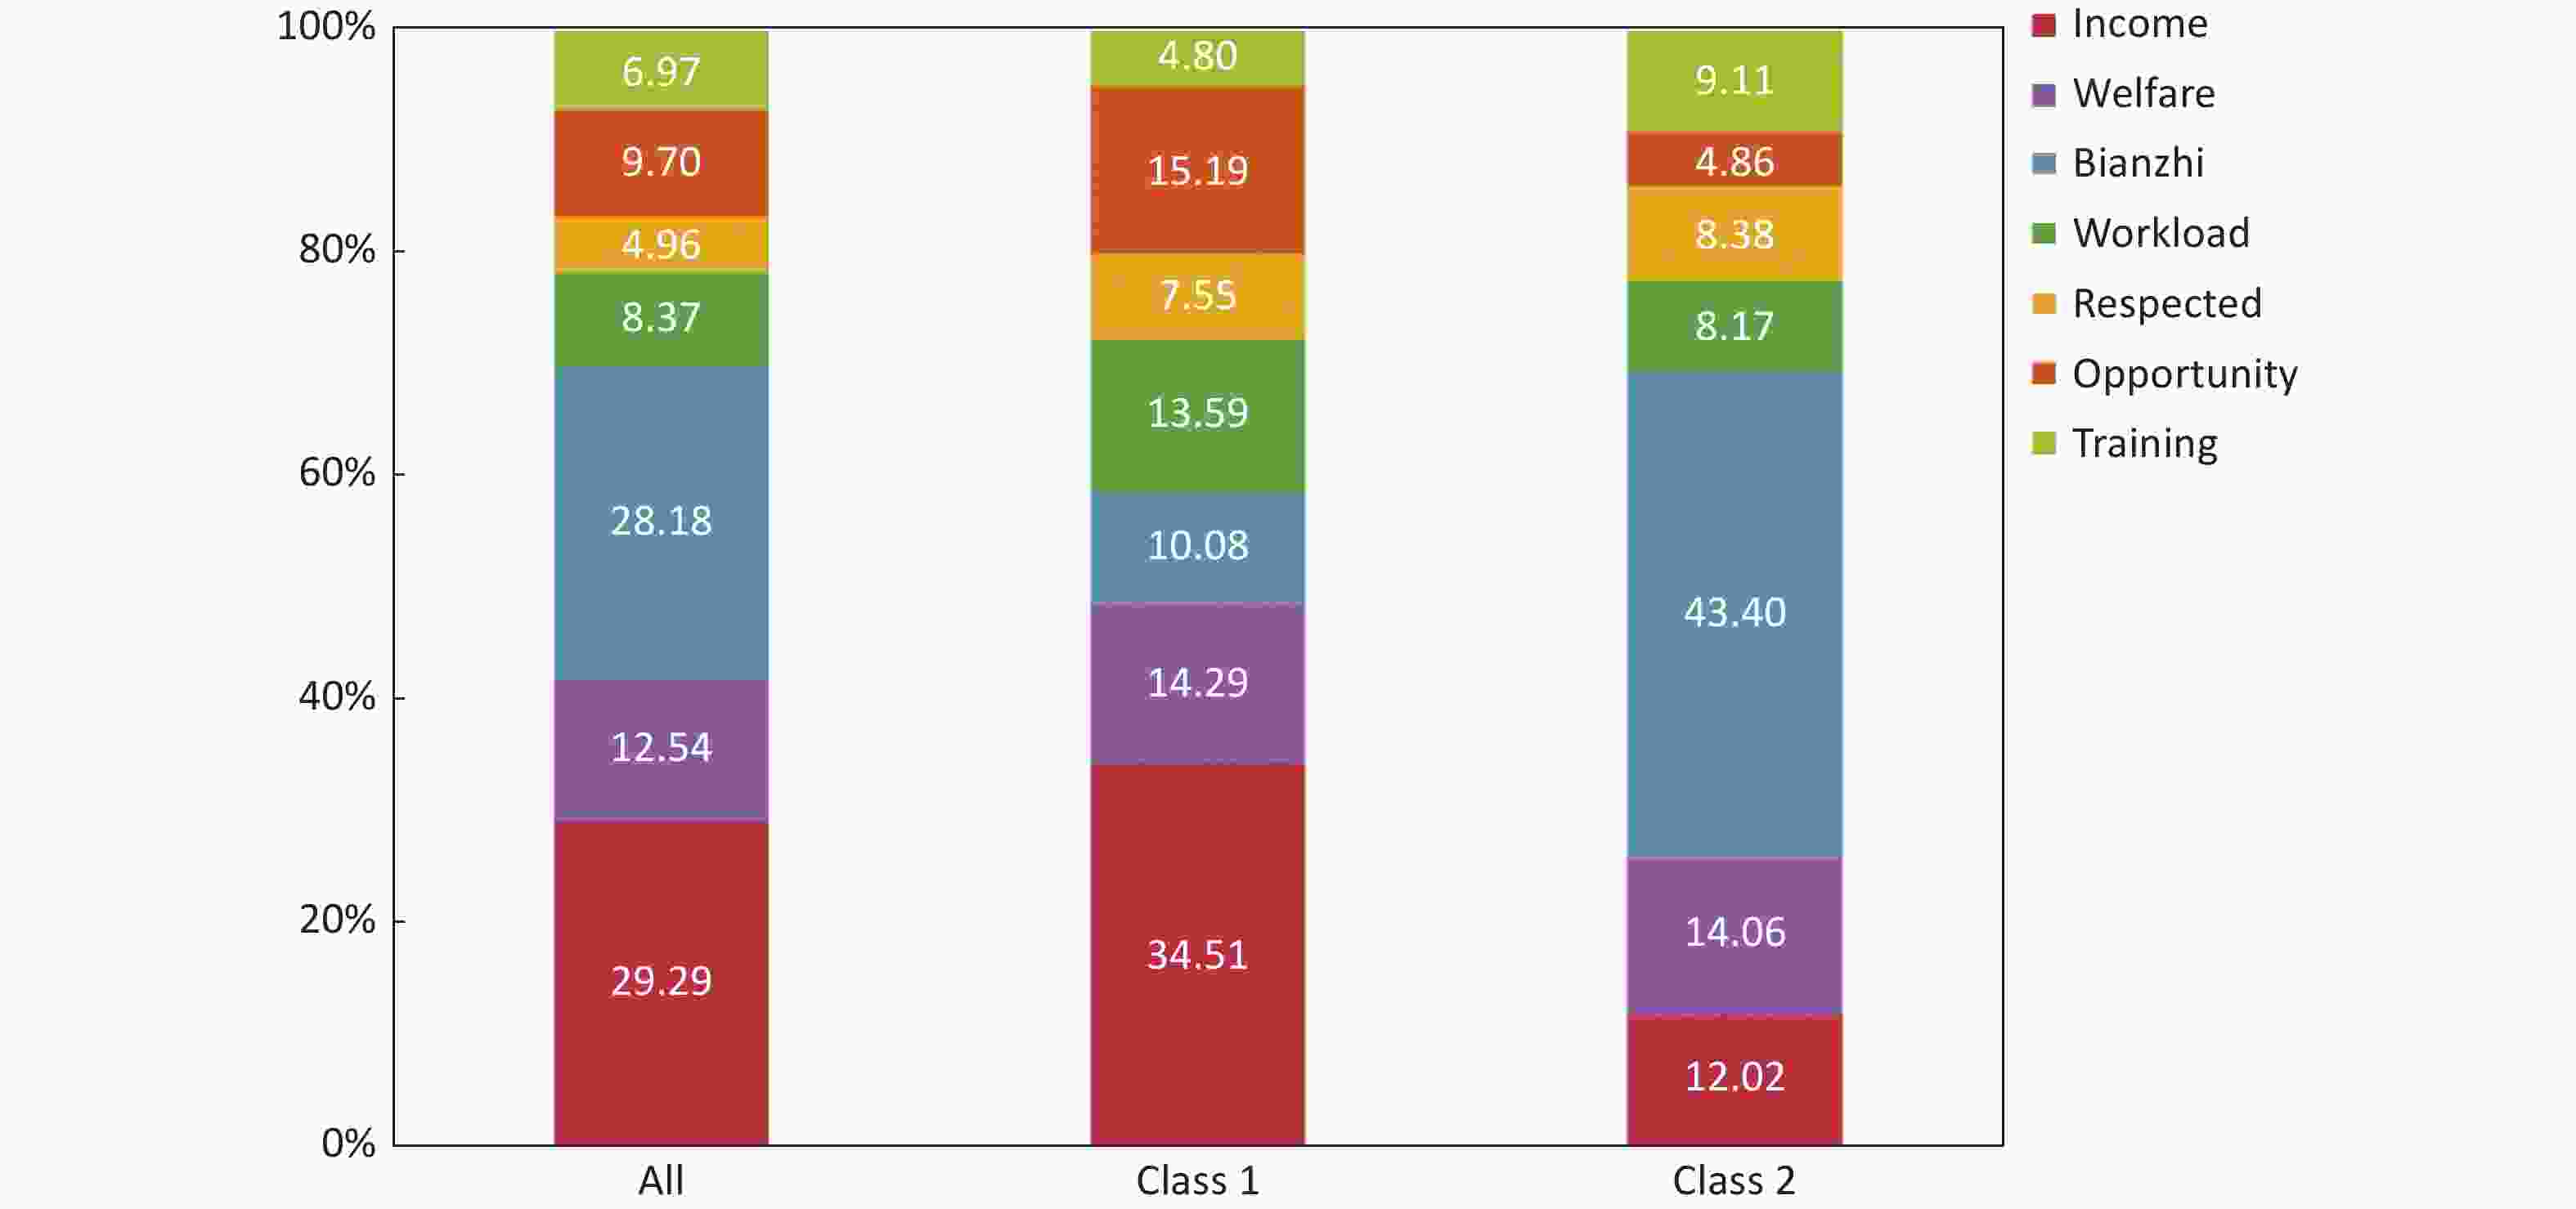
Figure 1. RI by class.
-
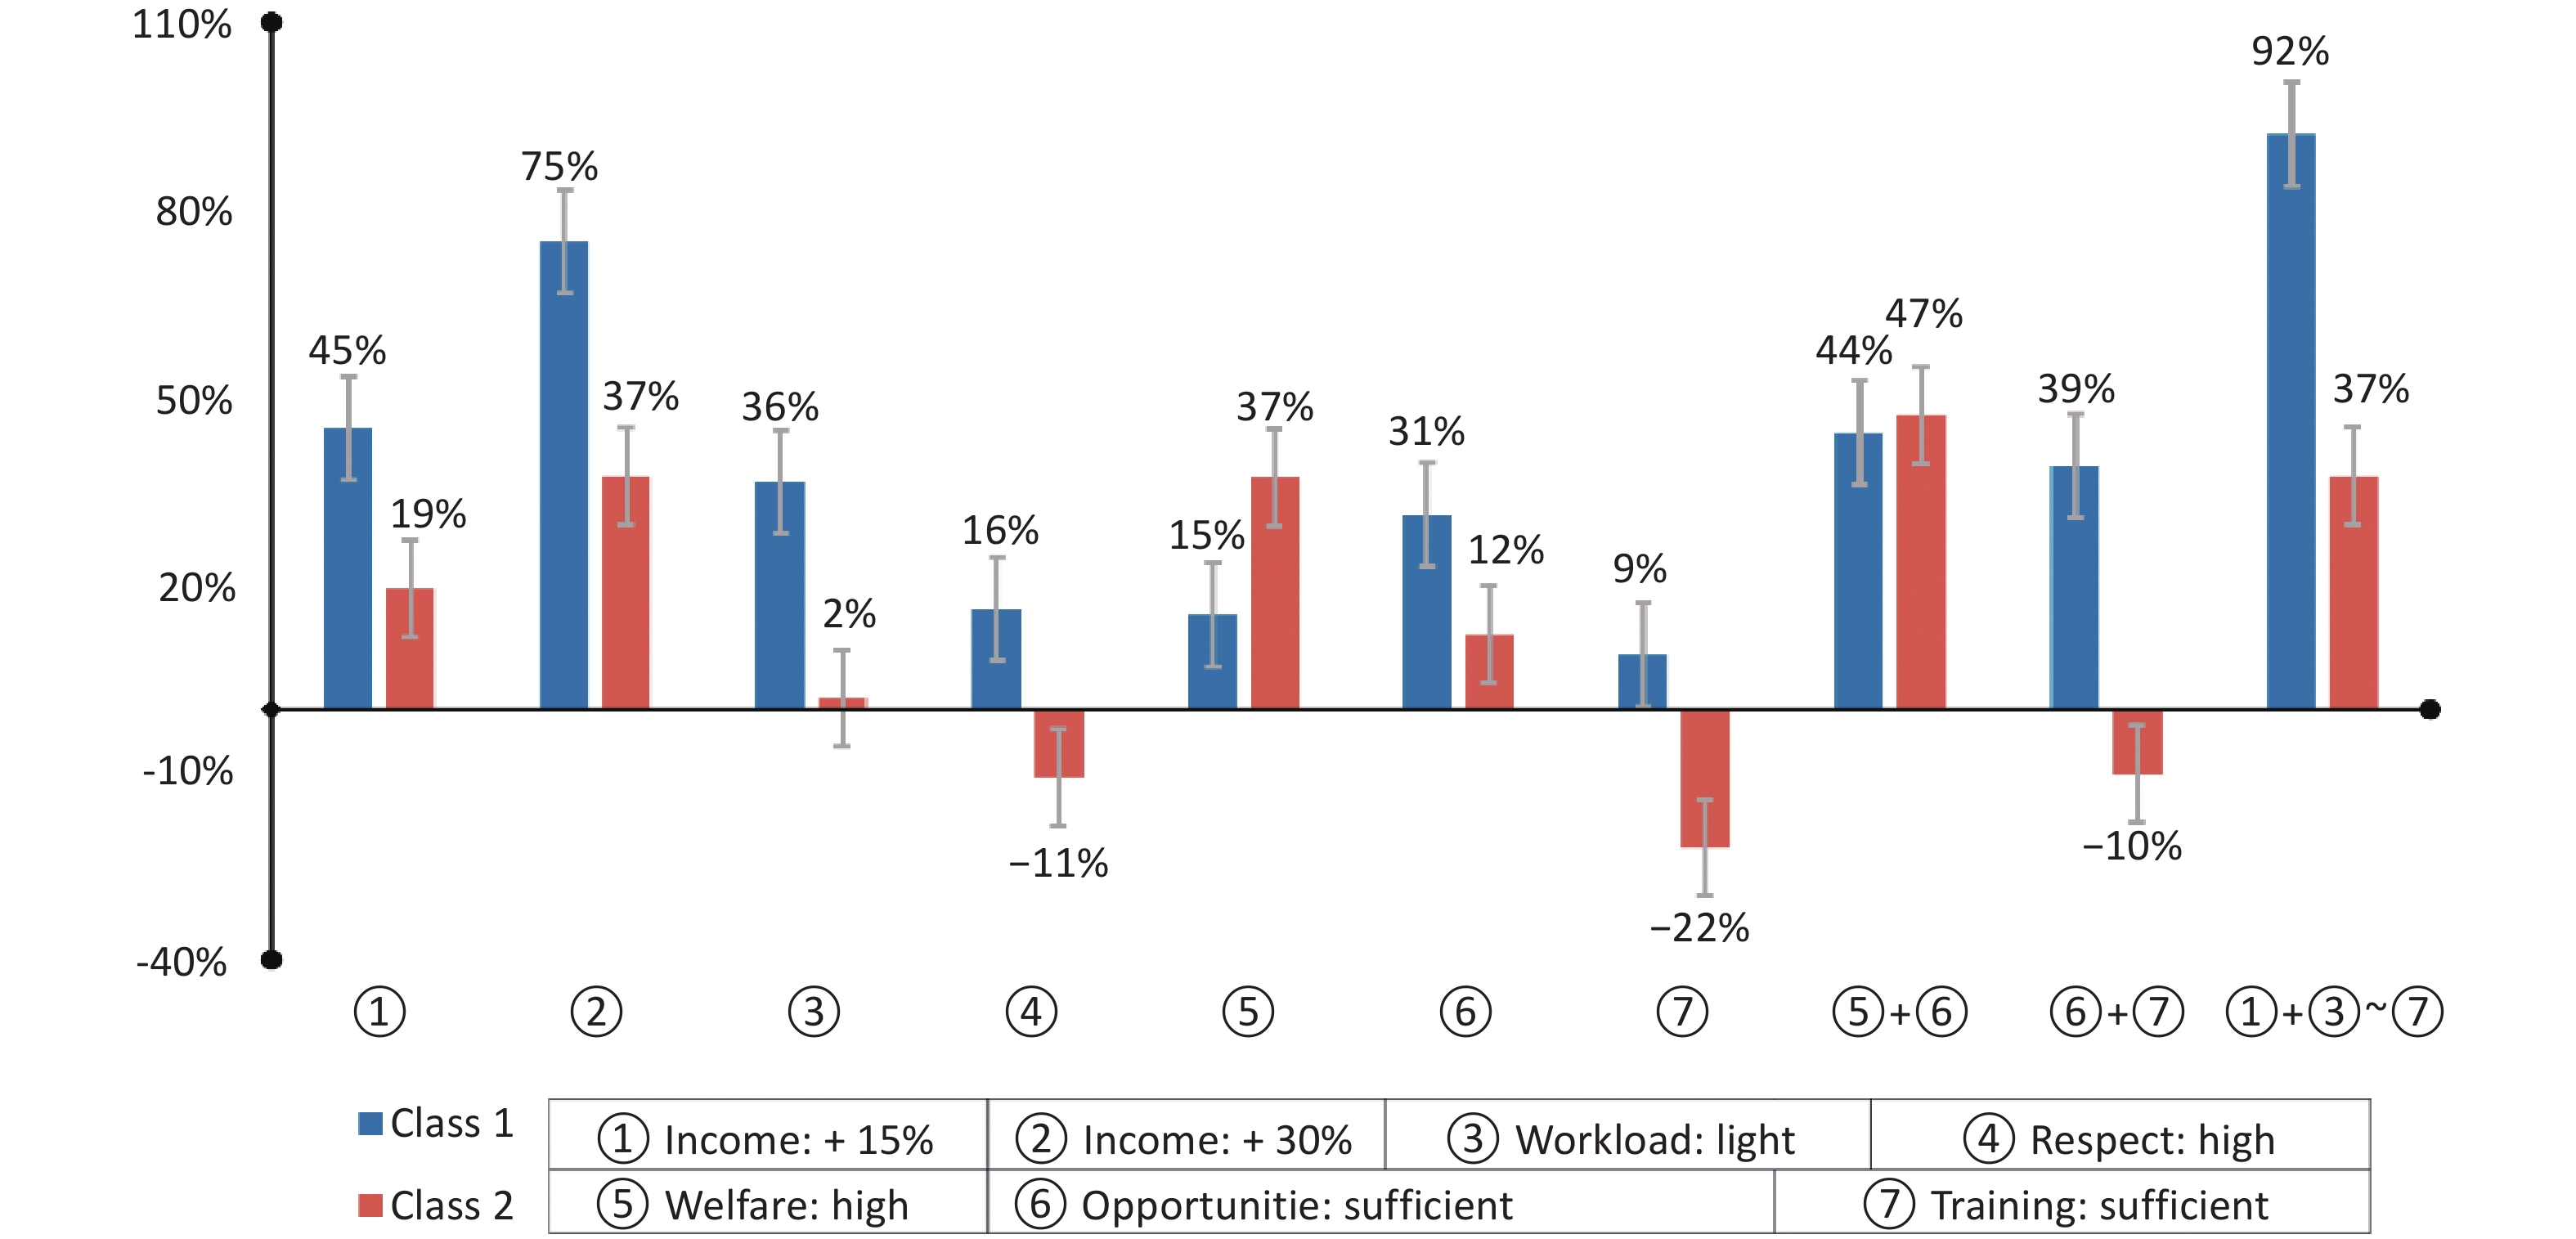
Based on the LCA model, possible changes in respondents’ job choices under different policy scenarios were projected (Figure 2). For the “yes” bianzhi level, we performed simulations for the remaining six job management attributes. When staff income increased by 30%, Category 1 respondents exhibited a 75% higher probability of choosing a CDC job. The change in the probability of choosing a job among Class 1 respondents was similar under two scenarios: a 15% increase in income (45%), increasing the benefits to a high level, and increasing development opportunities to an abundance (44%). Class 2 respondents did not show a similar preference; this overall positive job scenario was consistent with the uptake impact that a 30% improvement in income or a high level of benefits would have on Class 2 respondents (both 37%). When only training opportunities were changed to the enrichment level, Class 2 respondents were 22% less likely to choose that job. In the simulated scenario, when both attributes were improved (i.e., an improvement in benefits to a high level and an increase in development opportunities to an enriched level), the highest positive impact on the probability of Class 2 respondents choosing a job was 47%.
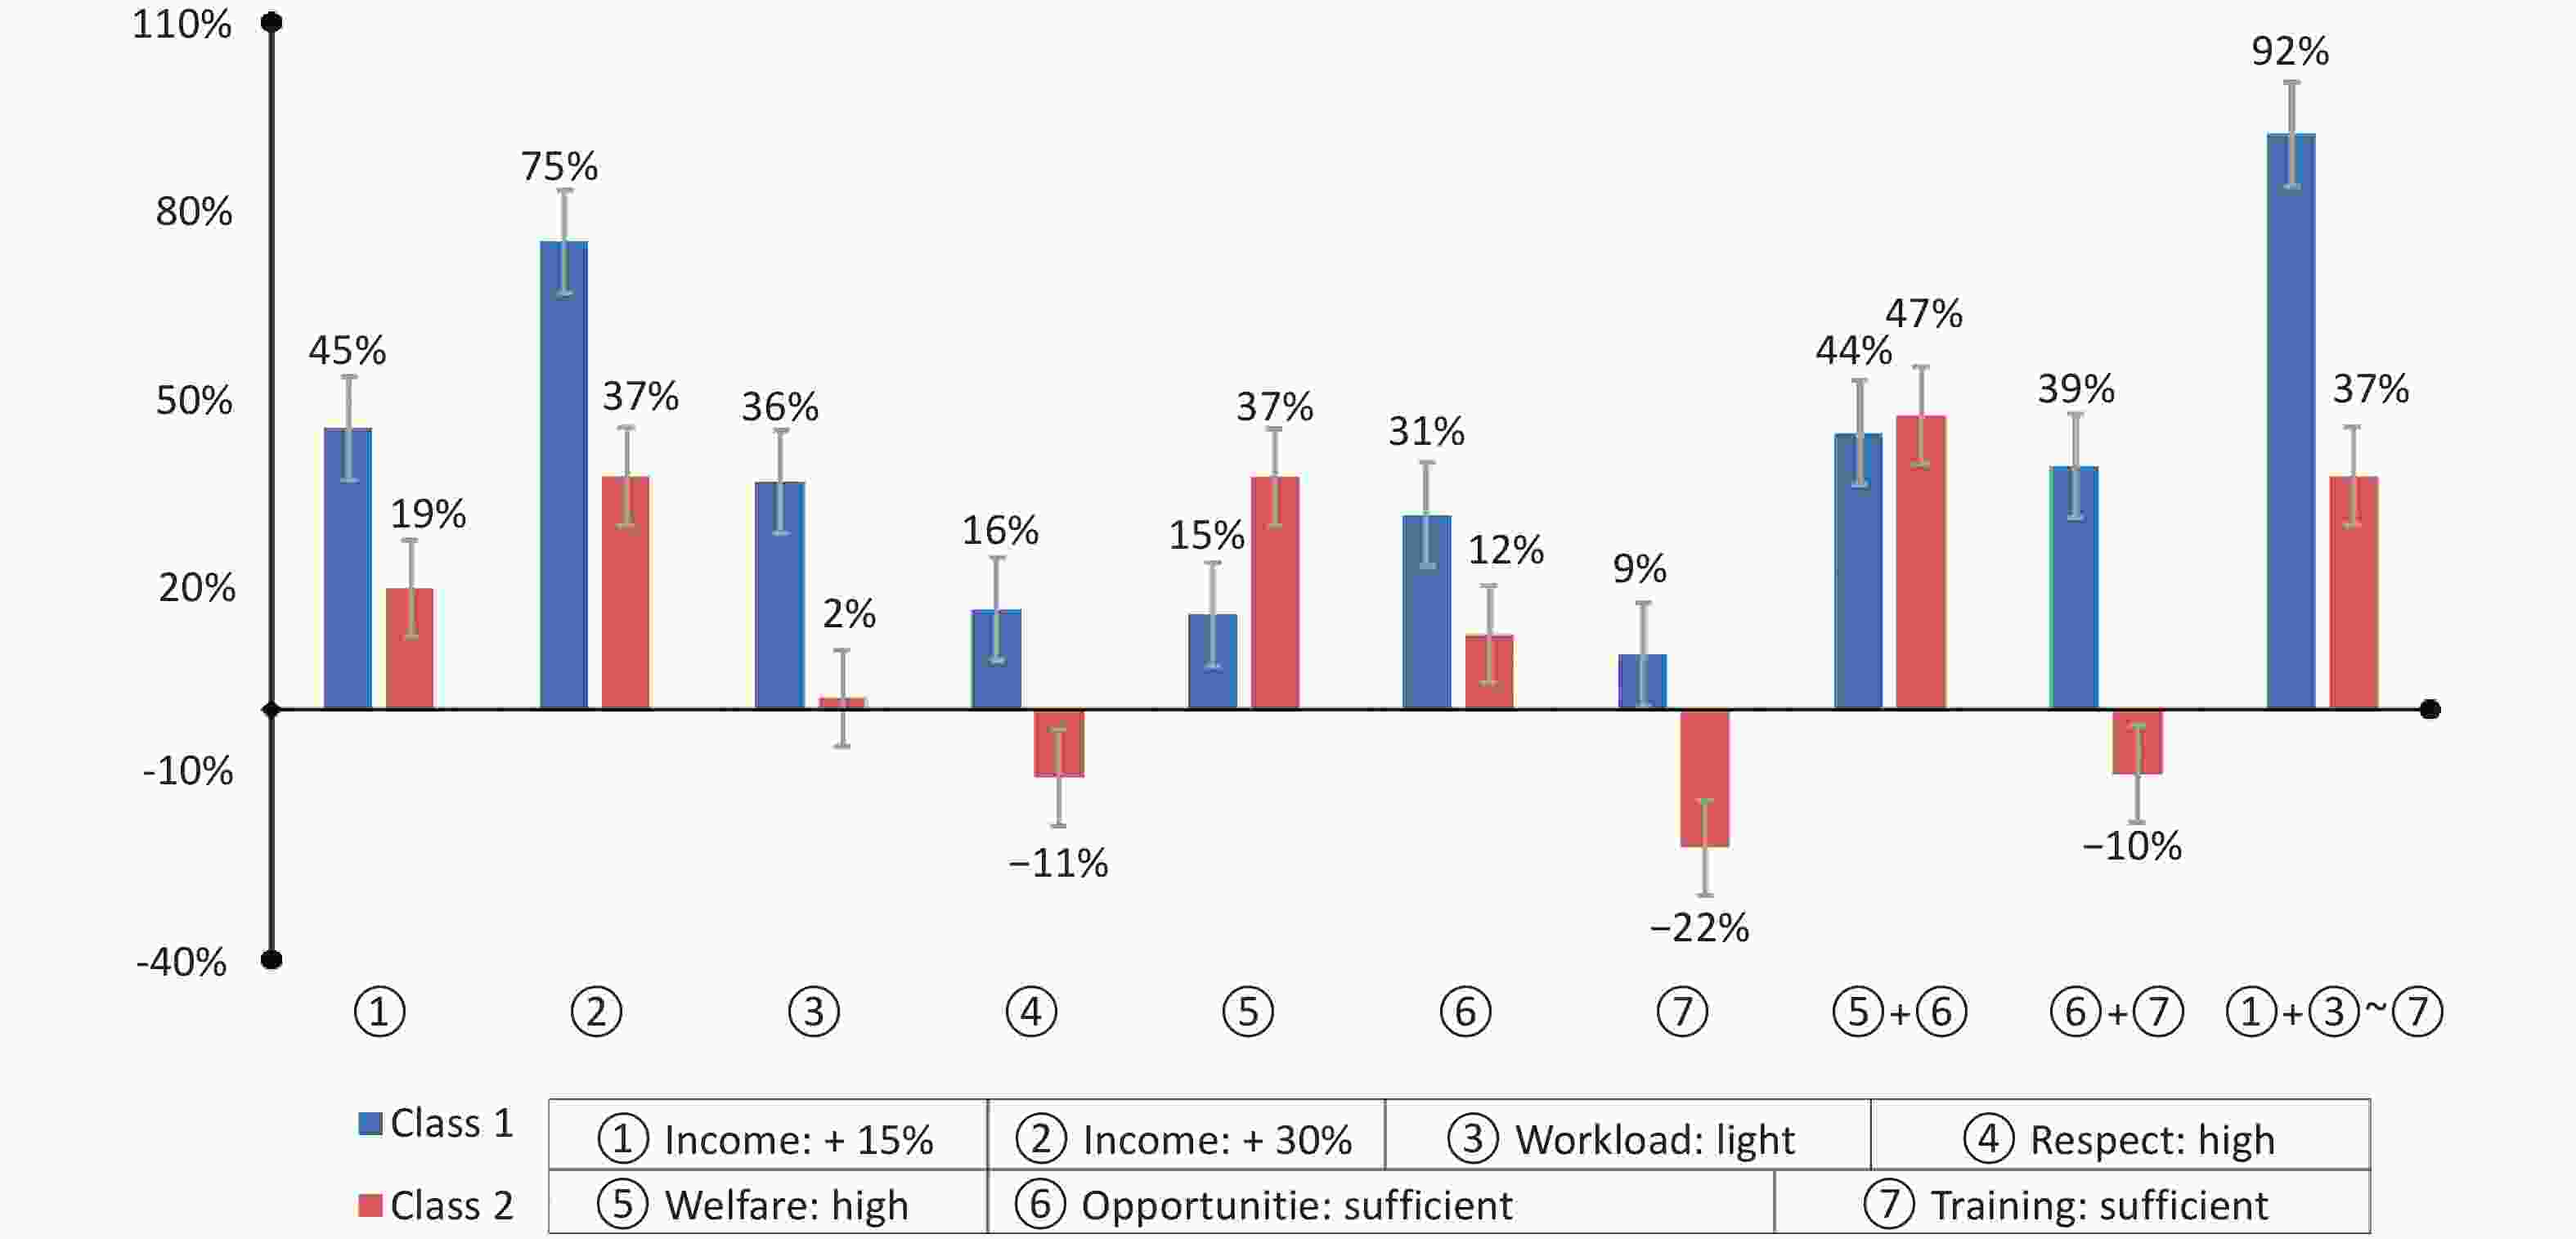
Figure 2. Incremental uptake rate under different policy simulation scenarios by class. Baseline: income (current unchanged), welfare (general), bianzhi (yes), workload (medium, general), opportunity (some), and training (some).
-
While there have been many studies on the job choice preferences of healthcare workers, especially doctors and nurses[24-27], and limited studies on CDC workers[3], we provide a nationally representative DCE assessment of the job choice preferences and internal heterogeneity of CDC workers. All seven attributes–income, welfare benefits, bianzhi, workload, acceptance and respect from the public, opportunities for career development, and job skills training–significantly influenced the job choices of CDC workers. For the full sample, income, and bianzhi were the top two job preference attributes and had similar importance, confirming the limited number of regional studies. Our key finding was that there were significant differences in the extent to which different attributes affected choice outcomes for different classes of CDC workers.
Despite the different labor market contexts, income is an important attribute in doctors, nurses, and health workers’ job choice preference studies in the USA[28], Peru[29], and China[30], but not in Norway[31]. Our positive income effect is amplified when income is below a “reasonable range,” such as significantly below the industry sector average or out of balance with the work effort. For the CDC workers, income did not match their workload, and their average income was relatively low.[3,10,11] The problem started in 2017 when the Chinese government reduced the public's financial burden for disease prevention by canceling the CDC’s social income from medical examinations, health inspections, and epidemic prevention services but failed to increase the CDC’s financial support to fully compensate for the reduced social income[4]. As a result, the income level of CDC employees decreased. This finding corroborates and explains the positive utility of the income attributes in the estimates. We recommend establishing a performance incentive policy to prioritize the income levels of CDC workers. The results of the mixed logit model also indicated that bianzhi was the second-most important attribute, which is consistent with a CDC municipal-level study in Shandong Province[3]. In China, having a bianzhi means enjoying higher-quality job security, as well as gaining more social recognition and public respect[8]. Second, bianzhi are common prerequisites for job title evaluations and promotions in government organizations[7,32]. Finally, the acquisition of bianzhi is subject to certain technical requirements, comprehensive assessments, and educational thresholds with the number of bianzhi relatively fixed. We recommend that the number of bianzhi increase to retain and attract more healthcare workers.
Our study revealed internal heterogeneity in CDC workers’ job choice preferences, with significant differences between income-prioritizers (57.49%) and bianzhi-prioritizers (42.51%). The results of the RI and policy simulations showed that for income-prioritizers, an increase in income can lead to a greater probability of job selection. Second, this group also cared about working conditions with more opportunities for development, higher benefits, and less workload. In terms of socio-demographic characteristics, income-prioritizers had a higher percentage of people who were highly educated, did not have a job title, had a lower income, were unmarried, and had a shorter length of service. The current CDC compensation system closely relates income growth and benefit levels to job title and length of service but not to education level. These workers were more educated, younger, and more forward-looking toward career development and title advancement but faced pressures related to marriage and housing exacerbated by their low income. This explains why previous research found that highly educated CDC workers have lower salaries.[3,33,34] Similarly, poor salaries and promotion channels explain the brain drain of highly educated CDC workers.[11] Housing prices in China affect the choice of epidemiology and biostatistics PhDs for CDC jobs, and the provision of housing benefits, as well as the increased diversification of benefits, may retain highly educated talent.[7] We recommend that CDC human resource management models match highly educated staff to appropriate salary levels, more comprehensive benefit packages, and unimpeded personal development paths. For regional CDCs facing financial constraints, we recommend ensuring sufficient opportunities for personal development as incentives for highly educated staff.
The RI results suggested that, compared to the job preference of income-prioritizers, bianzhi-prioritizers also cared more about the bianzhi attribute than the welfare attribute, with the RI of bianzhi reaching 43.40%; however, the development opportunity attribute fell to the bottom of the preference list. Considering CDC’s financial and management constraints,[5] we recommend that bianzhi be leveraged to promote higher-level talent recruitment. At the same time, the results of the policy simulations show that the bianzhi-prioritizers response to changes in various policy scenarios is much lower than that of income-prioritizers. With bianzhi a type of job ‘iron rice bowl’ effect[8], the bianzhi attribute has both advantages and disadvantages. The bianzhi attribute itself carries a host of benefits, such as health insurance and a pension for life.[8] When satisfied with the favorable conditions attached to bianzhi, the sensitivity of bianzhi-prioritizers to changes in various policy scenarios diminished. When all attributes are improved simultaneously, the incentive utility of bianzhi-prioritizers does not change to the same magnitude of income-prioritizers. For bianzhi-prioritizers, the incentive utility of a combined improvement in the seven attributes is consistent with a single-attribute improvement such as a 30 percent increase in income or a high level of benefits. Consequently, when attempting to attract CDC talent, the establishment can be regarded as the primary attraction strategy. Nevertheless, the implementation of additional incentive strategies and control measures is imperative to mitigate the adverse reactions of bianzhi-prioritizers to other working conditions, with the aim of ensuring the maintenance of the workforce's vitality and innovation over time.
It is also worth highlighting that the policy simulation provided some possible predictions for future reforms of incentives for CDC jobs, visually presenting the differential utility of different incentives and their combinations in the face of the income-prioritizers and bianzhi-prioritizers. In the two scenarios, the two classes exhibited opposite simulation selection effects. The first scenario involved two single-policy simulations with high acceptance and respect from the public as well as sufficient job skills training. The second scenario was a combination of policy simulations in which both job skill training and opportunities for career development were sufficient. The motivational utility of The combined improvement of the seven attributes promoted the highest probability of retention of income-prioritizers (92%). By contrast, the highest probability of selection for bianzhi-prioritizers (47%) was found in the combined scenario of high welfare benefits and sufficient opportunities for career development. The single simulation scenario in which job skill training sufficiently included both the lowest values for income-prioritizers (9%) and bianzhi-prioritizers (-22%). These findings provide two primary insights. First, it suggests that a package incentive system with simultaneous increases in all entitlements is inappropriate for the entire population. Therefore, the optimization and adjustment of CDC's employee management system should not mechanically pursue across-the-board improvements in all aspects of job benefits. We suggest distinguishing the diversified needs of different groups of people, considering the cross-influence of various conditional attributes, and prioritizing the improvement of the most popular attributes to achieve a higher incentive effect with less investment. Second, the training attribute of bianzhi-prioritizers appears in the middle of the scale but has a negative impact when there is too much training. We suggest that when the number and duration of training sessions become mandatory assessment requirements, training becomes another form of workload, triggering boredom and dissatisfaction.[35,36] We argue that blindly increasing the number of training opportunities for CDC workers is undesirable and recommend that CDC management carefully calibrate training opportunities as an incentive mechanism.
Some studies have suggested that a comprehensive package of incentives is effective in promoting primary care workers’ job choice preferences.[29,30,37] We found that management should provide different work incentive strategies according to the preference characteristics of different subgroups of the CDC worker population. Given the differences in financial support and practical conditions in different CDC regions, current working conditions should be tailored at the regional and local levels. The combined utility of a composite measure and its economics should be considered for the combined application of various aspects or types of incentives. Finally, although we explored the career choice preferences of the CDC staff in our study population, the findings have implications for population preference studies in other fields, suggesting the need for heterogeneity analyses when conducting preference studies with large sample sizes.
-
Our study had several limitations. First, while seven key attributes were included after rigorous documentation and expert consultation, future studies should consider commuting distance, family-related factors, employment location, and the working environment as job preference attributes. Second, several variables were self-reported; future studies should consider collecting alternative types of personal data. Third, DEC behavior differs from actual behavior. Future studies should measure the impact of work incentives on actual work behavior. Fourth, the cross-combination of various policy conditions generates a large number of hypothetical scenarios, with additional scenarios to be considered in future research. Fifth, our study is oriented towards providing a reference for integrated management and applies to general policy support. Factors such as the economic level, geodemographic characteristics, and cultural habits of each region were not included in the analysis.
-
Our job choice preferences of Chinese CDC workers provide new insights into the optimization of CDC personnel management and retention policies. Income and bianzhi were the most important factors influencing the job choices of the CDC workers. Preference heterogeneity revealed the existence of two main job preference groups: income-prioritizers and bianzhi-prioritizers, with varying degrees of preference for other attributes, as well as sensitivity to simulated policy scenarios. When optimizing the CDC’s talent management and training system, it is recommended to consider the preferences and characteristics of the two-class population and focus on the reasonableness of setting the two attributes of income and bianzhi. At the same time, the utility of different incentives should be differentiated by combining realistic factors and subgroup preferences to formulate appropriate incentive policies for building high-quality talent for disease prevention and control systems.
doi: 10.3967/bes2025.070
Job Preferences of Centers for Disease Control and Prevention Workers: A Discrete Choice Experiment in China
-
Abstract:
Objective This study explored the job choice preferences of Center for Disease Prevention and Control (CDC) workers to provide CDC management information and recommendations for optimizing employee retention and motivation policies. Methods A discrete choice experiment was conducted in nine provinces across China. Seven key attributes were identified to analyze the job preferences of CDC workers. Mixed logit models, latent class models, and policy simulation tools were used. Results A valid sample of 5944 cases was included in the analysis. All seven attributes significantly influenced the job choices of CDC workers. Heterogeneity analyses identified two main groups based on different levels of preference for attribute utility. Income-prioritizers were concerned with income and opportunities for career development, whereas bianzhi-prioritizers were concerned with bianzhi and welfare benefits. The policy simulation analysis revealed that income-prioritizers had a relatively higher sensitivity to multiple job preference incentives. Conclusion Income and bianzhi were the two key attributes influencing the job choices and retention preferences of CDC workers. Heterogeneity in job preferences was also identified. Based on the preference characteristics of different subgroups, policy content should be skewed to differentiate the importance of incentives. -
Key words:
- Job preferences /
- CDC workers /
- Discrete choice experiment /
- China
The authors declare no competing interests.
All respondents included in the analyses responded anonymously after reading and agreeing to the informed consent information for this study. The Ethics Committee of the Beijing University of Chinese Medicine reviewed and approved this study (no. 2024BZYLL0303).
注释:1) Authors’ Contributions: 2) Competing Interests: 3) Ethics: -
Figure 2. Incremental uptake rate under different policy simulation scenarios by class. Baseline: income (current unchanged), welfare (general), bianzhi (yes), workload (medium, general), opportunity (some), and training (some).
Table 1. Estimation results of mixed logit model
Attribute levels β OR SE 95% CI SD Income (by 1%) 0.094*** 1.098 0.004 1.090–1.106 0.067*** Welfare (ref: low) high 1.201*** 3.324 0.057 2.972–3.718 0.900*** general 0.555*** 1.742 0.040 1.612–1.883 0.019 Bianzhi (ref: no) yes 2.700*** 14.881 0.104 12.137–18.246 2.140*** Workload (ref: heavy) light 0.763*** 2.144 0.057 1.918–2.396 1.402*** medium −0.040 0.961 0.040 0.888–1.040 0.035 Respect (ref: low) high 0.475*** 1.608 0.049 1.460–1.771 0.540** general 0.199*** 1.220 0.039 1.130–1.317 0.574*** Opportunity (ref: insufficient) sufficient 0.929*** 2.533 0.052 2.288–2.804 1.205*** some 0.160*** 1.173 0.037 1.092–1.261 0.306 Training (ref: insufficient) sufficient 0.361*** 1.434 0.037 1.334–1.542 0.206 some 0.668*** 1.950 0.049 1.771–2.148 0.884*** Log-likelihood −16,961.131 AIC 33,970.26 BIC 34,190.46 Note. ***P < 0.001 **P < 0.01 *P < 0.05. OR, odds ratio; SE, standard error; CI, confidence interval; SD, standard deviation; RI, relative importance; AIC, akaike information criterion; BIC, bayesian information criterion.  下载: 导出CSV
Table 2. Estimation results of the LCA model
Attribute levels Class 1 (n1 = 3,417, 57.49%) Class 2 (n2 = 2,527, 42.51%) β OR 95% CI β OR 95% CI Income (by 1%) 0.065*** 1.067 0.062 to 0.067 0.026*** 1.026 0.02 to 0.032 Welfare (ref: low) high 0.803*** 2.232 0.745 to 0.861 0.917*** 2.502 0.776 to 1.058 general 0.497*** 1.643 0.433 to 0.561 0.136 1.145 −0.016 to 0.287 Bianzhi (ref: no) yes 0.566*** 1.762 0.513 to 0.619 2.832*** 16.985 2.674 to 2.991 Workload (ref: heavy) light 0.548*** 1.731 0.482 to 0.615 0.533*** 1.704 0.357 to 0.708 medium −0.215*** 0.806 −0.28 to −0.15 0.495*** 1.641 0.324 to 0.667 Respect (ref: low) high 0.424*** 1.528 0.356 to 0.493 0.329*** 1.389 0.218 to 0.44 general 0.098** 1.103 0.041 to 0.155 0.547*** 1.728 0.371 to 0.724 Opportunity (ref: insufficient) sufficient 0.853*** 2.348 0.787 to 0.92 −0.075 0.927 −0.222 to 0.072 some 0.208*** 1.231 0.145 to 0.27 −0.317*** 0.728 −0.451 to −0.184 Training (ref: insufficient) sufficient 0.269*** 1.309 0.212 to 0.327 0.146* 1.157 0.028 to 0.263 some 0.093** 1.097 0.024 to 0.162 0.594*** 1.812 0.448 to 0.741 Log-likelihood AIC BIC
下载: 导出CSV
-
[1] Li CY, Sun M, Shen JJ, et al. Evaluation on the efficiencies of county-level centers for disease control and prevention in China: results from a national survey. Trop Med Int Health, 2016; 21, 1106−14. doi: 10.1111/tmi.12753 [2] Cui Q, Liu L, Hao ZJ, et al. Research on the influencing factors of fatigue and professional identity among CDC workers in China: an online cross-sectional study. BMJ Open, 2022; 12, e058762. doi: 10.1136/bmjopen-2021-058762 [3] Tuo ZG, Chen SS, Chen YX, et al. A study on job preferences of CDC staffs at the prefectural-levels in Shandong Province: based on a discrete choice experiment. Chin J Health Policy, 2024; 17, 60−7. (In Chinese) [4] Li XL, Qin RN, Zeng Q, et al. Research progress on the reform of disease control system in China. Occup Health, 2021; 37, 1286−9. (In Chinese) [5] Su BB, Cao W, Jia JZ, et al. Current situation of human resources and distribution equity in the center for disease control and prevention in China. Chin J Health Policy, 2016; 9, 75−80. (In Chinese) [6] Li YQ, Chen H, Guo HY. Examining Inequality in the public health workforce distribution in the centers for disease control and prevention (CDCs) system in China, 2008-2017. Biomed Environ Sci, 2020; 33, 374−83. [7] Liu SM, Gu YY, Yang Y, et al. Tackling brain drain at Chinese CDCs: understanding job preferences of public health doctoral students using a discrete choice experiment survey. Hum Resour Health, 2022; 20, 46. doi: 10.1186/s12960-022-00743-y [8] Liu Y, Li YF, Zeng XY, et al. The impact of bianzhi on work performance of teachers in public kindergartens: a multiple mediating effect model. Stud Early Child Educ, 2021; 22-36. (In Chinese) [9] Song KM, Scott A, Sivey P, et al. Studying on the job value preferences of staffs in county centers for disease control and prevention based on discrete choice experiments. Chin Health Serv Manage, 2013; 30, 544−6. (In Chinese) [10] Fei F. Analysis of staff turnover in a provincial center for disease control and prevention from 2010 to 2019. Chin Health Qual Manage, 2021; 28, 77−9,84. (In Chinese) [11] Guo LN, Li NN, Xi JJ. Personnel outflow in provincial centers for disease control and prevention in China: 2014-2018. Chin J Public Health, 2021; 37, 860−4. (In Chinese) [12] Chi FF, Cai BX. Research on the status and development of public health talents in China. Chin J Public Health Manage, 2021; 37, 317−20. (In Chinese) [13] Alamri AS, Georgiou S, Stylianou S. Discrete choice experiments: an overview on constructing D-optimal and near-optimal choice sets. Heliyon, 2023; 9, e18256. doi: 10.1016/j.heliyon.2023.e18256 [14] van den Broek-Altenburg E, Atherly A. Using discrete choice experiments to measure preferences for hard to observe choice attributes to inform health policy decisions. Health Econ Rev, 2020; 10, 18. doi: 10.1186/s13561-020-00276-x [15] Louviere JJ, Lancsar E. Choice experiments in health: the good, the bad, the ugly and toward a brighter future. Health Econ Policy Law, 2009; 4, 527−46. doi: 10.1017/S1744133109990193 [16] Lancsar E, Fiebig DG, Hole AR. Discrete choice experiments: a guide to model specification, estimation and software. Pharmacoeconomics, 2017; 35, 697−716. doi: 10.1007/s40273-017-0506-4 [17] Campoamor NB, Guerrini CJ, Brooks WB, et al. Pretesting discrete-choice experiments: a guide for researchers. Patient, 2024; 17, 109−20. doi: 10.1007/s40271-024-00672-z [18] Huang YT, Feng SX, Zhao YY, et al. Preferences for COVID-19 vaccines: systematic literature review of discrete choice experiments. JMIR Public Health Surveill, 2024; 10, e56546. doi: 10.2196/56546 [19] de Bekker-Grob EW, Donkers B, Jonker MF, et al. Sample size requirements for discrete-choice experiments in healthcare: a practical guide. Patient, 2015; 8, 373−84. doi: 10.1007/s40271-015-0118-z [20] Yan H, Han ZR, Nie HL, et al. Continuing medical education in China: evidence from primary health workers' preferences for continuing traditional Chinese medicine education. BMC Health Serv Res, 2023; 23, 1200. doi: 10.1186/s12913-023-10153-y [21] Lancsar E, Donaldson C. Discrete choice experiments in health economics: distinguishing between the method and its application. Eur J Health Econ, 2005; 6, 314−6. doi: 10.1007/s10198-005-0304-3 [22] Regier DA, Sicsic J, Watson V. Choice certainty and deliberative thinking in discrete choice experiments. A theoretical and empirical investigation. J Econ Behav Organ, 2019; 164, 235−55. doi: 10.1016/j.jebo.2019.05.031 [23] Angell B, Khan M, Islam R, et al. Incentivising doctor attendance in rural Bangladesh: a latent class analysis of a discrete choice experiment. BMJ Glob Health, 2021; 6, e006001. doi: 10.1136/bmjgh-2021-006001 [24] Mumbauer A, Strauss M, George G, et al. Employment preferences of healthcare workers in South Africa: findings from a discrete choice experiment. PLoS One, 2021; 16, e0250652. doi: 10.1371/journal.pone.0250652 [25] Engidaw M, Alemu MB, Muche GA, et al. Rural job preferences of graduate class medical students in Ethiopia-a discrete choice experiment (DCE). BMC Med Educ, 2023; 23, 155. doi: 10.1186/s12909-023-04133-3 [26] Tian Z, Guo W, Zhai M, et al. Job preference of preventive medicine students during the COVID-19 pandemic: a discrete choice experiment survey in Shandong Province, China. BMC Med Educ, 2023; 23, 890. doi: 10.1186/s12909-023-04873-2 [27] Işlek E, Şahin B. What are the job attribute preferences of physicians and nurses in Turkiye? Evidence from a discrete choice experiment. Hum Resour Health, 2023; 21, 52. doi: 10.1186/s12960-023-00826-4 [28] Fields BE, Bell JF, Bigbee JL, et al. Registered nurses' preferences for rural and urban jobs: a discrete choice experiment. Int J Nurs Stud, 2018; 86, 11−9. doi: 10.1016/j.ijnurstu.2018.05.012 [29] Huicho L, Miranda JJ, Diez-Canseco F, et al. Job preferences of nurses and midwives for taking up a rural job in Peru: a discrete choice experiment. PLoS One, 2012; 7, e50315. doi: 10.1371/journal.pone.0050315 [30] Luo NS, Bai R, Sun Y, et al. Job preferences of master of public health students in China: a discrete choice experiment. BMC Med Educ, 2024; 24, 24. doi: 10.1186/s12909-023-04993-9 [31] Holte JH, Kjaer T, Abelsen B, et al. The impact of pecuniary and non-pecuniary incentives for attracting young doctors to rural general practice. Soc Sci Med, 2015; 128, 1−9. doi: 10.1016/j.socscimed.2014.12.022 [32] He C, Wei H. Negative workplace gossip and turnover intention among Chinese rural preschool teachers: the mediation of ego depletion and the moderation of bianzhi. Front Psychol, 2022; 13, 1034203. doi: 10.3389/fpsyg.2022.1034203 [33] Xie WY, Zhang F, Min R. Study on job satisfaction and influencing factors of staff in center of disease control and prevention at county/district-level. Chin J Soc Med, 2023; 40, 225−9. (In Chinese) [34] He J, Feng HZ, Yang X, et al. Investigation on satisfaction with current work situation of personnel in disease prevention and control institutions in Guizhou Province. Occup Health, 2024; 40, 838−41,846. (In Chinese) [35] Kohno T, Kohsaka S, Takei Y, et al. Time trend in interest and satisfaction towards clinical training and academic activities among early-career cardiologists- the Japanese circulation society post-graduate training survey. Circ J, 2018; 82, 423−9. doi: 10.1253/circj.CJ-17-0398 [36] Chen BY, Jin XY, Zhou J, et al. Satisfaction of clinical teachers on standardized residency training program (SRTP) in China: a cross-sectional survey. Int J Environ Res Public Health, 2022; 19, 5676. doi: 10.3390/ijerph19095676 [37] Wei Y. Study on employment preference of disease control and prevention institutions among PhD candidates of public health related majors. Med Soc, 2024; 37, 16−22. (In Chinese) -

 点击查看大图
图(2) / 表ll (2)
计量
- 文章访问数: 27
- HTML全文浏览量: 11
- PDF下载量: 1
- 被引次数: 0

 Quick Links