

 下载:
下载:

-
Chronic hepatitis C virus (HCV) infection is a major public health issue worldwide and one of the main causes of liver cirrhosis and hepatocellular carcinoma (HCC). It is also a common cause of liver transplantation. Owing to the widespread use of injectable drugs and opioids, HCV infection rates have increased. Approximately 170 million people worldwide are estimated to be infected with HCV, and up to 8% of pregnant women are HCV-positive[1,2].
In 2016, the World Health Organization proposed the goal of eliminating the threat of viral hepatitis to public health by 2030, which is to reduce the incidence of new infections by 90% and the mortality rate by 65%[3]. The emergence of direct-acting antiviral drugs (DAAs) has made curing HCV a reality. DAAs have become the first-line treatment for HCV infections. DAAs effectively prevent HCC, especially in patients with non-cirrhotic and compensated cirrhosis, and help prevent further liver function deterioration[4]. Early initiation of DAA therapy also significantly reduces the rates of HCC recurrence, liver decompensation, and all-cause mortality[4]. Therefore, the use of DAAs has reduced the incidence of HCV-related liver diseases as an indication for liver transplantation[5].
However, owing to insufficient evidence on adverse fetal outcomes and concerns about the pharmacokinetic effects on physiological changes during pregnancy, no direct-acting antiviral regimens are currently recommended during pregnancy[6]. Therefore, almost all pregnant women are excluded from clinical studies, and there is currently no effective vaccine to prevent the vertical transmission of HCV[7]. The combination of pregnancy and HCV infection cannot be disregarded. With strict screening of blood products, vertical transmission has become the primary route of HCV transmission, with the incidence of mother-to-child transmission ranging from 5% to 7%[8].
Numerous clinical studies have focused on mother-to-child vertical transmission of HCV; however, research regarding the effects of chronic HCV infection on pregnancy and neonatal complications remains relatively limited. This study investigated the impact of pregnancy combined with chronic HCV infection on pregnant women and newborns using a retrospective cohort analysis.
-
This retrospective study included a contemporaneous cohort of pregnant women who underwent obstetric examinations and delivered their babies at Beijing Ditan Hospital between January 2015 and May 2022. Based on HCV RNA and anti-HCV levels at enrollment and before delivery, participants were stratified into three groups: Group A (anti-HCV and HCV RNA negative, n=142), Group B (anti-HCV positive but HCV RNA negative, n=121), and Group C (both HCV RNA and anti-HCV positive, n = 157). Group A was used as a control group to explore the effect of chronic HCV infection on maternal and neonatal outcomes. Inclusion criteria: 1) HCV RNA and anti-HCV levels analyzed during pregnancy; 2) complete clinical and biochemical examinations during pregnancy, as well as data on pregnancy and delivery complications; 3) available information on the growth, development, and outcomes of newborns at birth; and 4) chronic HCV infection was defined as HCV RNA(+) persisting for more than 6 months. Exclusion criteria: 1) Coexisting liver diseases, such as other viral hepatitis (hepatitis A, B, D, E), alcoholic hepatitis, autoimmune hepatitis, metabolic hepatitis, or non-alcoholic fatty liver disease; 2) viral co-infections that may cause liver function damage, such as Epstein Barr virus (EBV), Cytomegalovirus (CMV), or Human immunodeficiency virus (HIV); 3) concomitant cirrhosis or liver tumors; and 4) incomplete information on pregnant women and their newborns. Pregnant women negative for both anti-HCV and anti-HCV RNA were considered healthy controls and were enrolled from those who received antenatal care and delivered at the same hospital during the same study period. The inclusion and exclusion criteria for this group were consistent with those for the other groups. This study was approved by the Ethics Committee of Beijing Ditan Hospital, affiliated with the Capital Medical University (Ethics Approval No. Beijing Dilun Research Zi [2023] no. (004)-01) and registered at clinicaltrials.gov (ID: NCT05929963). The study was conducted in accordance with the ethical principles outlined in the Declaration of Helsinki. The institutional ethics committee approved this retrospective study and waived the requirement for informed consent.
-
Maternal demographic data, clinical biochemical indicators during pregnancy and delivery, HCV RNA and anti-HCV levels, clinical data on pregnancy and delivery, gravidity (total number of pregnancies, including miscarriages and stillbirths), adverse events, and delivery complications were retrospectively collected from the Hospital Information System (HIS) and Laboratory Information Management System (LIS) of Beijing Ditan Hospital affiliated with the Capital Medical University. Additionally, information related to newborn births, including birth weight, length, birth abnormalities, and neonatal jaundice, was collected. The first trimester of pregnancy was defined as weeks 0–12, the second trimester as weeks 13–26, and the third trimester as 27 weeks to delivery.
-
HCV RNA detection was performed using Roche Diagnostics' COBAS® AmpliPrep instrument for nucleic acid extraction, and automatic amplification and detection were performed using a COBAS TaqMan analyzer purchased from Roche Diagnostics. A positive result was defined as ≥ 20 IU/ml. Anti-HCV immunoglobulin G (IgG) antibodies were detected using an Abbott ARCHITECT i2000SR fully automated chemiluminescent immunoassay system. The assay covered HCV core protein (core antigen), NS3 protein, and NS4 protein, with anti-HCV levels of ≥ 1 S/CO defined as positive. Serological samples were analyzed for alanine aminotransferase (ALT), aspartate aminotransferase (AST), total bilirubin (TBIL), and albumin (ALB) levels using a Hitachi 7180 fully automated biochemical analyzer. Neonatal jaundice was assessed using a transcutaneous bilirubinometer. Neonatal jaundice was defined as a TBIL level > 6 mg/dL in the first 24 hours of life or > 12.9 mg/dL at any time[9]. All tests were performed at the Clinical Laboratory Center of the Beijing Ditan Hospital.
-
The primary outcome measures were the incidence of adverse events in pregnant women and newborns with HCV infections. Secondary outcome measures included the rate of abnormal liver function tests during pregnancy, as defined by the AASLD Chronic Hepatitis B Treatment Guidelines, with an upper normal limit of 19 U/L for maternal ALT levels[10].
-
SPSS 19.0 software was used to analyze the characteristics and biochemical indicators of the clinical data. Quantitative data that conformed to a normal distribution are presented using analysis of variance and means ± standard deviations. Non-parametric tests are used to represent quantitative data that did not conform to a normal distribution, using the medians (interquartile ranges [IQR]). Count data were analyzed using χ2 and are expressed as frequencies. A binary logistic regression model was used to predict the clinical indicators affecting pregnancy complications and outcomes. All analyses were conducted using a two-tailed test, with P < 0.05 indicating statistically significant differences. The GraphPad Prism software was used to plot the data.
-
A total of 420 pregnant women and their singleton infants who met the inclusion criteria were evaluated. There were 142, 121, and 157 pregnant women in Group A (negative control), Group B (HCV RNA negative and anti-HCV positive) (Group B), and Group C (HCV RNA and anti-HCV positive), respectively. The mean age of pregnant women was 30.33±4.33 years. The delivery gestational age of Group A was significantly higher than that of Groups B and C (31.17 ± 4.09 vs. 30.12 ± 3.82 and 29.73 ± 4.81, H = 18.777, P < 0.001). The gravidity of Group C was lower than that of Groups A and B (1.75 ± 1.09 vs. 1.97 ± 1.18 and 1.98 ± 0.95, H = 9.118, P = 0.010). The parity of Group C was also significantly lower than that of Groups A and B (0.17 ± 0.42 vs. 0.47 ± 0.59 and 0.45 ± 0.53, H = 34.494, P < 0.001). No statistically significant differences were observed (P > 0.05) among the anti-HCV(-) group, HCV RNA(-) group, and HCV RNA(+) group in terms of the mother's ethnicity, history of adverse childbirth, gestational age and delivery, and mode of delivery (Table 1).
Table 1. Demographic information on pregnant women
Values All patients (n=420) Group A (n = 142) Group B
(n = 121)Group C
(n = 157)H/χ² P-value P-value Groups
A vs. BP-value Groups
A vs. CP-value Groups
B vs. CHan Chinese (n, %) 414 (98.57%) 138 (97.18%) 120 (99.17%) 156 (99.36%) 2.426 0.333 > 0.4999 0.927 > 0.999 Ages (years) 30.33 ± 4.33 31.17 ± 4.09 30.12 ± 3.82 29.73 ± 4.81 18.777 < 0.001 0.031 <0.001 0.014 Gestation (weeks) 39.44 ± 3.02 39.32 ± 1.78 39.26 ± 1.30 39.68 ± 4.49 1.248 0.536 − − − Gravidity (number) 1.89 ± 1.09 1.97 ± 1.18 1.98 ± 0.95 1.75 ± 1.09 9.118 0.010 0.423 0.034 0.003 Parity (number) 0.35 ± 0.53 0.47 ± 0.59 0.45 ± 0.53 0.17 ± 0.42 34.494 < 0.001 0.898 <0.001 < 0.001 Cesarean section (%) 213 (50.71%) 64 (45.07%) 67 (55.37%) 82 (52.23%) 3.004 0.223 0.288 0.648 > 0.999 History of adverse pregnancy events (%) 161 (38.33%) 51 (35.92%) 55 (45.45%) 55 (35.03%) 3.671 0.160 0.348 > 0.999 0.234 Note. Group A, anti-HCV(-) and HCV RNA(-); Group B, anti-HCV(+) and HCV RNA(-); Group C, anti-HCV(+) and HCV RNA(+). P < 0.05 indicates a statistically significant difference. -
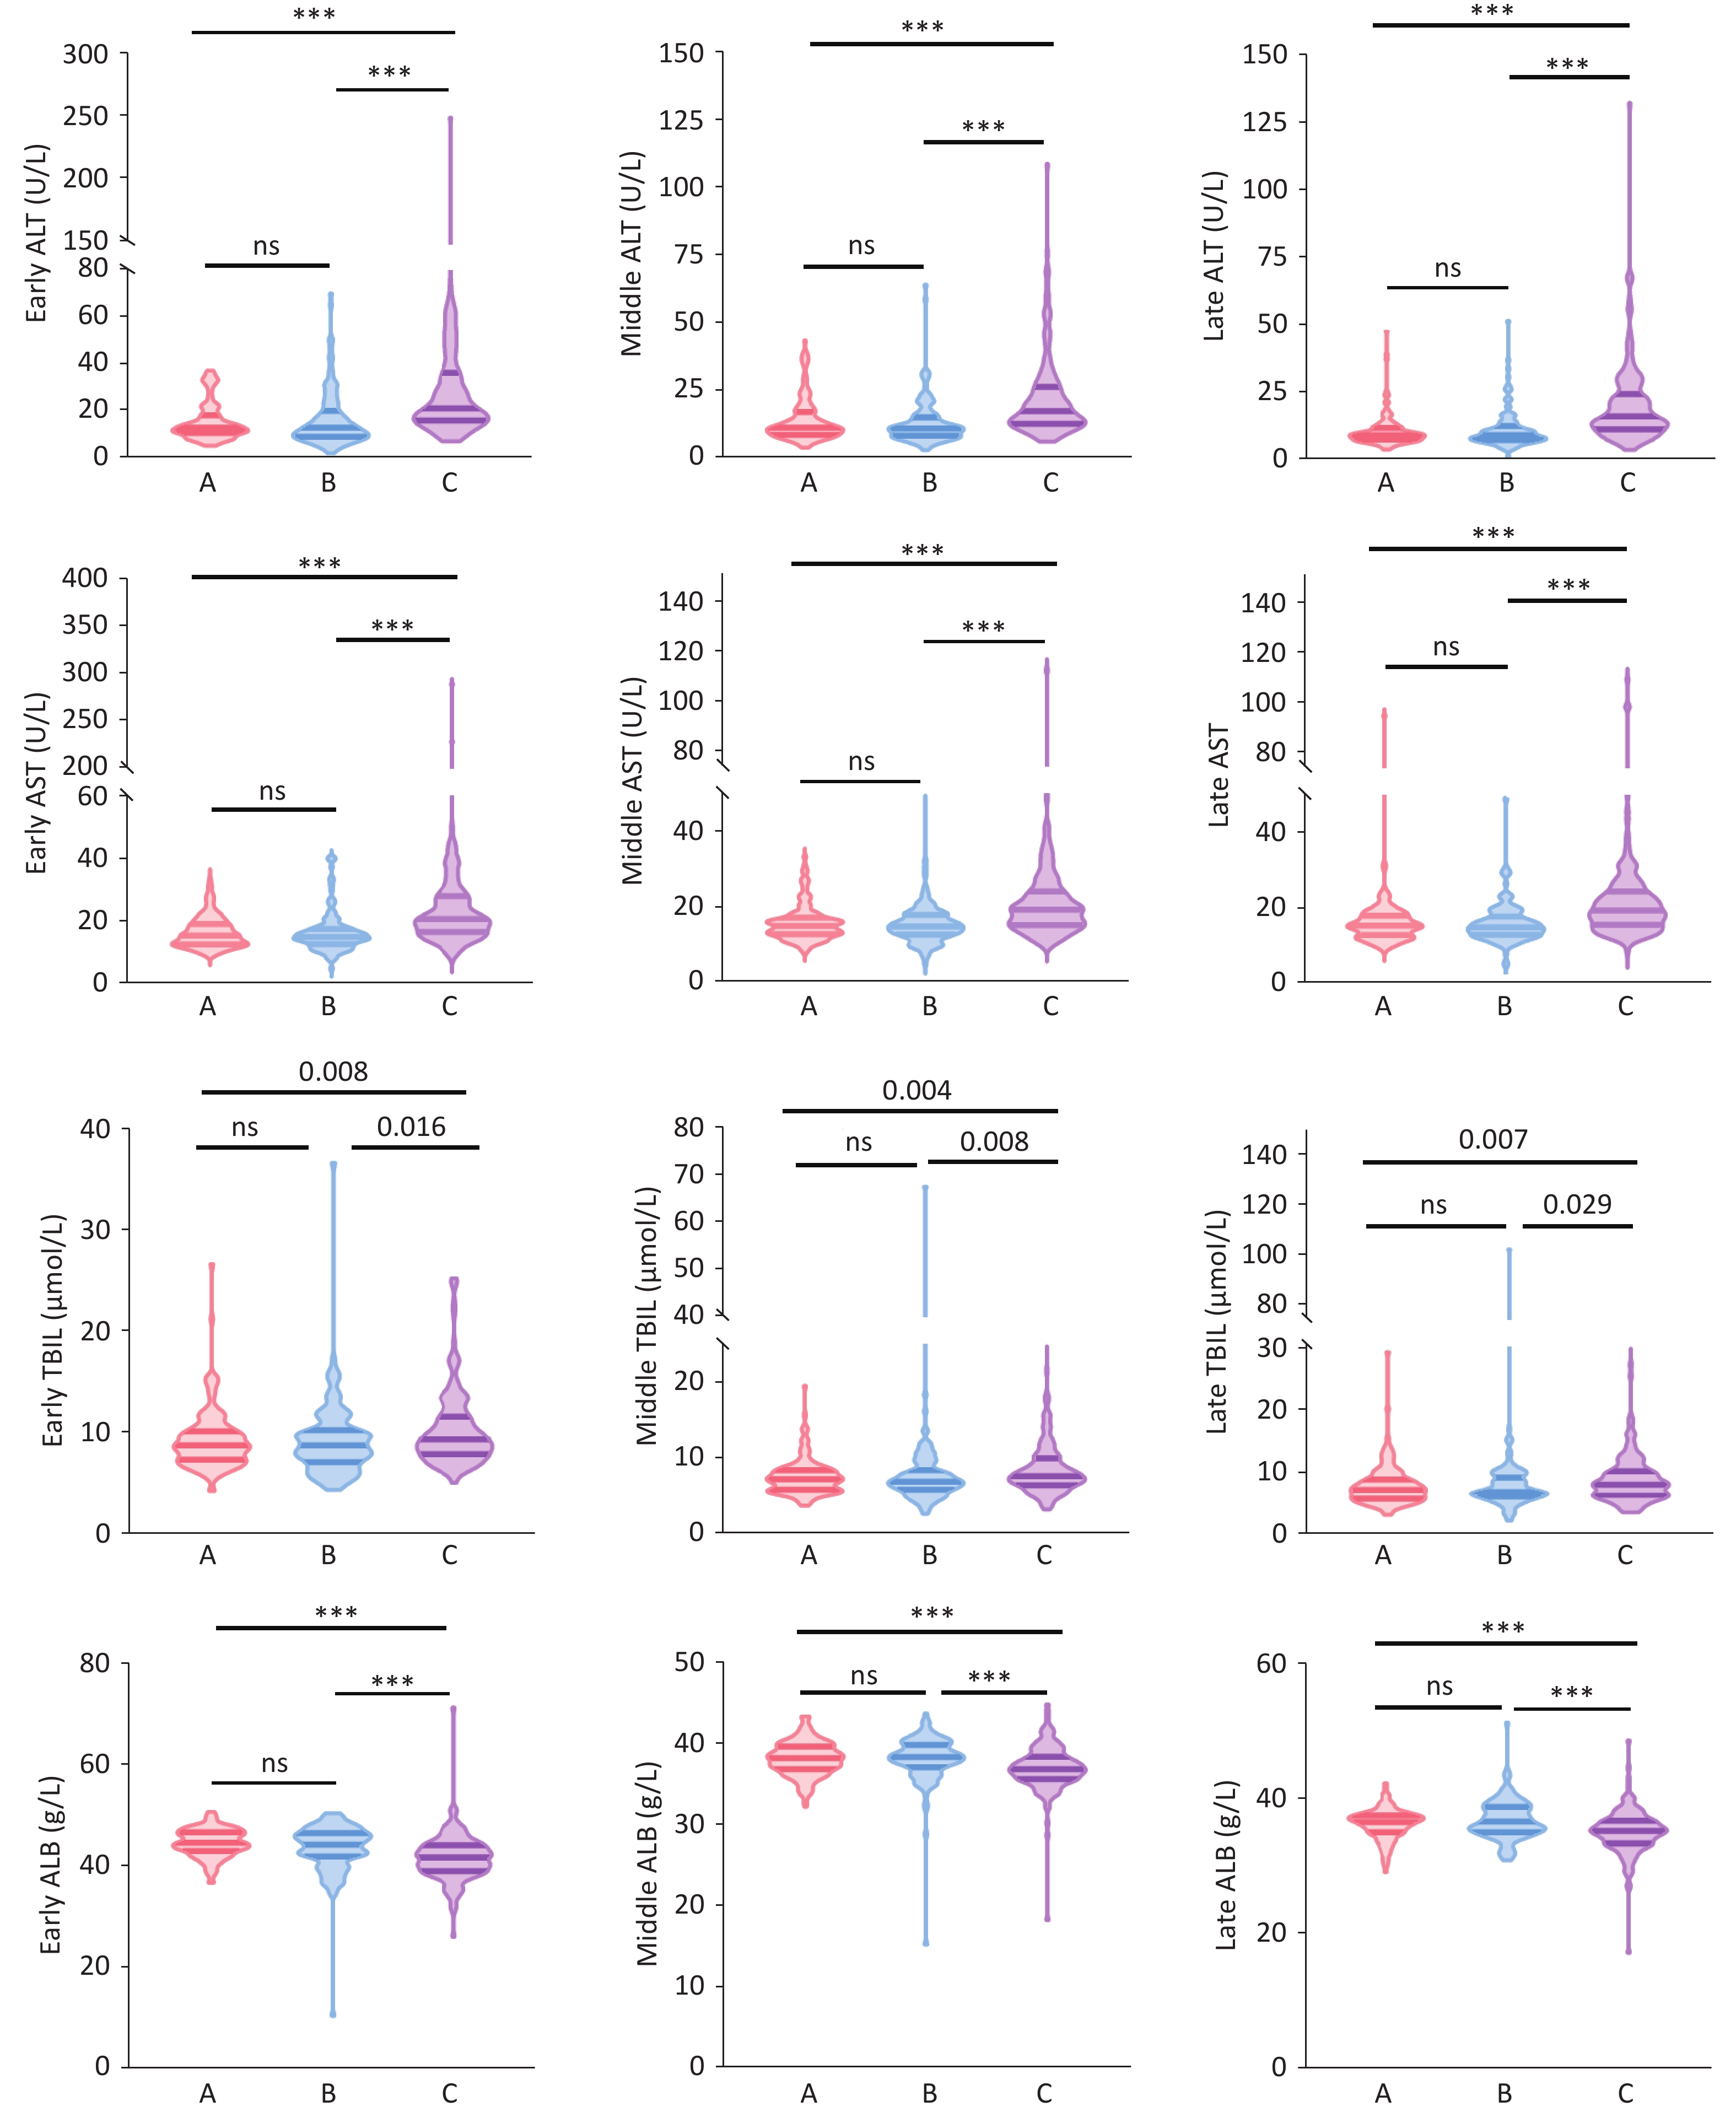
In the first trimester (1–12 weeks), the median (IQR) ALT levels in Group C (21 [16, 36] U/L) were significantly higher than those in Group A (13 [10,18] U/L) and Group B (13 [9,20] U/L) (H = 80.167, P < 0.001), with no significant difference between Groups A and B. Similarly, median (IQR) AST levels in Group C (21 [17,28] U/L) were significantly higher than those in Group A (15 [13,19] U/L) and Group B (15 [13,18] U/L), with no significant difference between Groups A and B. The median (IQR) TBIL levels in Group C (9 [7.85, 11.65] μmol/L) were significantly higher than those in Group A (8.70 [7.30, 10.20] μmol/L) and Group B (8.70 [7.05, 10.30] μmol/L) (H = 9.668, P = 0.008), with no significant difference between Groups A and B. The median (IQR) ALB levels in Group C (41.70 [39.00, 44.10] g/L) were significantly lower than those in Group A (44.60 [42.95, 46.73] g/L) and Group B (44.20 [41.90, 46.50] g/L) (H = 54.874, P < 0.001), with no significant difference between Groups A and B. The median levels of ALT, AST, TBIL, and ALB in the second trimester (13–27 weeks) and third trimester (28 weeks until delivery) showed similar differences among Groups A, B, and C, as in the first trimester (Supplementary Table S1) (Figure 1).
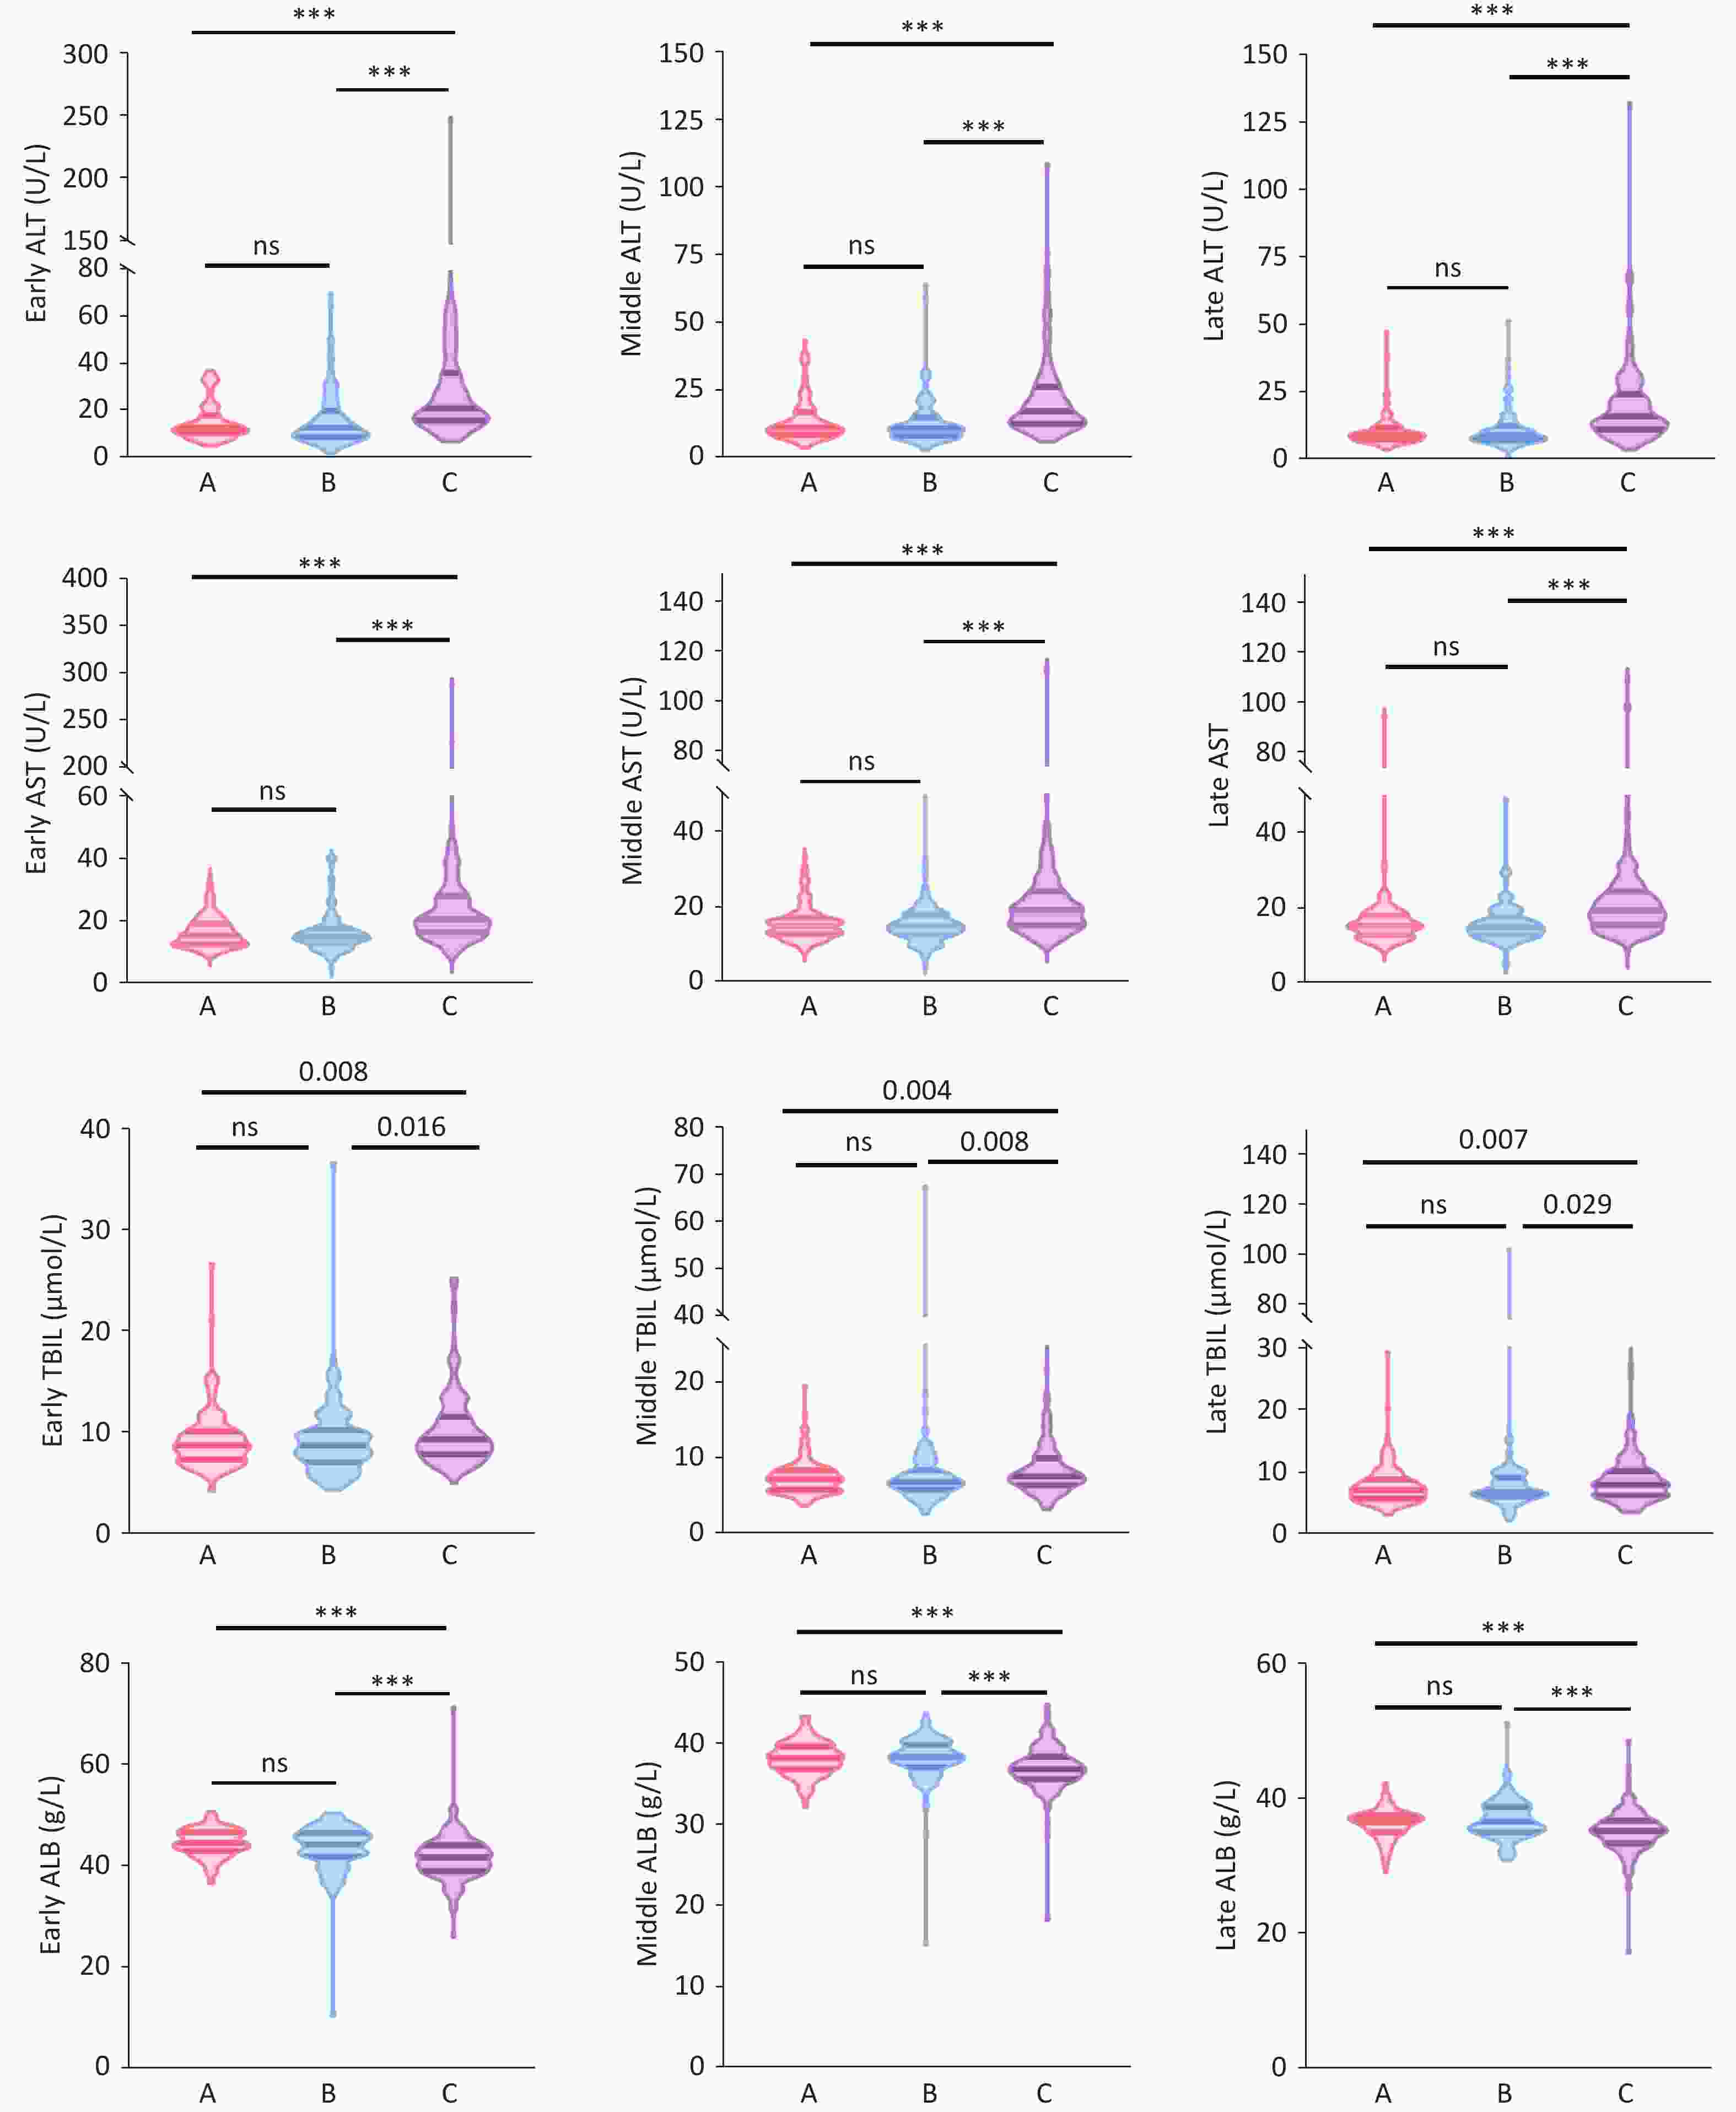
Figure 1. Liver function values during pregnancy.
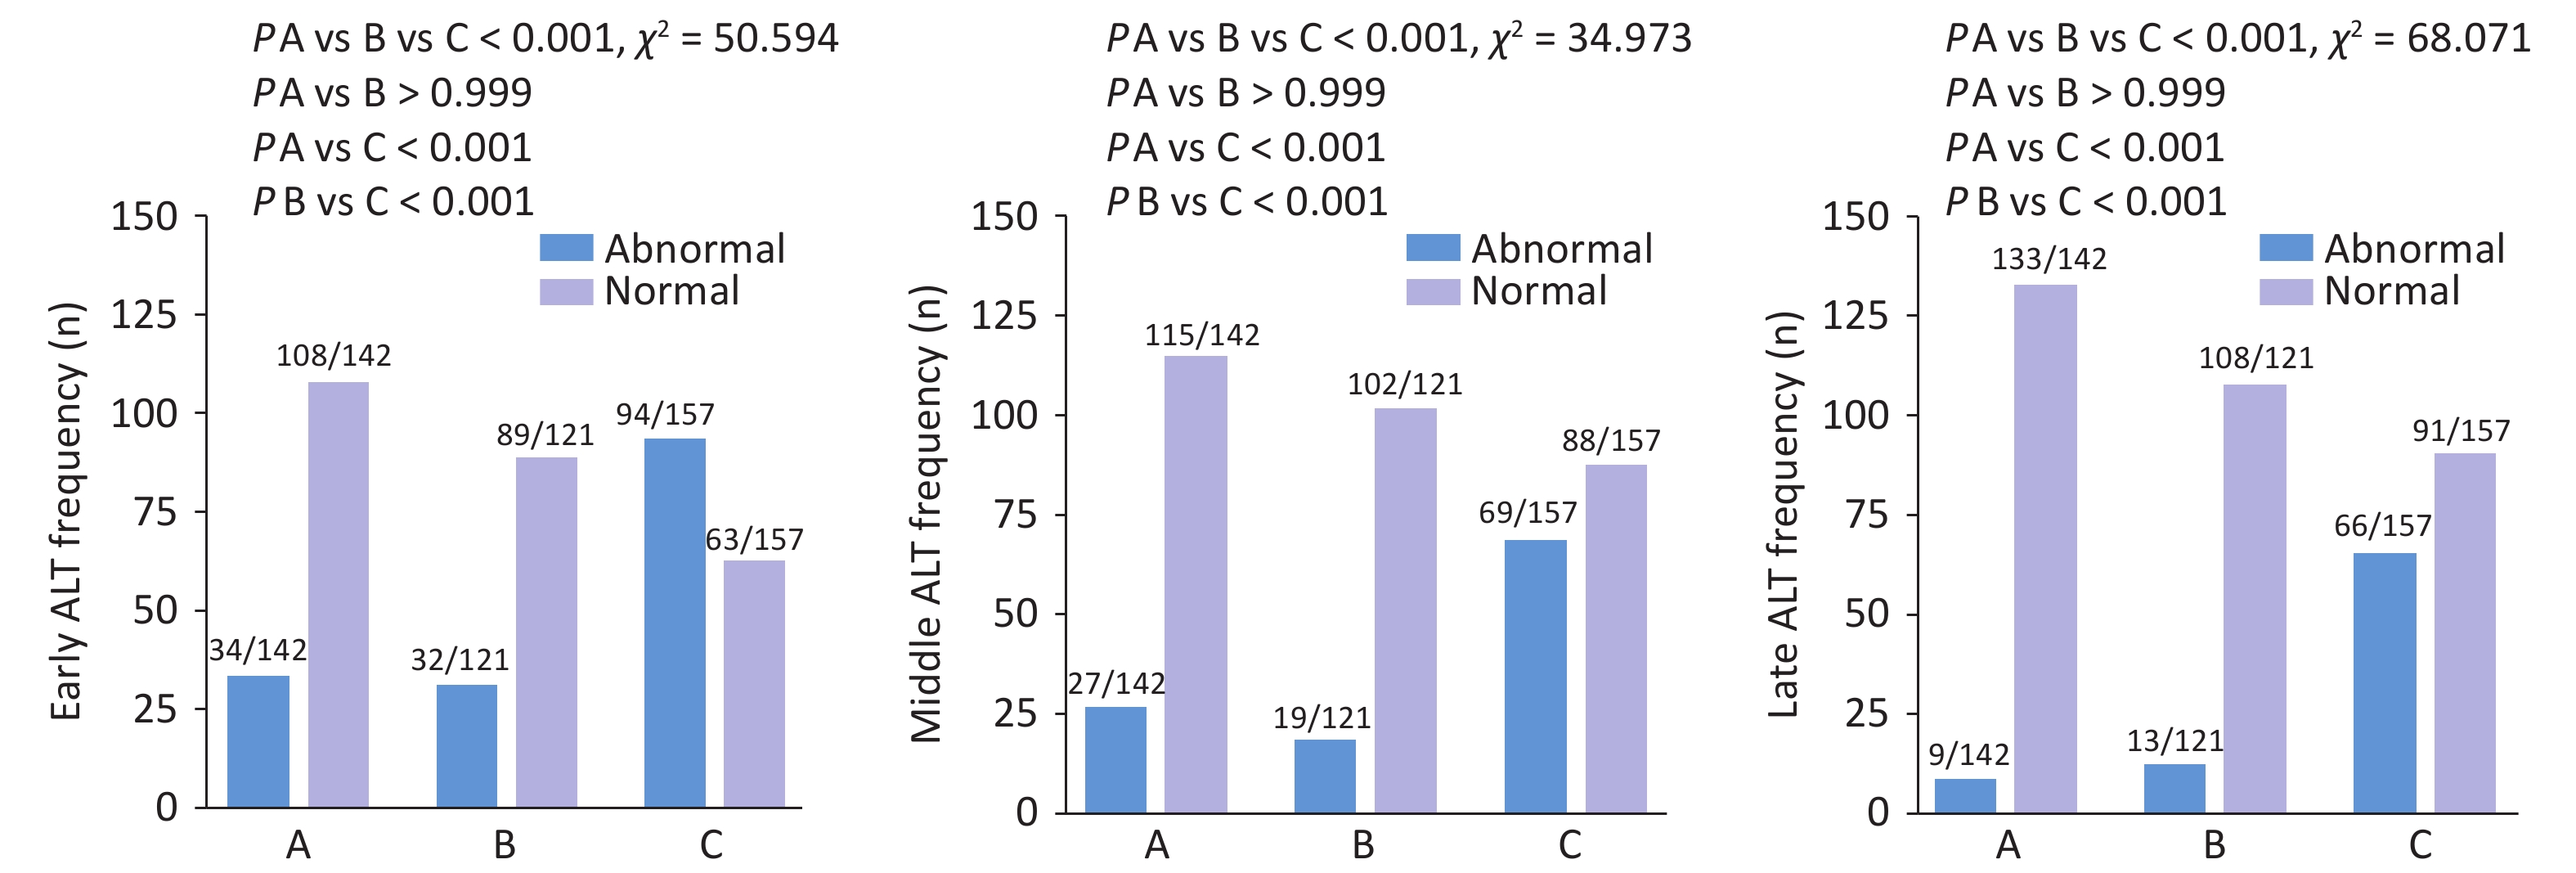
Among 420 pregnant women, the rates of ALT abnormalities (<19 U/L) in the first, second, and third trimesters were 38.10%, 27.38%, and 20.95%, respectively. The rate of ALT abnormalities throughout pregnancy was significantly higher in Group C than in Groups A and B (first trimester: 59.87% vs 23.94% and 26.45%, χ² = 50.594, P < 0.001; second trimester: 43.95% vs 19.01% and 15.70%, χ² = 34.973, P < 0.001; third trimester: 42.04% vs 6.34% and 10.74%, χ² = 68.071, P < 0.001) (Figure 2). However, no significant difference was observed in the rate of ALT abnormalities between Groups A and B. The rates of AST, TBIL, and ALB abnormalities in Group C did not significantly differ from those in Groups A and B during the entire pregnancy period (Supplementary Table S1).
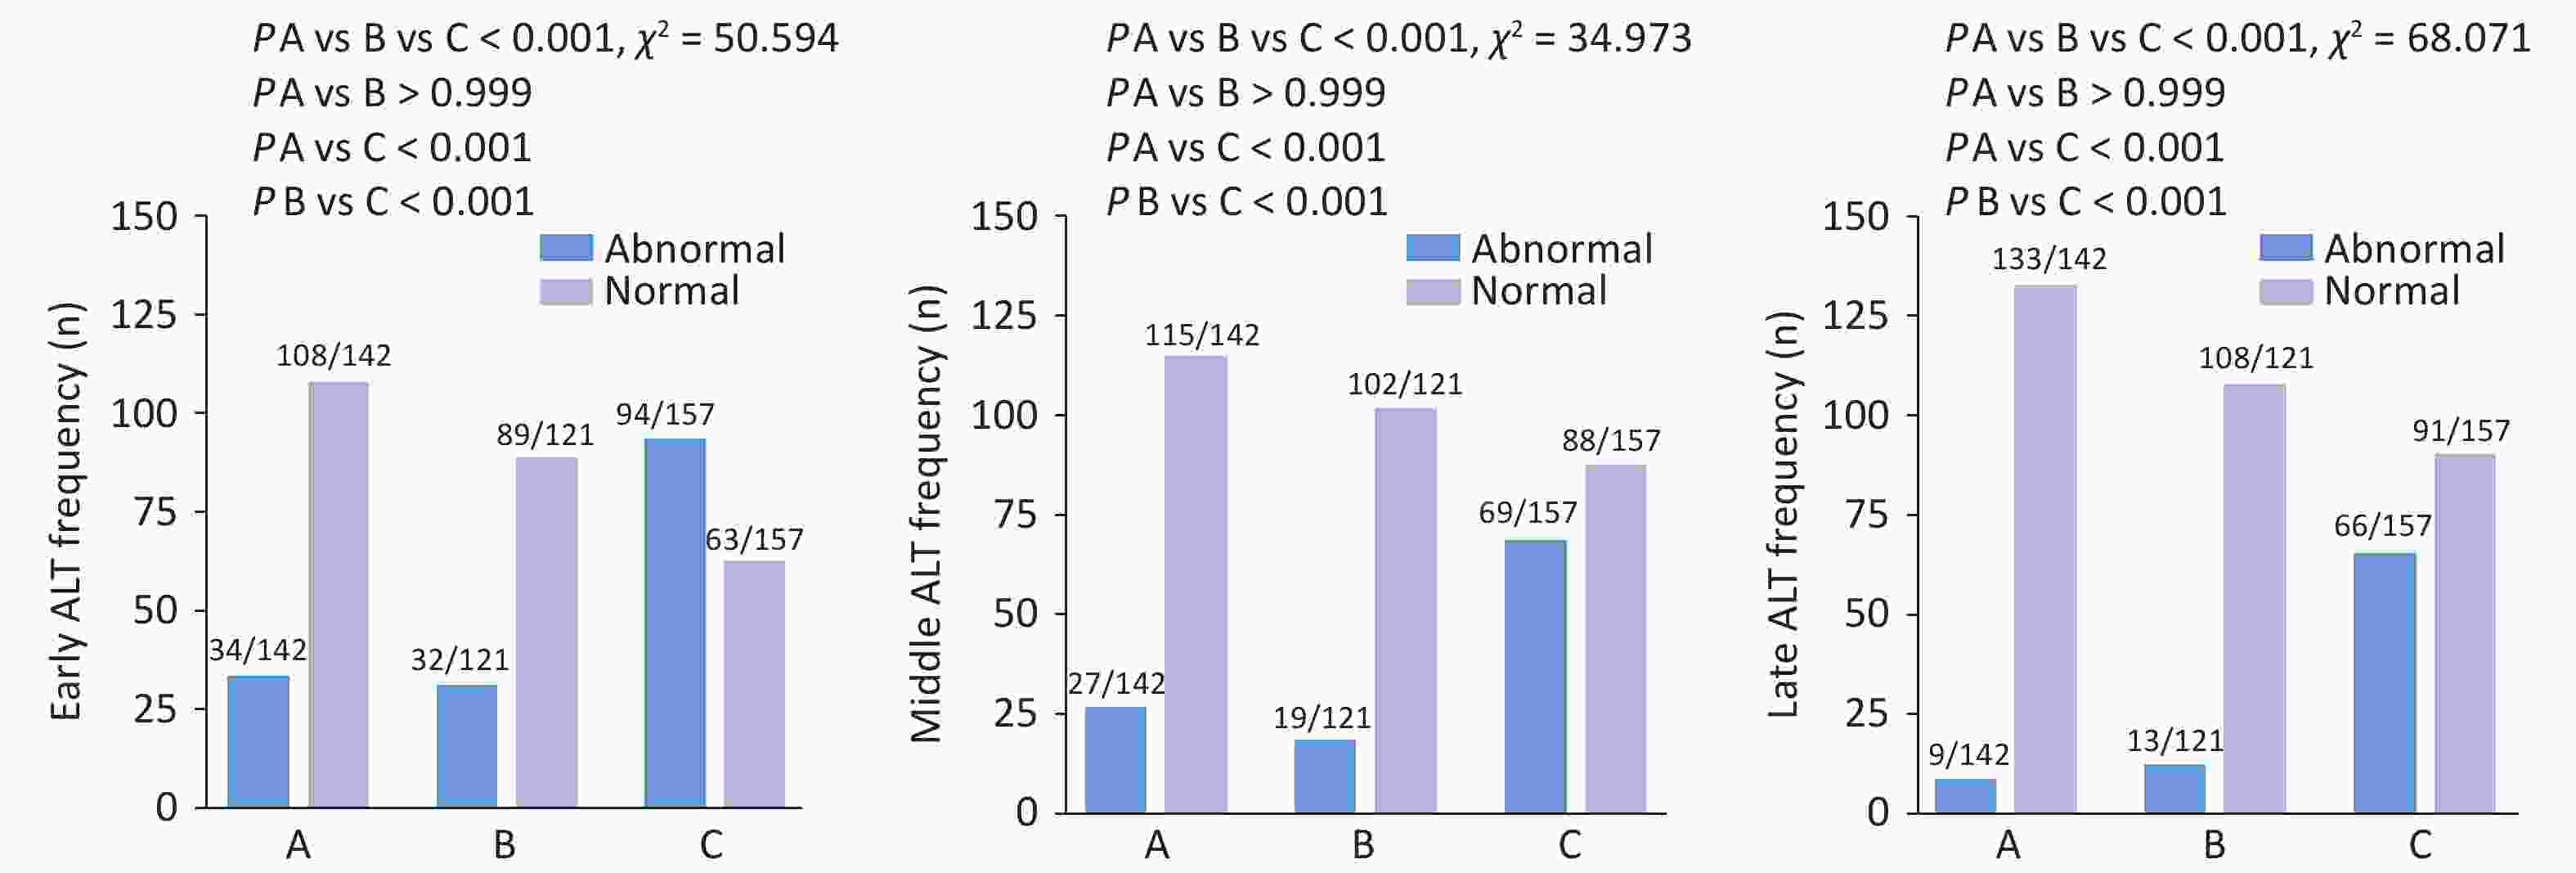
Figure 2. ALT abnormality frequency plot during pregnancy.
-
In the present study, the common complications during pregnancy and delivery included gestational diabetes (46.19%), lateral episiotomy (21.90%), premature rupture of membranes (14.52%), scarred uterus in pregnancy (12.14%), anemia during pregnancy (11.67%), and postpartum hemorrhage (11.67%). Except for episiotomy and scarred uterus in pregnancy, significant differences were observed between the three groups, whereas no significant differences were found in other complications. The incidence of scarred uterus in pregnancy in Group B was significantly higher than in Groups A and C (24.80% vs. 9.15% and 5.10%, respectively; χ² = 26.648, P = 0.001). However, there were no significant differences between Groups A and C. There were no significant differences in other complications, including oligohydramnios, hypothyroidism, and gestational hypertension among the three groups (Table 2).
Table 2. Complications of pregnancy and childbirth
Values All patients
(n = 420)Group A
(n = 142)Group B
(n = 121)Group C
(n = 157)χ2 P-value P-value Groups
A vs. BP-value Groups
A vs. CP-value Groups
B vs. CEpisiotomy
(n, %)92 (21.90%) 31 (21.83%) 18 (14.88%) 43 (27.39%) 6.255 0.044 0.446 0.798 0.037 Oligohydramnios (n, %) 23 (5.48%) 6 (4.23%) 4 (3.31%) 13 (8.28%) 3.915 0.141 > 0.999 0.453 0.258 Premature rupture of membranes
(n, %)61 (14.52%) 24 (16.90%) 10 (8.26%) 27 (17.20%) 5.369 0.068 0.111 > 0.999 0.089 Postpartum Hemorrhage
(n, %)49(11.67%) 19(13.38%) 8(6.61%) 22(14.01%) 4.243 0.120 0.213 >0.999 0.147 Gestational Diabetes (n, %) 194(46.19%) 60(42.25%) 55(45.45%) 79(50.32%) 1.988 0.370 >0.999 0.489 >0.999 Hypothyroidism (n, %) 26(6.19%) 14(9.86%) 4(3.31%) 8(5.10%) 5.349 0.069 0.108 0.345 >0.999 Hypertension disorder of pregnancy (n, %) 24(5.71%) 10(7.04%) 8(6.61%) 6(3.82%) 1.689 0.430 >0.999 0.651 0.876 Pregnancy with scarred uterus
(n, %)51(12.14%) 13(9.15%) 30(24.80%) 8(5.10%) 26.648 <0.001 0.002 0.510 <0.001 Anemia in pregnancy (n, %) 49(11.67%) 22(15.50%) 15(12.40%) 12(7.64%) 4.546 0.103 >0.999 0.099 0.555 Note. Group A, anti-HCV(-) and HCV RNA(-); Group B, anti-HCV(+) and HCV RNA(-); Group C, anti-HCV(+) and HCV RNA(+). P < 0.05 indicates a statistically significant difference. -
The study was retrospective, and newborns with recorded birth outcomes were selected; there were no miscarriages or neonatal deaths reported. A total of 420 newborns were delivered, including 232 males and 188 females. The distribution of males across Groups A, B, and C was 83, 63, and 86, respectively, with no significant differences (χ² = 1.099, P = 0.577). The average birth weight of newborns was 3323.19 ± 444.82 g, the average birth length was 50.05 ± 1.13 cm, and the median 5-minute Apgar score was 10.00 points. There were 13 cases (3.10%) of neonatal malformations: 5 cases in Group C (1 case of right foot polydactyly, 1 case of cleft lip and palate, 1 case of neonatal urethral membrane vegetation, 1 case of fetal foot inversion, and 1 case of corpus callosum absence), 5 cases in Group B (1 case of fetal hydronephrosis, 1 case of neonatal accessory ear, 1 case of congenital heart disease, 1 case of cleft lip and palate, and 1 case of a vascular tumor), and 3 cases in Group A (1 case of right hand polydactyly, 1 case of congenital heart disease, and 1 case of left accessory ear). There were 20 preterm births, distributed as 9, 4, and 7 cases in Groups A, B, and C, respectively, with no significant differences. No significant difference was observed in the incidence of neonatal malformations among Groups A, B, and C (3.18% vs 4.13% vs 2.11%, χ² = 0.954, P = 0.641), as shown in Table 3.
Table 3. Information on newborns
Values All Patients
(n =420)Group A
(n = 142)Group B
(n = 121)Group C
(n = 157)H/χ² P-value P-value Groups A vs. B P-value Groups A vs. C P-value Groups B vs. C Male
(n, %)232 (55.24%) 83 (58.45%) 63 (52.07%) 86 (54.78%) 1.099 0.577 0.897 >0.999 >0.999 Weight
(g)3323.19±444.82 3345.63±460.20 3318.18±416.12 3306.75±453.96 0.928 0.629 − − − Length
(cm)50.05±1.13 49.99±1.51 50.00±0.65 50.15±1.02 3.501 0.174 − − − Apgar score at 5 min
(scores)10.00 (10.00,10.00) 10.00 (10.00,10.00) 10.00 (10.00,10.00) 10.00 (10.00,10.00) 5.415 0.067 − − − Nuchal cords
(n, %)115 (27.38%) 41 (28.87%) 36 (29.75%) 38 (24.20%) 1.298 0.523 >0.999 >0.999 0.897 Birth defect
(n, %)13 (3.10%) 3 (2.11%) 5 (4.13%) 5 (3.18%) 0.954 0.641 >0.999 >0.999 >0.999 Intrauterine distress (n, %) 14 (3.33%) 3 (2.11%) 4 (3.31%) 7 (4.46%) 1.249 0.583 >0.999 >0.999 >0.999 Neonatal jaundice (n, %) 247 (58.81%) 60 (42.25%) 69 (57.02%) 118 (75.16%) 33.552 <0.001 0.051 <0.001 0.004 Erythema neonatorum
(n, %)13 (3.10%) 3 (2.11%) 5 (4.13%) 5 (3.18%) 0.954 0.641 >0.999 >0.999 >0.999 Premature birth (n, %) 20 (4.76%) 9 (6.34%) 4 (3.31%) 7 (4.46%) 1.375 0.503 0.774 >0.999 >0.999 Neonatal hypoglycemia
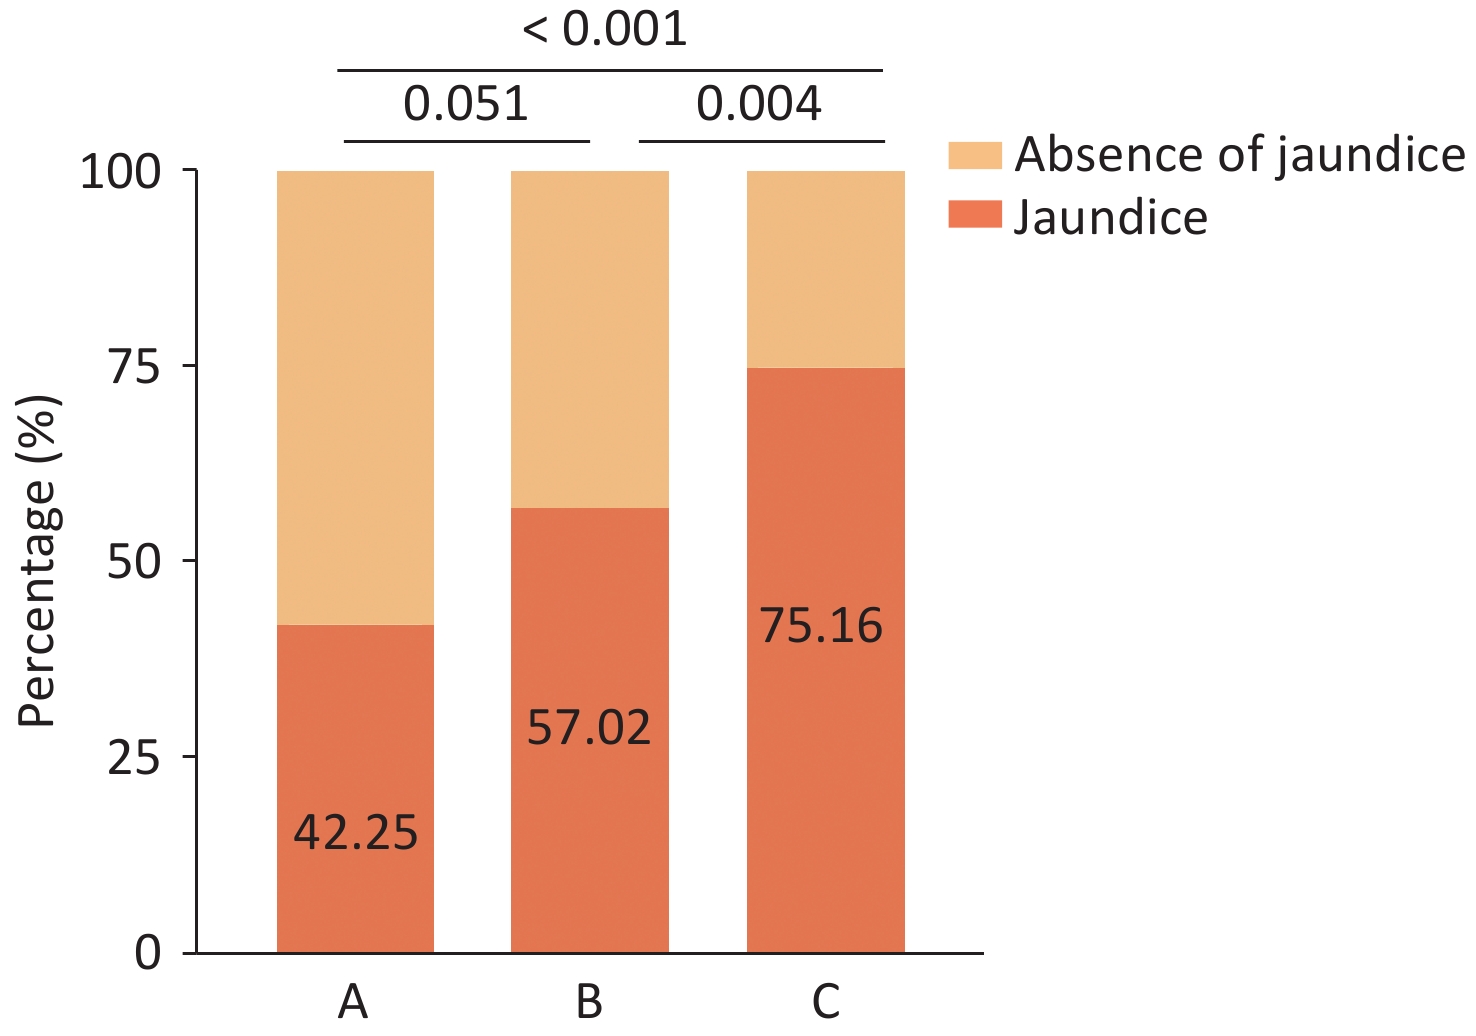
(n, %)143 (34.05%) 58 (40.85%) 39 (32.23%) 46 (29.30%) 4.676 0.097 0.447 0.108 >0.999 Note. Group A, anti-HCV (-) and HCV RNA (-); Group B, anti-HCV (+) and HCV RNA (-); Group C, anti-HCV (+) and HCV RNA (+). P < 0.05 indicates a statistically significant difference. The incidence of neonatal jaundice in Group C was significantly higher than that in Groups A and B (75.16% vs. 42.25% and 57.02%; χ² = 33.552, P < 0.001), while no significant difference was observed between Groups A and B, as shown in Figure 3. Other neonatal clinical data, including birth length, weight, 5-minute Apgar score, umbilical cord around the neck, preterm birth, neonatal hypoglycemia, neonatal erythema, and intrauterine distress, showed no significant differences (P > 0.05) (Table 3).
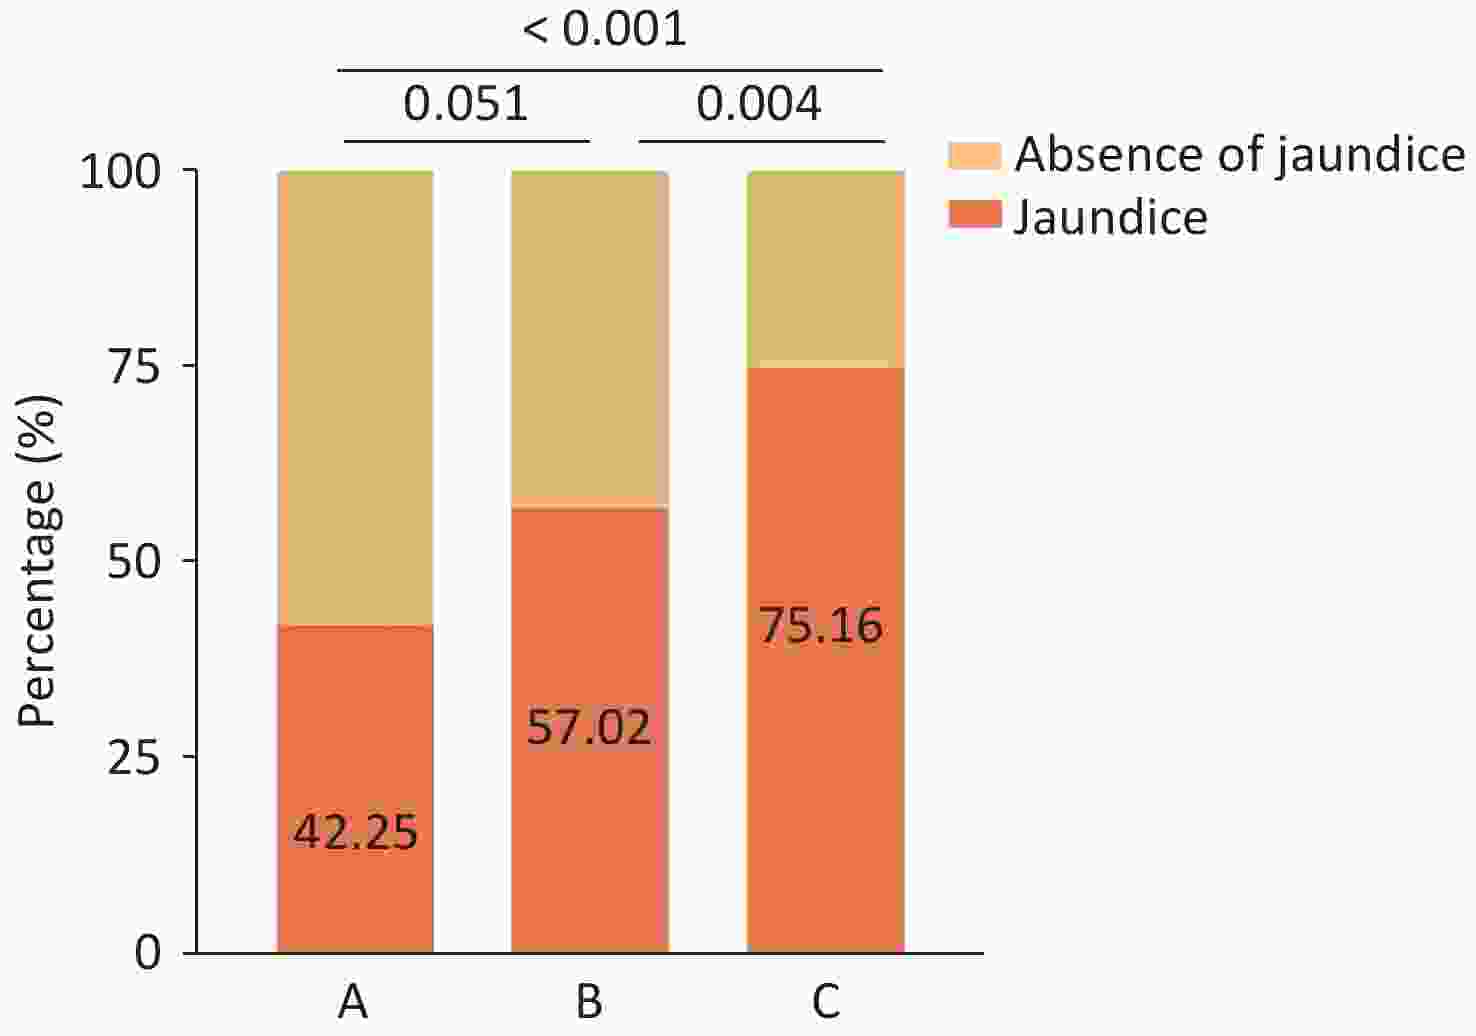
Figure 3. Neonatal jaundice.
A univariate binary logistic regression analysis of neonatal jaundice risk factors indicated that maternal HCV RNA positivity (OR = 2.280, 95% CI 1.369–3.799, P = 0.002), umbilical cord around the neck (OR = 0.456, 95% CI 0.263–0.791, P = 0.005), premature rupture of membranes (OR = 2.815, 95% CI 1.130–7.016, P = 0.026), and neonatal hypoglycemia (OR = 0.468, 95% CI 0.275–0.797, P = 0.005) were significantly associated with neonatal jaundice. Multivariate binary logistic regression analysis revealed that maternal HCV RNA positivity (OR = 2.111, 95% CI 1.242–3.588, P = 0.006), umbilical cord around the neck (OR = 0.476; 95% CI 0.269–0.844; P = 0.011), and neonatal hypoglycemia (OR = 0.473, 95% CI 0.272–0.821, P = 0.008) remained independent risk factors for neonatal jaundice (Table 4 and Supplementary Table S2).
Table 4. Binary logistic regression analysis of neonatal jaundice
Values Univariate analysis multivariate analysis B OR 95% CI P−value B OR 95% CI P−value HCV RNA(+) 0.82 2.28 1.369−3.799 0.002 0.747 2.111 1.242−3.588 0.006 Nuchal cords (n, %) −0.78 0.46 0.263−0.791 0.005 −0.741 0.476 0.269−0.844 0.011 Premature rupture of membranes (n, %) 1.04 2.82 1.130−7.016 0.026 0.889 2.433 0.948−6.245 0.064 Neonatal hypoglycemia (n, %) −0.76 0.47 0.275−0.797 0.005 −0.750 0.473 0.272−0.821 0.008 Note. Group A, anti−HCV(−) and HCV RNA(−); Group B: anti−HCV(+) and HCV RNA(−); Group C: anti−HCV (+) and HCV RNA (+). P < 0.05 indicates a statistically significant difference. -
In the general population, HCV, one of the major causes of liver disease, can lead to the progression of liver cell necrosis and histological liver changes[11]. This study aimed to explore the effects of chronic HCV infection on liver function and pregnancy and delivery outcomes in pregnant women.
Our results showed that HCV RNA-positive pregnant women had higher median ALT levels and a significantly higher rate of abnormal ALT levels than HCV RNA-negative and anti-HCV-negative pregnant women. Although ALT levels in pregnant women with chronic HCV infection were not elevated (16~21U/L), the rate of ALT level abnormalities was 42.04%~59.87%, indicating that chronic HCV infection can cause liver damage in immunosuppressed pregnant women. In the anti-HCV and HCV RNA-negative groups, some patients exhibited ALT level abnormalities, which may be associated with pregnancy-related complications, including gestational diabetes mellitus (GDM), hypertensive disorders of pregnancy, and hypothyroidism[12-14]. GDM is characterized by insulin resistance and low-grade chronic inflammation accompanied by distinct alterations in the composition of the gut microbiota[15]. Lipopolysaccharide (LPS) promotes inflammatory responses by activating the Toll-like receptor 4 (TLR4) signaling pathway and reducing short-chain fatty acid (SCFA) production, thereby impairing intestinal mucosal barrier function[16].
In a multicenter study involving non-pregnant patients, Frank et al. found that the proportion of patients with elevated ALT levels, defined by the AASLD as ALT levels > 19 U/L, was as high as 94.4%[17]. Meanwhile, Frank found in another real-world study of non-pregnant patients that in HCV-infected patients who achieved a sustained virological response after treatment, namely those who were anti-HCV(+) and HCV RNA(-), the proportion of patients with abnormal ALT levels was 37.4%, which was much lower than that of HCV RNA(+) patients[18]. A balanced maternal immune system is crucial for maintaining fetal tolerance to infection during pregnancy. Immune adaptation involves the increased secretion of soluble mediators to protect the fetus from excessive inflammatory responses[19]. The reason why the rates of abnormal ALT levels in patients with chronic HCV infections in this study were lower than in the above research results may be related to the fact that the study participants were pregnant women who were in an immunosuppressive state during pregnancy.
This study also found that the median TBIL levels in HCV RNA-positive pregnant women were significantly higher than those in HCV RNA-negative pregnant women during the early, middle, and late stages of pregnancy. Bilirubin, which is primarily derived from the breakdown of mature red blood cells, is the end product of heme catabolism. Unbound bilirubin is water-insoluble and binds to albumin. In the liver, it is catalyzed by glucuronyl transferase to form water-soluble conjugated bilirubin, which is then excreted[20]. Elevated TBIL levels are indicative of liver dysfunction. Impaired liver function leads to reduced albumin synthesis and catalytic capacity.
The results of this study indicate that chronic HCV infection in pregnant women can lead to hepatocyte necrosis or impaired bilirubin metabolism through viral activity, resulting in significantly elevated bilirubin levels compared to those in HCV RNA-negative patients. Furthermore, the study revealed that HCV RNA-positive pregnant women had significantly lower median ALB levels than HCV RNA-negative, anti-HCV-positive, or double-negative pregnant women, suggesting impaired hepatic albumin synthesis in HCV RNA-positive pregnancies.
Taijior et al. showed that ALB levels decreased in non-pregnant individuals infected with HCV. When these patients achieved a sustained virological response with HCV RNA becoming negative, serum ALB levels significantly increased[21]. Tomoaki et al. followed HCV-infected patients who achieved a sustained virological response through direct antiviral therapy and evaluated changes in liver reserve function using ALBI grading. They found that 72% of patients with baseline ALBI grades 2/3 reverted to grade 1, indicating an improvement in liver reserve function in HCV RNA-negative patients compared to that in HCV RNA-positive patients[22].
During viral infections, the inflammatory cascade is activated, which ultimately triggers hepatocyte apoptosis. Persistent hepatic injury can lead to structural and functional liver damage[23]. Based on the results of this study, we conclude that HCV infections during pregnancy affect liver function throughout gestation, manifesting as elevated ALT, AST, and TBIL levels and reduced ALB concentrations.
Our study found that the proportion of pregnant women with HCV RNA(-) and scarred uteri was significantly higher than that of HCV RNA(+) and anti-HCV(-) pregnant women; however, no significant difference was observed between the latter two groups, potentially related to differences in patient demographics. Whether scarred uteri are associated with HCV antibodies requires further investigation. Additionally, in our study, there were no significant differences between the three groups regarding pregnancy complications, such as GDM, premature rupture of membranes, gestational anemia, postpartum hemorrhage, and gestational hypertension, suggesting that chronic HCV infection may not elevate the risk of pregnancy or delivery complications. In a study by Pan et al., the risks of GDM, premature rupture of membranes, postpartum hemorrhage, and gestational hypertension were consistent with our findings. However, in their study, pregnant women with HCV RNA(+) had a significantly higher risk of developing anemia (OR = 18.1, 95% CI 4.3-76.6)[24].
In this study, birth lengths, weights, Apgar scores, umbilical cord around the neck rates, preterm birth rates, intrauterine distress rates, and deformity rates of newborns were similar among the HCV RNA(+), HCV RNA(-), and anti-HCV(-) groups, indicating that HCV infection did not affect neonatal perinatal outcomes. Pan et al. found that the average weight of newborns born to HCV RNA(+) pregnant women decreased significantly (3278.3 ± 462.0 vs 3105.1 ± 459.4, P = 0.006). Additionally, HCV RNA(+) status was associated with an umbilical cord around the neck (OR = 5.6, 95% CI 2.4-13.0)[24]. However, regarding other aspects of neonatal development and clinical outcomes, our findings were consistent with those of Pan et al.'s study. These inconsistent findings may be attributed to differences in the sample size, maternal alcohol and tobacco use, socioeconomic status, and comorbidities.
Neonatal jaundice is a common neonatal complication, with an incidence of 24.46–55.2% according to epidemiological reports[25-27]. Our study demonstrated an association between neonatal jaundice and maternal HCV RNA viremia (OR = 2.280, 95% CI 1.369-3.799, P = 0.002). HCV infection during pregnancy increases the risk of neonatal jaundice, which has not been reported previously. However, the exact mechanisms underlying this association remain unknown.
The placenta is a vital organ for maintaining fetal growth and development, with functions in material exchange, defence, and immunity. It serves as a barrier against viral infections and consists of trophoblasts, blood vessels, and their supporting connective tissue matrices[28]. Nie et al. found that HCV can replicate in cytotrophoblasts, and under electron microscopy, HCV-infected cytotrophoblasts exhibited significant ultrastructural changes, including excessive lysosomal proliferation, dilated rough endoplasmic reticulum, reduced lipid droplets, and the presence of vacuoles[29]. In addition, chronic HCV infection can affect multiple vascular endothelial cell systems. Placental endothelial cells are part of the complex barrier that separates maternal and fetal circulation and regulates gas and nutrient exchange between the mother and fetus[30]. We speculate that placental trophoblasts and vascular damage during pregnancy contribute to an increased risk of neonatal jaundice[31,32].
Maternal IgG antibodies can be transferred to the fetus via the placenta and typically decline within 6–12 months of birth. Therefore, anti-HCV antibody testing before 18 months of age cannot serve as a definitive diagnostic tool[33]. As this study had a retrospective design, long-term follow-up monitoring of newborns was not feasible. This is a limitation of this study. The HCV RNA(+) pregnant women in this study did not receive antiviral therapy during pregnancy, and HCV RNA and antibody levels were not monitored. Therefore, we could not investigate changes in HCV RNA and antibody levels during pregnancy or their potential effects on mothers and newborns. This is a major limitation of this study. In future studies, we plan to monitor these indicators to comprehensively assess the impact of HCV infection on maternal and infant health. A total of 20 preterm births were recorded, with nine, four, and seven cases in groups A, B, and C, respectively, showing no significant differences. However, whether other risk factors for preterm birth play a role. We did not collect data on other risk factors for preterm birth, which is another limitation of this study. Moreover, we were unable to obtain data on maternal body mass index, confirmed diagnoses of steatotic liver disease, history of injection drug use, or relevant sociodemographic information such as income, education level, and employment status. These factors may influence maternal liver function indicators, particularly aminotransferase levels, and therefore, represent an important limitation of this study.
Therefore, considering the limitations of the current study, future prospective multicenter studies are needed to expand the study population and further investigate the risk of adverse events and associated factors influencing maternal and neonatal outcomes in the context of HCV infection during pregnancy.
doi: 10.3967/bes2025.079
A Retrospective Study of Pregnancy and Fetal Outcomes in Mothers with Hepatitis C Viremia
-
Abstract:
Objective To investigate chronic hepatitis C virus (HCV) infection’s effect on gestational liver function, pregnancy and delivery complications, and neonatal development. Methods A total of 157 HCV antibody-positive (anti-HCV[+]) and HCV RNA(+) patients (Group C) and 121 anti-HCV(+) and HCV RNA(-) patients (Group B) were included as study participants, while 142 anti-HCV(-) and HCV RNA(-) patients (Group A) were the control group. Data on biochemical indices during pregnancy, pregnancy complications, delivery-related information, and neonatal complications were also collected. Results : Elevated alanine aminotransferase (ALT) rates in Group C during early, middle, and late pregnancy were 59.87%, 43.95%, and 42.04%, respectively—significantly higher than Groups B (26.45%, 15.70%, 10.74%) and A (23.94%, 19.01%, 6.34%) (P < 0.05). Median ALT levels in Group C were significantly higher than in Groups A and B at all pregnancy stages (P < 0.05). No significant differences were found in neonatal malformation rates across groups (P > 0.05). However, neonatal jaundice incidence was significantly greater in Group C (75.16%) compared to Groups A (42.25%) and B (57.02%) (χ²=33.552, P < 0.001). HCV RNA positivity during pregnancy was an independent risk factor for neonatal jaundice (OR = 2.111, 95% CI 1.242–3.588, P = 0.006). Conclusions Chronic HCV infection can affect the liver function of pregnant women, but does not increase the pregnancy or delivery complication risks. HCV RNA(+) is an independent risk factor for neonatal jaundice. -
Key words:
- Hepatitis C virus /
- Pregnancy /
- Neonatal jaundice /
- Chronic hepatitis C
The authors report no conflicts of interest.
&These authors contributed equally to this work.
注释:1) Authors’ Contributions: 2) Competing Interests: -
Figure 1. Liver function values during pregnancy.
Group A, anti-HCV(-) and HCV RNA(-); Group B, anti-HCV(+) and HCV RNA(-); Group C, anti-HCV(+) and HCV RNA(+). *P < 0.05; **P < 0.01; ***P < 0.001; NS P ≥ 0.05. P < 0.05 indicates a statistically significant difference.
Figure 2. ALT abnormality frequency plot during pregnancy.
Group A, anti-HCV(-) and HCV RNA(-); Group B, anti-HCV(+) and HCV RNA(-); Group C, anti-HCV(+) and HCV RNA(+). P < 0.05 indicates a statistically significant difference.
Figure 3. Neonatal jaundice.
Group A, anti-HCV(-) and HCV RNA(-); Group B, anti-HCV(+) and HCV RNA(-); Group C, anti-HCV(+) and HCV RNA(+). P < 0.05 indicates a statistically significant difference.
Table 1. Demographic information on pregnant women
Values All patients (n=420) Group A (n = 142) Group B
(n = 121)Group C
(n = 157)H/χ² P-value P-value Groups
A vs. BP-value Groups
A vs. CP-value Groups
B vs. CHan Chinese (n, %) 414 (98.57%) 138 (97.18%) 120 (99.17%) 156 (99.36%) 2.426 0.333 > 0.4999 0.927 > 0.999 Ages (years) 30.33 ± 4.33 31.17 ± 4.09 30.12 ± 3.82 29.73 ± 4.81 18.777 < 0.001 0.031 <0.001 0.014 Gestation (weeks) 39.44 ± 3.02 39.32 ± 1.78 39.26 ± 1.30 39.68 ± 4.49 1.248 0.536 − − − Gravidity (number) 1.89 ± 1.09 1.97 ± 1.18 1.98 ± 0.95 1.75 ± 1.09 9.118 0.010 0.423 0.034 0.003 Parity (number) 0.35 ± 0.53 0.47 ± 0.59 0.45 ± 0.53 0.17 ± 0.42 34.494 < 0.001 0.898 <0.001 < 0.001 Cesarean section (%) 213 (50.71%) 64 (45.07%) 67 (55.37%) 82 (52.23%) 3.004 0.223 0.288 0.648 > 0.999 History of adverse pregnancy events (%) 161 (38.33%) 51 (35.92%) 55 (45.45%) 55 (35.03%) 3.671 0.160 0.348 > 0.999 0.234 Note. Group A, anti-HCV(-) and HCV RNA(-); Group B, anti-HCV(+) and HCV RNA(-); Group C, anti-HCV(+) and HCV RNA(+). P < 0.05 indicates a statistically significant difference.  下载: 导出CSV
Table 2. Complications of pregnancy and childbirth
Values All patients
(n = 420)Group A
(n = 142)Group B
(n = 121)Group C
(n = 157)χ2 P-value P-value Groups
A vs. BP-value Groups
A vs. CP-value Groups
B vs. CEpisiotomy
(n, %)92 (21.90%) 31 (21.83%) 18 (14.88%) 43 (27.39%) 6.255 0.044 0.446 0.798 0.037 Oligohydramnios (n, %) 23 (5.48%) 6 (4.23%) 4 (3.31%) 13 (8.28%) 3.915 0.141 > 0.999 0.453 0.258 Premature rupture of membranes
(n, %)61 (14.52%) 24 (16.90%) 10 (8.26%) 27 (17.20%) 5.369 0.068 0.111 > 0.999 0.089 Postpartum Hemorrhage
(n, %)49(11.67%) 19(13.38%) 8(6.61%) 22(14.01%) 4.243 0.120 0.213 >0.999 0.147 Gestational Diabetes (n, %) 194(46.19%) 60(42.25%) 55(45.45%) 79(50.32%) 1.988 0.370 >0.999 0.489 >0.999 Hypothyroidism (n, %) 26(6.19%) 14(9.86%) 4(3.31%) 8(5.10%) 5.349 0.069 0.108 0.345 >0.999 Hypertension disorder of pregnancy (n, %) 24(5.71%) 10(7.04%) 8(6.61%) 6(3.82%) 1.689 0.430 >0.999 0.651 0.876 Pregnancy with scarred uterus
(n, %)51(12.14%) 13(9.15%) 30(24.80%) 8(5.10%) 26.648 <0.001 0.002 0.510 <0.001 Anemia in pregnancy (n, %) 49(11.67%) 22(15.50%) 15(12.40%) 12(7.64%) 4.546 0.103 >0.999 0.099 0.555 Note. Group A, anti-HCV(-) and HCV RNA(-); Group B, anti-HCV(+) and HCV RNA(-); Group C, anti-HCV(+) and HCV RNA(+). P < 0.05 indicates a statistically significant difference.
下载: 导出CSV
Table 3. Information on newborns
Values All Patients
(n =420)Group A
(n = 142)Group B
(n = 121)Group C
(n = 157)H/χ² P-value P-value Groups A vs. B P-value Groups A vs. C P-value Groups B vs. C Male
(n, %)232 (55.24%) 83 (58.45%) 63 (52.07%) 86 (54.78%) 1.099 0.577 0.897 >0.999 >0.999 Weight
(g)3323.19±444.82 3345.63±460.20 3318.18±416.12 3306.75±453.96 0.928 0.629 − − − Length
(cm)50.05±1.13 49.99±1.51 50.00±0.65 50.15±1.02 3.501 0.174 − − − Apgar score at 5 min
(scores)10.00 (10.00,10.00) 10.00 (10.00,10.00) 10.00 (10.00,10.00) 10.00 (10.00,10.00) 5.415 0.067 − − − Nuchal cords
(n, %)115 (27.38%) 41 (28.87%) 36 (29.75%) 38 (24.20%) 1.298 0.523 >0.999 >0.999 0.897 Birth defect
(n, %)13 (3.10%) 3 (2.11%) 5 (4.13%) 5 (3.18%) 0.954 0.641 >0.999 >0.999 >0.999 Intrauterine distress (n, %) 14 (3.33%) 3 (2.11%) 4 (3.31%) 7 (4.46%) 1.249 0.583 >0.999 >0.999 >0.999 Neonatal jaundice (n, %) 247 (58.81%) 60 (42.25%) 69 (57.02%) 118 (75.16%) 33.552 <0.001 0.051 <0.001 0.004 Erythema neonatorum
(n, %)13 (3.10%) 3 (2.11%) 5 (4.13%) 5 (3.18%) 0.954 0.641 >0.999 >0.999 >0.999 Premature birth (n, %) 20 (4.76%) 9 (6.34%) 4 (3.31%) 7 (4.46%) 1.375 0.503 0.774 >0.999 >0.999 Neonatal hypoglycemia
(n, %)143 (34.05%) 58 (40.85%) 39 (32.23%) 46 (29.30%) 4.676 0.097 0.447 0.108 >0.999 Note. Group A, anti-HCV (-) and HCV RNA (-); Group B, anti-HCV (+) and HCV RNA (-); Group C, anti-HCV (+) and HCV RNA (+). P < 0.05 indicates a statistically significant difference.
下载: 导出CSV
Table 4. Binary logistic regression analysis of neonatal jaundice
Values Univariate analysis multivariate analysis B OR 95% CI P−value B OR 95% CI P−value HCV RNA(+) 0.82 2.28 1.369−3.799 0.002 0.747 2.111 1.242−3.588 0.006 Nuchal cords (n, %) −0.78 0.46 0.263−0.791 0.005 −0.741 0.476 0.269−0.844 0.011 Premature rupture of membranes (n, %) 1.04 2.82 1.130−7.016 0.026 0.889 2.433 0.948−6.245 0.064 Neonatal hypoglycemia (n, %) −0.76 0.47 0.275−0.797 0.005 −0.750 0.473 0.272−0.821 0.008 Note. Group A, anti−HCV(−) and HCV RNA(−); Group B: anti−HCV(+) and HCV RNA(−); Group C: anti−HCV (+) and HCV RNA (+). P < 0.05 indicates a statistically significant difference.
下载: 导出CSV
-
[1] Saab S, Kullar R, Gounder P. The urgent need for hepatitis C screening in pregnant women: a call to action. Obstet Gynecol, 2020; 135, 773−7. doi: 10.1097/AOG.0000000000003704 [2] Cafardi JM, Lin HT, Lange L, et al. Vertical transmission of hepatitis C virus among women with a history of injection opioid use. Clin Infect Dis, 2024; 79, 701−4. doi: 10.1093/cid/ciae177 [3] World Health Organization. Global health sector strategy on viral hepatitis 2016-2021. Towards ending viral hepatitis. World Health Organization. 2016. [4] Yew KC, Tan QR, Lim PC, et al. Assessing the impact of direct-acting antivirals on hepatitis C complications: a systematic review and meta-analysis. Naunyn Schmiedebergs Arch Pharmacol, 2024; 397, 1421−31. doi: 10.1007/s00210-023-02716-x [5] Vaziri A, Gimson A, Agarwal K, et al. Liver transplant listing for hepatitis C-associated cirrhosis and hepatocellular carcinoma has fallen in the United Kingdom since the introduction of direct-acting antiviral therapy. J Viral Hepat, 2019; 26, 231−5. doi: 10.1111/jvh.13022 [6] Rana R, Dangal R, Singh Y, et al. Hepatitis C virus infection in pregnancy and children: its implications and treatment considerations with directly acting antivirals: a review. JNMA J Nepal Med Assoc, 2021; 59, 942−53. doi: 10.31729/jnma.5501 [7] Jhaveri R, Yee LM, Antala S, et al. Responsible inclusion of pregnant individuals in eradicating HCV. Hepatology, 2021; 74, 1645−51. doi: 10.1002/hep.31825 [8] Hood RB, Norris AH, Shoben A, et al. Forecasting hepatitis C virus status for children in the United States: a modeling study. Clin Infect Dis, 2024; 79, 443−50. doi: 10.1093/cid/ciae157 [9] Jin HZ, Huang DM, Guan XJ. Practical neonatology. 3rd ed. People's Medical Publishing House. 2003. (In Chinese) [10] Terrault NA, Bzowej NH, Chang KM, et al. AASLD guidelines for treatment of chronic hepatitis B. Hepatology, 2016; 63, 261−83. doi: 10.1002/hep.28156 [11] Ito M, Liu J, Fukasawa M, et al. Induction of phospholipase A2 group 4C by HCV infection regulates lipid droplet formation. JHEP Rep, 2025; 7, 101225. doi: 10.1016/j.jhepr.2024.101225 [12] Wu P, Wang Y, Ye Y, et al. Liver biomarkers, lipid metabolites, and risk of gestational diabetes mellitus in a prospective study among Chinese pregnant women. BMC Med, 2023; 21, 150. doi: 10.1186/s12916-023-02818-6 [13] Liu H, Zhang LB, Cheng HY, et al. The associations of maternal liver biomarkers in early pregnancy with the risk of gestational diabetes mellitus: a prospective cohort study and Mendelian randomization analysis. Front Endocrinol, 2024; 15, 1396347. doi: 10.3389/fendo.2024.1396347 [14] Khadir F, Rahimi Z, Vaisi-Raygani A, et al. Gestational diabetes mellitus (GDM), hypothyroidism, and gene variants (Keap1 Rs11085735) in patients with preeclampsia. Rep Biochem Mol Biol, 2022; 11, 493−501. [15] Wang SX, Cui ZF, Yang HX. Interactions between host and gut microbiota in gestational diabetes mellitus and their impacts on offspring. BMC Microbiol, 2024; 24, 161. doi: 10.1186/s12866-024-03255-y [16] Velloso LA, Folli F, Saad MJ. TLR4 at the crossroads of nutrients, gut microbiota, and metabolic inflammation. Endocr Rev, 2015; 36, 245−71. doi: 10.1210/er.2014-1100 [17] Tacke F, Boeker KHW, Klinker H, et al. Baseline risk factors determine lack of biochemical response after SVR in chronic hepatitis C patients treated with DAAs. Liver Int, 2020; 40, 539−48. doi: 10.1111/liv.14186 [18] Tacke F, Klinker H, Boeker KHW, et al. Elevated liver enzymes predict morbidity and mortality despite antiviral cure in patients with chronic hepatitis C: data from the German hepatitis C-registry. Hepatol Commun, 2022; 6, 2488−95. doi: 10.1002/hep4.2015 [19] Krupa P, Wein H, Zemmrich LS, et al. Pregnancy-related factors induce immune tolerance through regulation of sCD83 release. Front Immunol, 2024; 15, 1452879. doi: 10.3389/fimmu.2024.1452879 [20] Bellarosa C, Bedogni G, Bianco A, et al. Association of serum bilirubin level with metabolic syndrome and non-alcoholic fatty liver disease: a cross-sectional study of 1672 obese children. J Clin Med, 2021; 10, 2812. doi: 10.3390/jcm10132812 [21] Wake T, Tateishi R, Fukumoto T, et al. Improved liver function in patients with cirrhosis due to chronic hepatitis C virus who achieve sustained virologic response is not accompanied by increased liver volume. PLoS One, 2020; 15, e0231836. doi: 10.1371/journal.pone.0231836 [22] Nakajima T, Karino Y, Hige S, et al. Factors affecting the recovery of hepatic reserve after sustained virologic response by direct-acting antiviral agents in chronic hepatitis C virus-infected patients. J Gastroenterol Hepatol, 2021; 36, 367−75. doi: 10.1111/jgh.15280 [23] Zuñiga-Aguilar E, Ramírez-Fernández O. Fibrosis and hepatic regeneration mechanism. Transl Gastroenterol Hepatol, 2022; 7, 9. doi: 10.21037/tgh.2020.02.21 [24] Pan CQ, Zhu BS, Xu JP, et al. Pregnancy and fetal outcomes of chronic hepatitis C mothers with viremia in China. World J Gastroenterol, 2022; 28, 5023−35. doi: 10.3748/wjg.v28.i34.5023 [25] Brits H, Adendorff J, Huisamen D, et al. The prevalence of neonatal jaundice and risk factors in healthy term neonates at National District Hospital in Bloemfontein. Afr J Prim Health Care Fam Med, 2018; 10, a1582. [26] Belay HG, Debebe GA, Ayele AD, et al. Determinants of neonatal jaundice in Ethiopia: a systematic review and meta-analysis. World J Pediatr, 2022; 18, 725−33. doi: 10.1007/s12519-022-00597-3 [27] Bante A, Ahmed M, Degefa N, et al. Neonatal jaundice and associated factors in public hospitals of southern Ethiopia: a multi-center cross-sectional study. Heliyon, 2024; 10, e24838. doi: 10.1016/j.heliyon.2024.e24838 [28] Ding JH, Maxwell A, Adzibolosu N, et al. Mechanisms of immune regulation by the placenta: role of type I interferon and interferon-stimulated genes signaling during pregnancy. Immunol Rev, 2022; 308, 9−24. doi: 10.1111/imr.13077 [29] Nie QH, Gao LH, Cheng YQ, et al. Hepatitis C virus infection of human cytotrophoblasts cultured in vitro. J Med Virol, 2012; 84, 1586−92. doi: 10.1002/jmv.23380 [30] Napodano C, Ciasca G, Chiusolo P, et al. Serological and molecular characterization of hepatitis C virus-related cryoglobulinemic vasculitis in patients without cryoprecipitate. Int J Mol Sci, 2023; 24, 11602. doi: 10.3390/ijms241411602 [31] de Souza Lima B, Sanches APV, Ferreira MS, et al. Maternal-placental axis and its impact on fetal outcomes, metabolism, and development. Biochim Biophys Acta (BBA)-Mol Basis Dis, 2024; 1870, 166855. doi: 10.1016/j.bbadis.2023.166855 [32] Diniz MS, Hiden U, Falcão-Pires I, et al. Fetoplacental endothelial dysfunction in gestational diabetes mellitus and maternal obesity: a potential threat for programming cardiovascular disease. Biochim Biophys Acta (BBA)-Mol Basis Dis, 2023; 1869, 166834. doi: 10.1016/j.bbadis.2023.166834 [33] Ghany MG, Morgan TR, AASLD-IDSA Hepatitis C Guidance Panel. Hepatitis C guidance 2019 update: American association for the study of liver diseases-infectious diseases society of America recommendations for testing, managing, and treating hepatitis C virus infection. Hepatology, 2020; 71, 686−721. doi: 10.1002/hep.31060 -

 点击查看大图
计量
- 文章访问数: 16
- HTML全文浏览量: 7
- PDF下载量: 0
- 被引次数: 0

 Quick Links