

 下载:
下载:

-
High blood pressure (BP) is a leading risk factor for disease burden. Between 1990 and 2019, the number of individuals aged 30–79 years with high BP nearly doubled, increasing from 650 million to 1.28 billion[1]. Guidelines from China, North America, Europe, and Japan all recommend ambulatory BP monitoring (ABPM) for BP assessment, as ABPM provides a more comprehensive evaluation of BP than clinical BP monitoring[2-6]. BP measurements in the clinic may not accurately reflect a person’s BP at home or during sleep[7-10]. In contrast, ambulatory measurements can estimate true BP levels over 24 hours, proving superior to clinical or home BP measurements in predicting death and cardiovascular outcomes[11,12]. Furthermore, ABPM can accurately assess BP variability (BPV), which has been linked to cardiovascular risk[13].
Recent evidence has shown that changes in gut microbial composition are related to human health, and most published microbiome studies have identified reduced gut microbial α-diversity in both human and animal hypertension models[14-16]. Moreover, gut microbial α-diversity is robustly associated with various plasma metabolites[17,18], which are linked to many disease states, including cardiovascular disease (CVD) and hypertension[19-21]. However, most findings were based on 16S ribosomal RNA sequencing, which provides less microbiota information than metagenomic sequencing. Furthermore, previous studies have provided limited information on the associations of α-diversity with ambulatory BP and BPV indices; the potential metabolic traits underlying these relationships also remain unclear. Therefore, using precise measurements to determine how microbial α-diversity and its metabolites regulate BP may provide novel insights into the pathogenesis and treatment of hypertension.
This study explored the associations between gut microbial α-diversity and ambulatory BP indices via metagenomic shotgun sequencing of fecal samples. We investigated whether any association of α-diversity with BP or BPV could be attributed to specific plasma metabolites, and we evaluated how the identified metabolites affect prevalent and incident hypertension in an independent Chinese cohort.
-
The study included 528 participants aged 18–60 years from four Chinese communities (Yuxian, Xinle, Nangong, and Changge); they were recruited for the metabolome, microbiome, and dietary salt intervention (MetaSalt) study in 2019. We excluded individuals with a history of CVD (such as coronary heart disease, stroke, or heart failure), patients with major chronic diseases or diabetes, and patients with stage-2 or more severe hypertension. Participants who took antihypertensive drugs or drugs that affect BP within one month before the screening visit were also excluded. We focused on the baseline data of 523 participants, which included fecal metagenomic sequencing data and targeted plasma metabolomics profiling from the MetaSalt study. Further details can be found in a recent study[22].
The prospective cohort comprised 2,169 Chinese participants randomly selected from the China Multi-Center Collaborative Study of Cardiovascular Epidemiology (China MUCA). Blood samples were collected from the study participants between 2007 and 2008. The cohort was followed up from 2012 to 2014, as described in a previous study[23].
-
Trained staff administered a standard questionnaire to collect information on the sociodemographic characteristics and lifestyle factors of participants from the MetaSalt study. Height and body weight were measured twice in light indoor clothing without shoes, and the body mass index (BMI) was calculated as weight divided by the square of height. A food frequency questionnaire was used to collect dietary information over the past year, and daily intake of the main dietary factors was calculated (Supplementary Table S1). Dietary scores were calculated using the Chinese guideline on healthy lifestyles to prevent cardiometabolic diseases[24]. Next, 24-hour urine samples were collected from each participant, and the 24-hour sodium (UNa) and potassium (UK) levels in each urinary sample were measured (Supplementary Table S1). Participants were instructed to wear smart wristbands (Lifesense mambo HR2) to collect data on sleep patterns throughout the study period. In the prospective cohort, the assessment and definition of major covariates were similar to those in the MetaSalt study. Individuals with a fasting glucose ≥ 126 mg/dL and/or on self-reported current treatment with antidiabetes medication were defined as having diabetes mellitus. Dyslipidemia was defined as total cholesterol ≥ 240 mg/dL, and/or triglyceride ≥ 200 mg/dL, and/or low-density lipoprotein cholesterol ≥ 160 mg/dL, and/or high-density lipoprotein cholesterol < 40 mg/dL. Other covariates included BMI, work-related physical activity, urbanization, smoking status, alcohol consumption, and education level. Detailed information on these covariates has been described previously[23].
-
The MetaSalt study used KANG® KC-2300A to conduct ABPM. BP levels were recorded every 20 min throughout the day or every 30 min at night. The mean 24-hour BP was calculated by averaging the hourly means of all valid readings. Nighttime BP was defined as the average BP from when the participants went to sleep until the time they awakened, while daytime BP was defined as the average BP during the rest of the day. BP variability was defined as the standard deviation (SD) of BP. Trained staff used a professional BP monitor (Omron® HBP-1300) to measure brachial BP for all participants. Measurements were taken after a minimum of 5 min rest in the supine position, and the average of three measurements was used. Each participant was advised to abstain from smoking, exercising, eating, taking medication, or consuming caffeinated beverages for at least 60 min before the office BP measurement. In the prospective cohort, hypertension was defined as systolic BP (SBP) ≥ 140 mmHg, diastolic BP (DBP) ≥ 90 mmHg, and/or taking antihypertensive drugs in the past two weeks.
-
Fecal samples were collected from all MetaSalt study participants, and metagenomic shotgun sequencing was used to determine the gut microbiome composition of each participant. Details of the metagenomic sequencing and quality control methods are presented in the Supplemental Methods. After quality control, we identified 4,567 species in the feces of the study participants. We used the R package “vegan” to calculate microbial α-diversity indices, including Shannon diversity (a measure of species richness and evenness) and the Chao1 index (a measure of species richness), for all 523 participants at the species level. The α-diversity indices were standardized to have a mean of 0 and an SD of 1.
-
Plasma targeted metabolomics profiling was performed for participants of the MetaSalt study and the cohort. We used two metabolomics kits provided by Metabo-Profile Corp. (Shanghai, China) for profiling: 1) the Q300 Kit, which contains 310 metabolites from 12 classes, including bile acids, amino acids, fatty acids, indoles, etc.; and 2) the trimethylamine N-oxide (TMAO) Kit, which contains seven TMAO-related metabolites. The Supplemental Methods present details of the metabolomics profiling. We retained 222 metabolites with a detection rate of >80% for analysis. Metabolite levels were log-transformed and standardized before analysis.
-
We examined the associations between gut microbial α-diversity and 24-hour BP, daytime BP, nighttime BP, and their variability using linear mixed models (LMMs) (R package “lme4”), adjusted for age, sex, BMI, study sites, and the random effect of family. Subsequent analyses included the α-diversity index, which was significantly associated with ambulatory BP and BPV. Statistical significance was set at P < 0.05 (two-sided). We also investigated Chao1 and Shannon index associations with office SBP and DBP adjusted for the same covariates. Moreover, we conducted a sensitivity analysis to examine the robustness of our results by additionally adjusting for several baseline covariates (dietary score, 24-hour UNa and 24-hour UK).
Next, we regressed each plasma metabolite against α-diversity, adjusting for age, sex, BMI, study sites, and the random effect of family in the LMMs. The P values were corrected using the Bonferroni method, with significant associations identified at Bonferroni P < 0.05. We used “MetOrigin” (a tool that can discriminate the origins of microbial metabolites) to determine whether diversity-related metabolites were derived from the microbiota.25 For metabolites that were significantly associated with α-diversity, we further examined their association with each BP index after adjusting for the same covariates. The Benjamini–Hochberg false discovery rate (FDR) was computed to account for multiple testing. Metabolites associated with α-diversity and at least one BP index were further included in the mediation analysis to quantify their potential mediation effect (indirect effect) on the total effect of α-diversity on BP indices. We performed mediation analysis using the R package “mediation” and estimated the direct and indirect effects via quasi-Bayesian approximation with 1,000 simulations. A P value of average causal mediation effects (ACME) < 0.05 was considered significant[26].
Finally, we evaluated the relationship between the identified key plasma metabolites and hypertension in the prospective cohort. A logistic regression model was used to evaluate the association between key metabolites and prevalent hypertension, whereas a Cox proportional hazards regression model was used to evaluate the association between key metabolites and incident hypertension. Both models were adjusted for age, sex, BMI, work-related physical activity, urbanization, smoking status, alcohol consumption, education level, dyslipidemia, and diabetes mellitus. The incident hypertension analysis excluded prevalent hypertension cases and participants without follow-ups. The key metabolites were further classified into quartile groups, and the same models were used to assess their effects on hypertension. Linear trend was tested by assigning participants a median value corresponding to their quartile and assessing this median value as a continuous variable. Owing to the lack of fecal samples in this cohort, the relationship between metabolites and gut microbial diversity could not be explored. All statistical analyses were conducted using R software version 4.1.0 (R Foundation).
-
A total of 523 participants with metagenomic shotgun sequencing and fasting plasma metabolomics data were included in the analysis (Table 1). The average age of the study participants was 48.13 ± 9.28 years, and 37.09% were men. The mean 24-hour, daytime, and nighttime SBP/DBP was 125.31/81.30 mmHg, 129.55/84.86 mmHg, and 116.28/73.79 mmHg, respectively. The prospective cohort comprised 2,169 participants (1,103 prevalent hypertension cases), with a mean SBP/DBP of 134.97/82.82 mmHg; 763 participants without hypertension completed the follow-up survey with an average follow-up duration of 5.2 years, and 193 incident hypertension cases were observed during this period. Supplementary Table S2 presents the demographic information of this cohort.
Table 1. Characteristics of the study participants
Characteristics Overall (n = 523) Male (n = 194) Female (n = 329) Age, years 48.13 (9.28) 47.47 (10.06) 48.52 (8.78) BMI, kg/m2 26.35 (3.53) 26.41 (3.42) 26.31 (3.60) Blood Pressure, mmHg 24-hour SBP 125.31 (12.28) 129.13 (12.36) 123.08 (11.68) 24-hour DBP 81.30 (9.33) 85.28 (9.96) 78.97 (8.10) Daytime SBP 129.55 (12.53) 133.42 (13.07) 127.27 (11. 63) Daytime DBP 84.86 (9.92) 88.86 (10.58) 82.51 (8.71) Nighttime SBP 116.28 (13.59) 119.73 (13.30) 114.26 (13.37) Nighttime DBP 73.79 (9.70) 77.37 (10.40) 71.69 (8.61) Office SBP 129.48 (13.68) 132.32 (12.68) 127.81 (13.99) Office DBP 80.95 (9.81) 84.01 (10.24) 79.14 (9.10) Blood Pressure Variability, mmHg 24-hour SBPV 12.01 (3.46) 12.29 (4.06) 11.84 (3.05) 24-hour DBPV 9.89 (2.72) 10.18 (3.10) 9.72 (2.46) Daytime SBPV 10.42 (3.26) 10.58 (3.54) 10.33 (3.08) Daytime DBPV 8.73 (2.63) 8.90 (2.77) 8.63 (2.54) Nighttime SBPV 8.44 (3.79) 8.45 (3.89) 8.43 (3.73) Nighttime DBPV 6.88 (2.77) 6.99 (2.68) 6.82 (2.82) Note. Data are presented as mean (standard deviation). BMI, body mass index; DBP, diastolic blood pressure; DBPV, diastolic blood pressure variability; SBP, systolic blood pressure; SBPV, systolic blood pressure variability. -
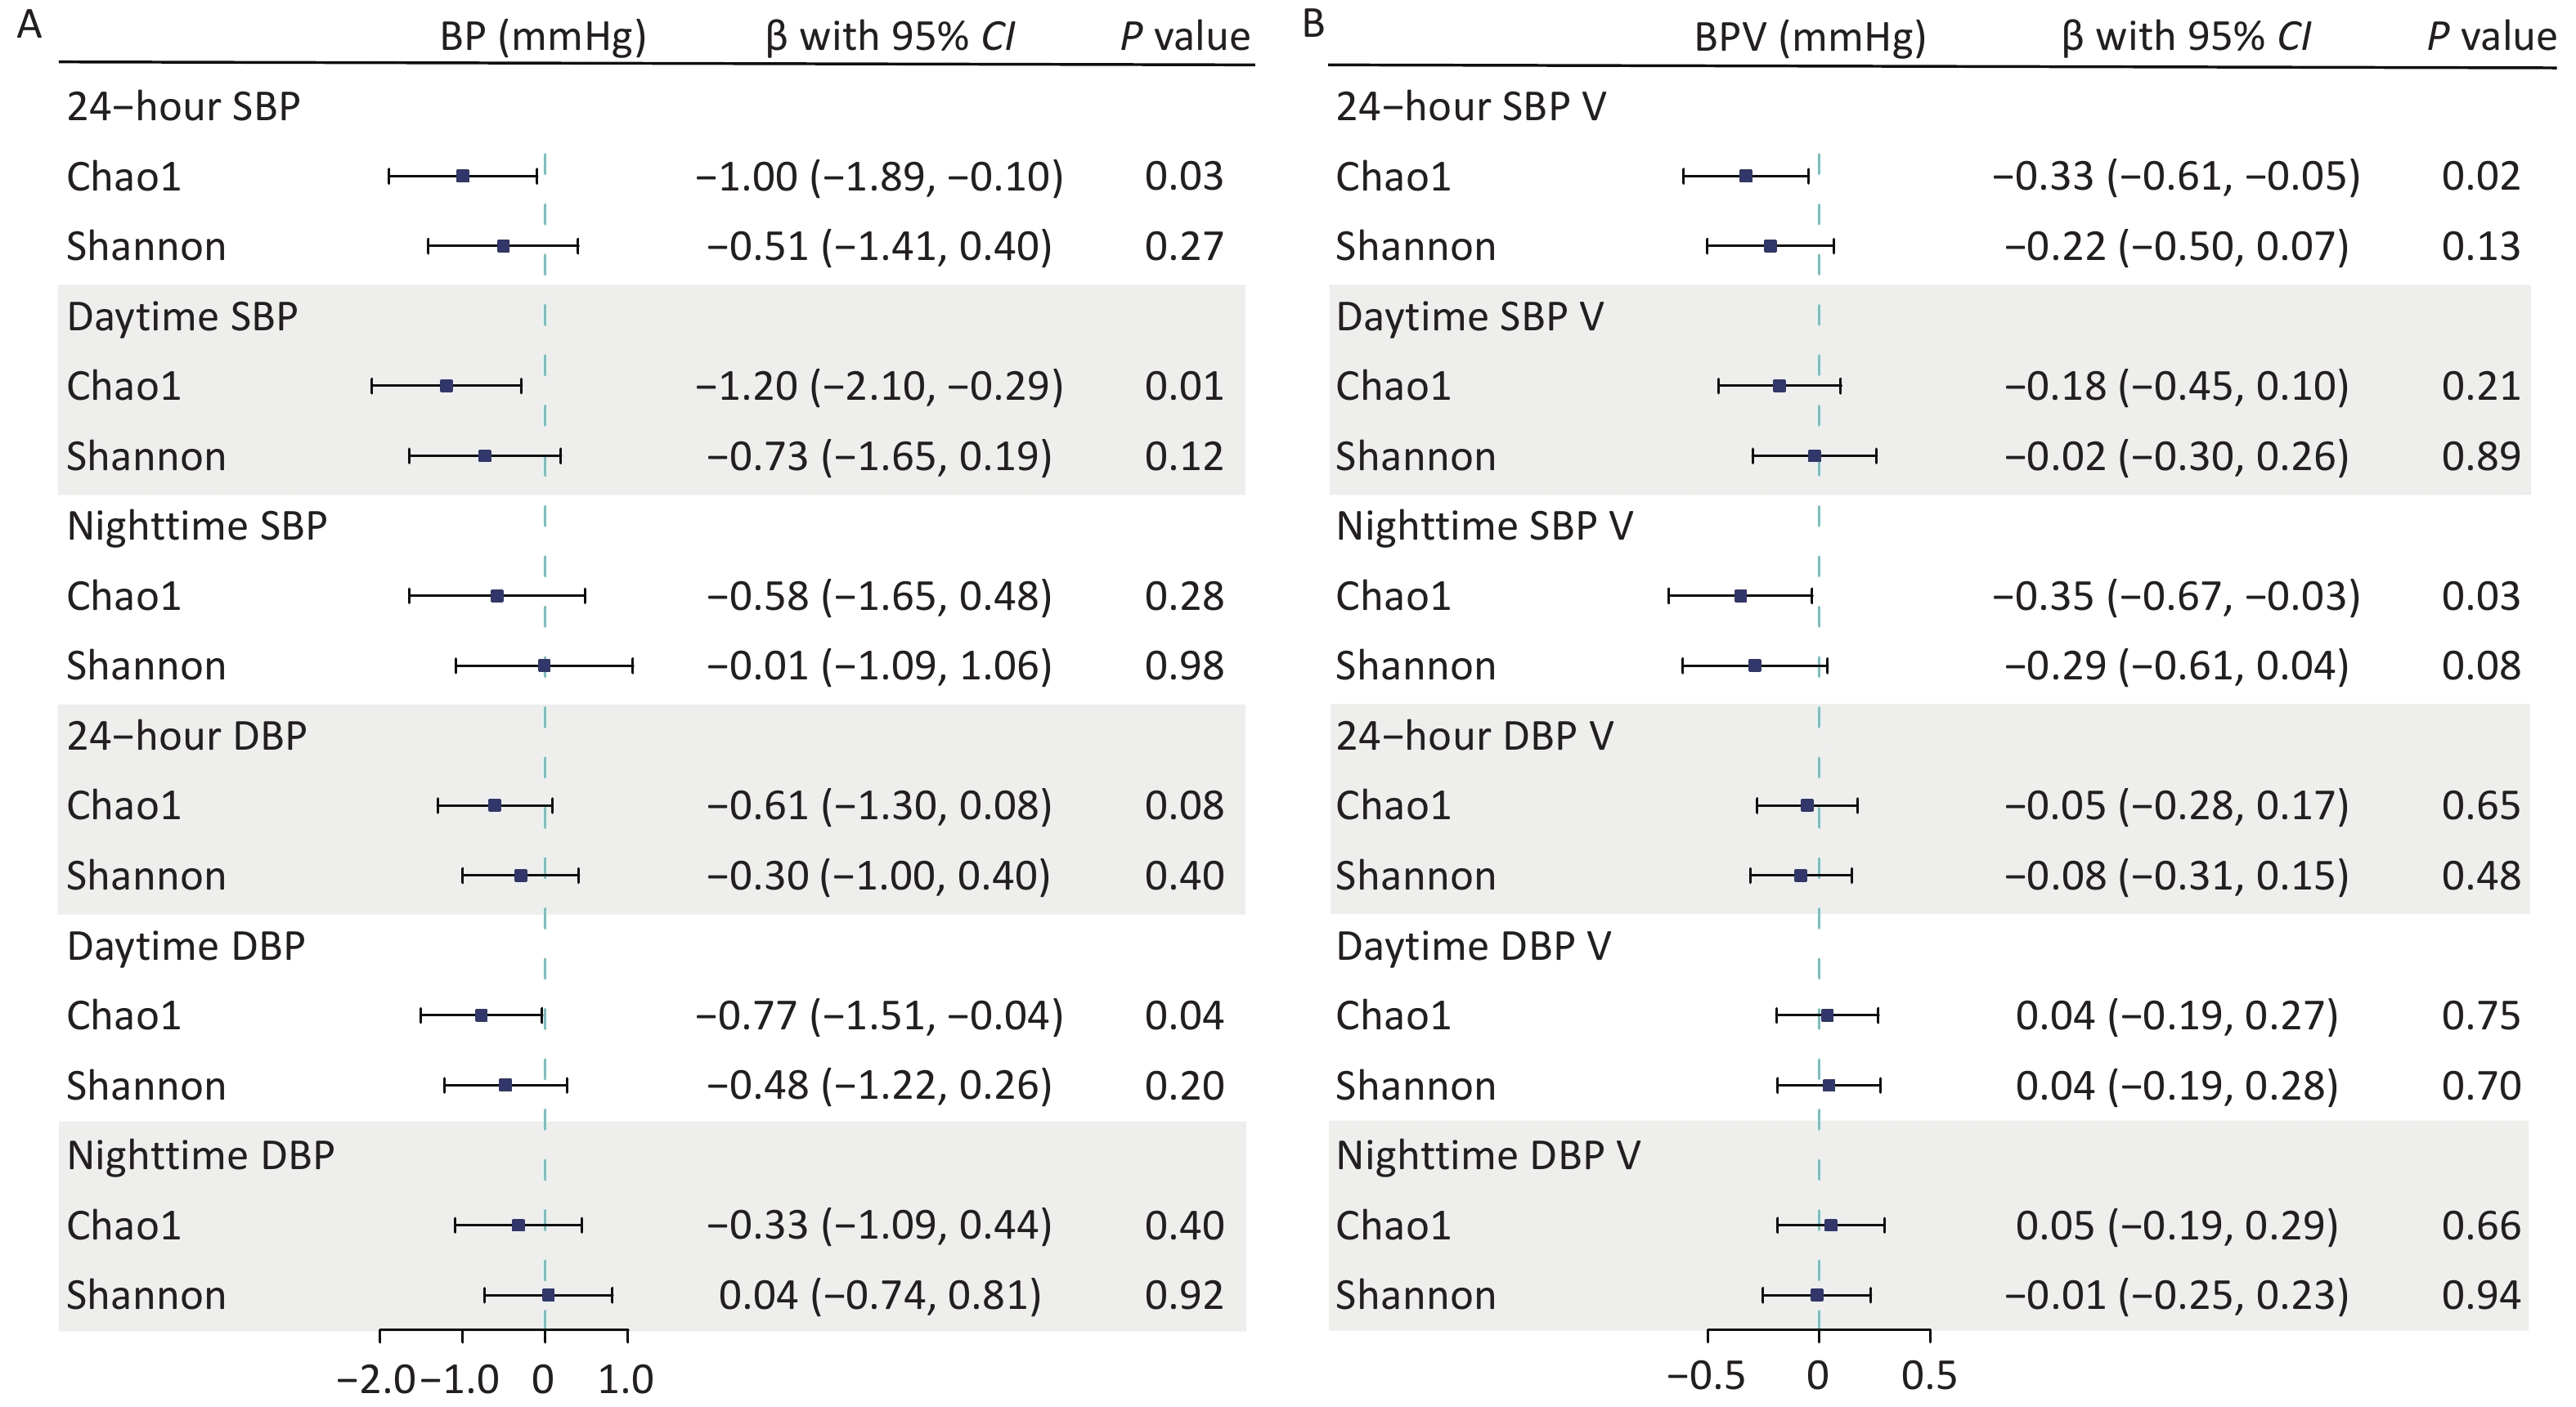
We found a negative association between gut microbial α-diversity and BP indices, particularly between gut microbial richness (Chao1) and daytime SBP. The multivariable adjusted LMMs showed that each 1-SD unit increase in gut microbial richness was associated with lowered 24-hour SBP (β [95% confidence interval (CI)] = –1.00 [–1.89, –0.10] mmHg; P = 0.03), daytime SBP (β [95% CI] = –1.20 [–2.10, –0.29] mmHg; P = 0.01), and daytime DBP (β [95% CI] = –0.77 [–1.51, –0.04] mmHg; P = 0.04). However, it was not significantly associated with nighttime BP (Figure 1A). The inverse correlations between the Shannon diversity index and BP were relatively weak, with no significant associations. Similarly, gut microbial richness was negatively associated with SBP variability (SBPV). Each 1-SD unit increase in gut microbial richness was inversely associated with 24-hour SBPV (β [95% CI] = –0.33 [–0.61, –0.05] mmHg; P = 0.02) and nighttime SBPV (β [95% CI] = –0.35 [–0.67, –0.03] mmHg; P = 0.03) (Figure 1B). Further adjustments for covariates in sensitivity analyses did not alter our main findings (Supplementary Table S3).
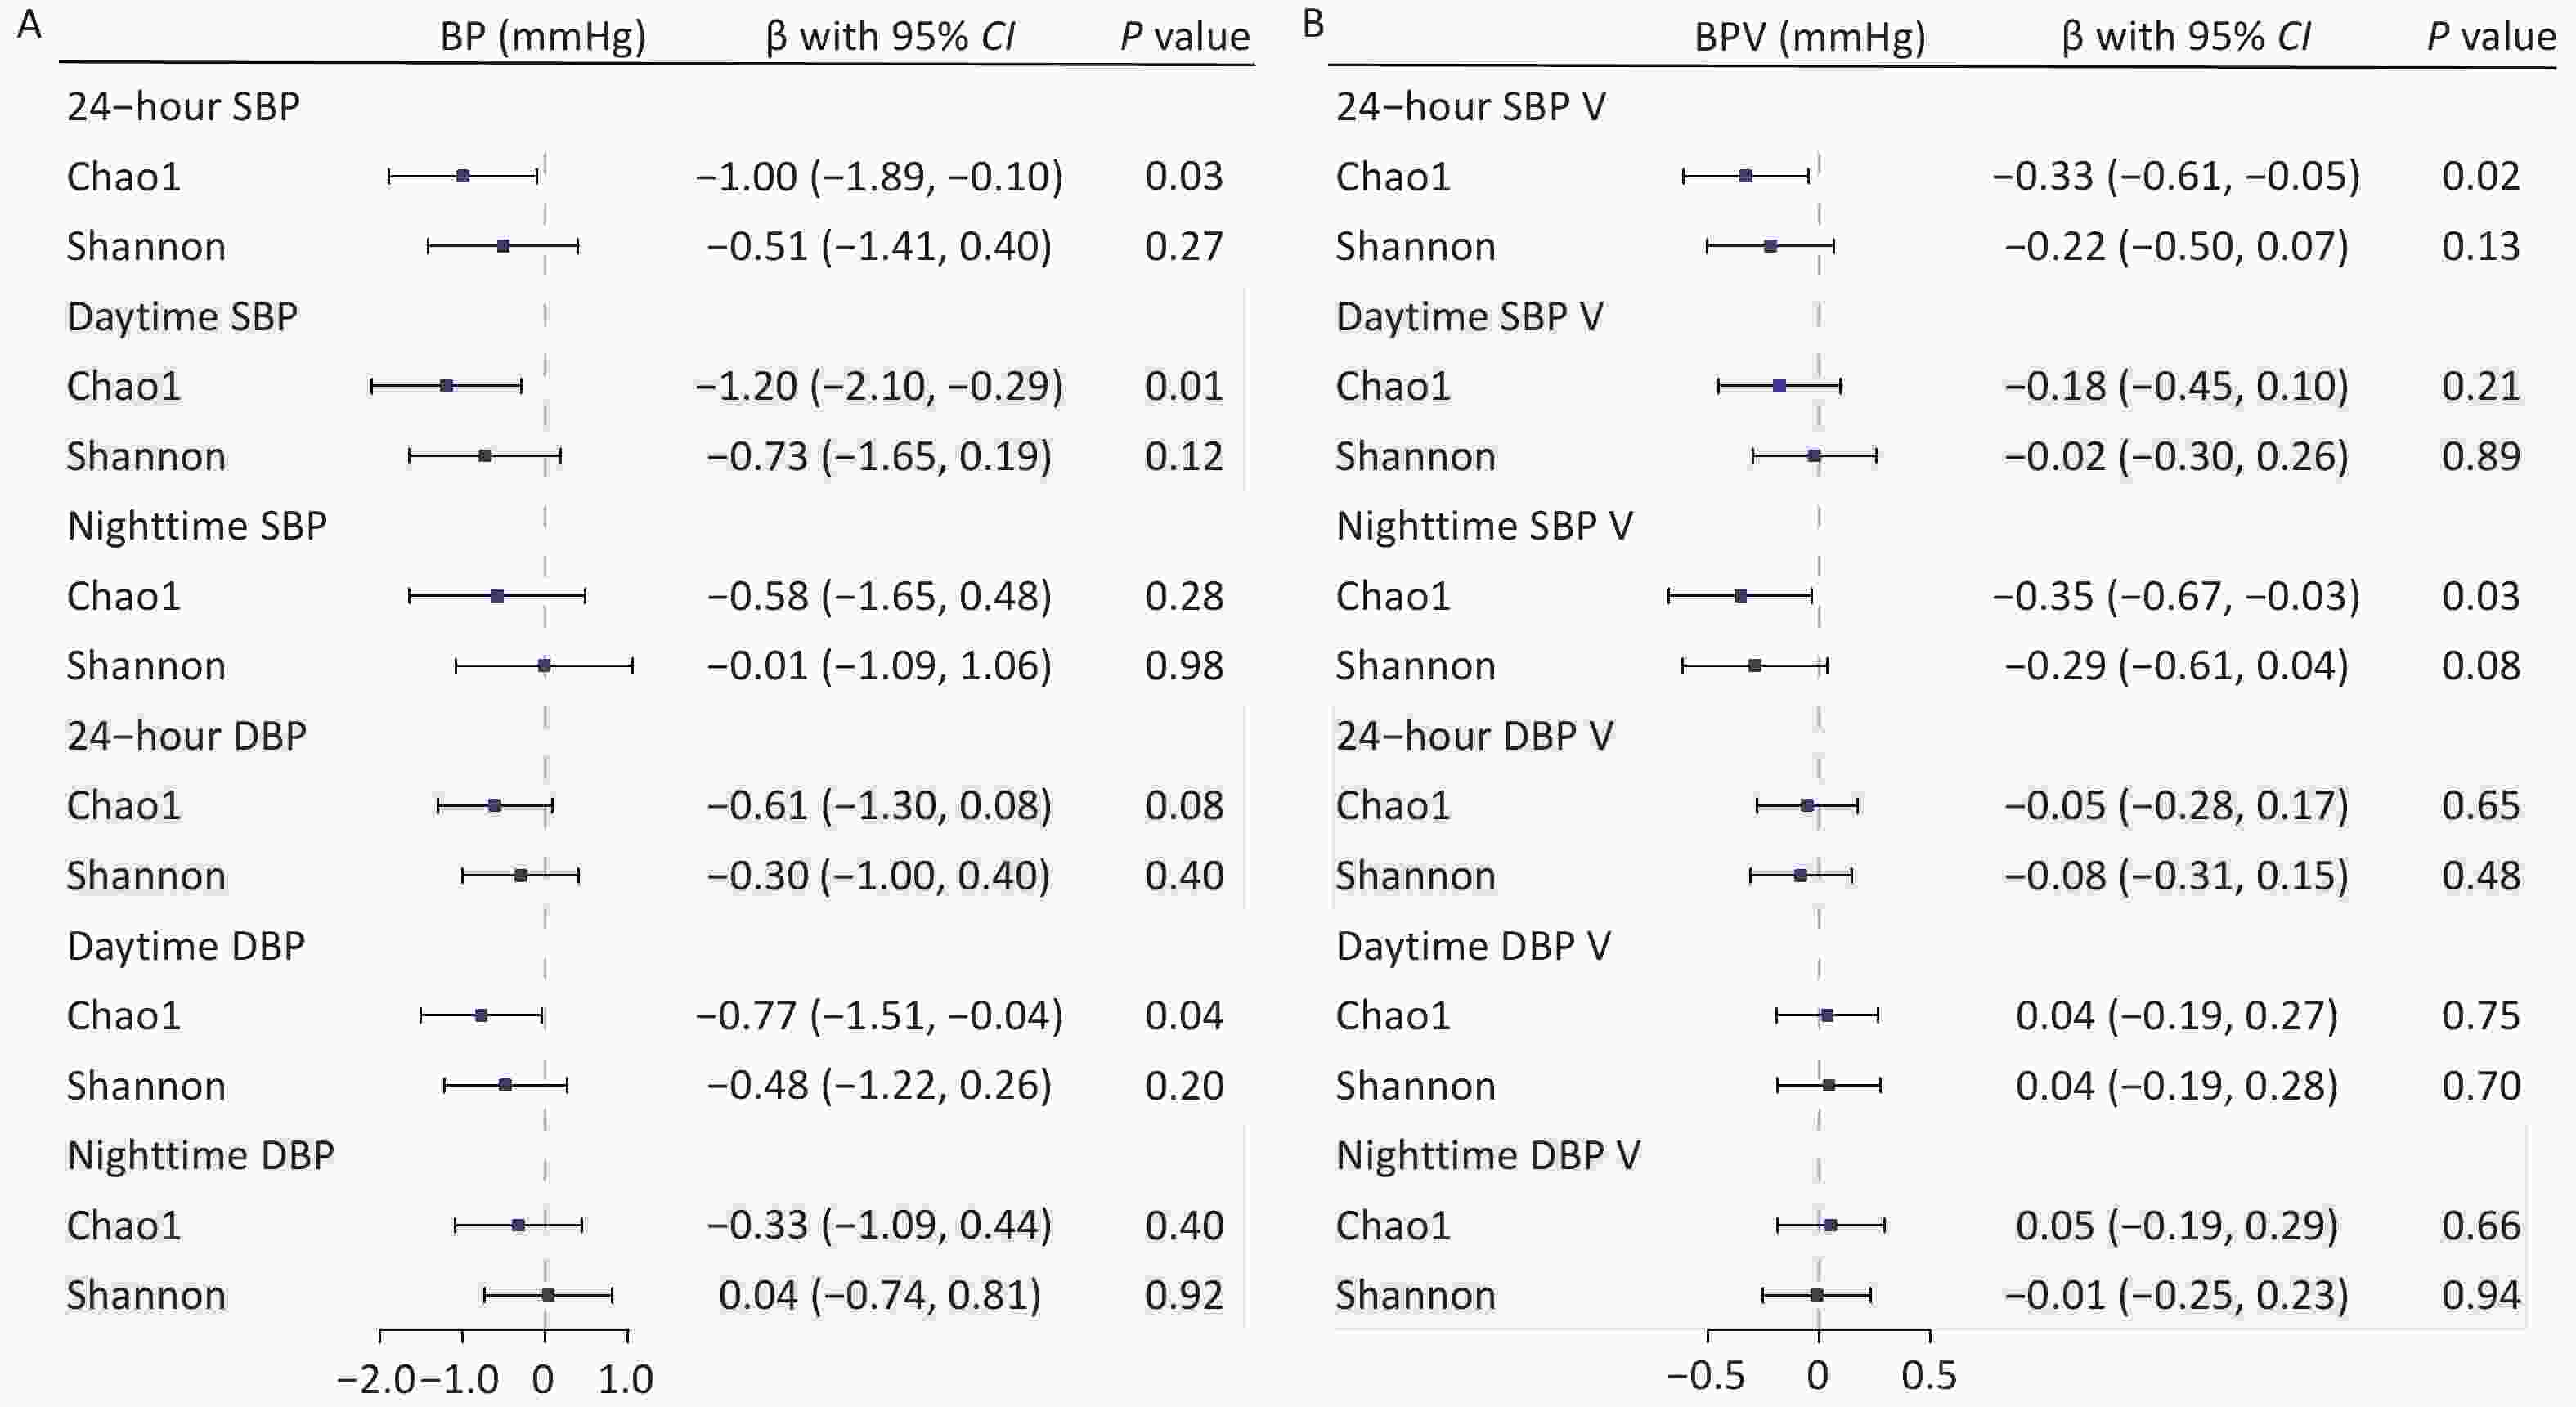
Figure 1. Associations of gut microbial α-diversity with blood pressure (BP) and BP variability (BPV) indices. Linear mixed models were used to estimate the effect sizes and 95% confidence intervals of microbial α-diversity on BP (A) and BPV indices (B). Covariates included age, sex, body mass index, study sites, and the random effect of family. BP, blood pressure; BPV, blood pressure variability; CI, confidence interval; DBP, diastolic blood pressure; SBP, systolic blood pressure.
Moreover, both α-diversity indices were negatively associated with office BP (Supplementary Table S4). Each 1-SD unit increase in gut microbial richness significantly decreased office SBP (β [95% CI] = –1.71 [–2.73, –0.69] mmHg; P = 0.01) and office DBP (β [95% CI] = –0.76 [–1.50, –0.03] mmHg; P = 0.04). Similarly, each 1-SD unit increase in Shannon diversity decreased office SBP (β [95% CI] = –1.16 [–2.20, –0.13] mmHg; P = 0.03).
-
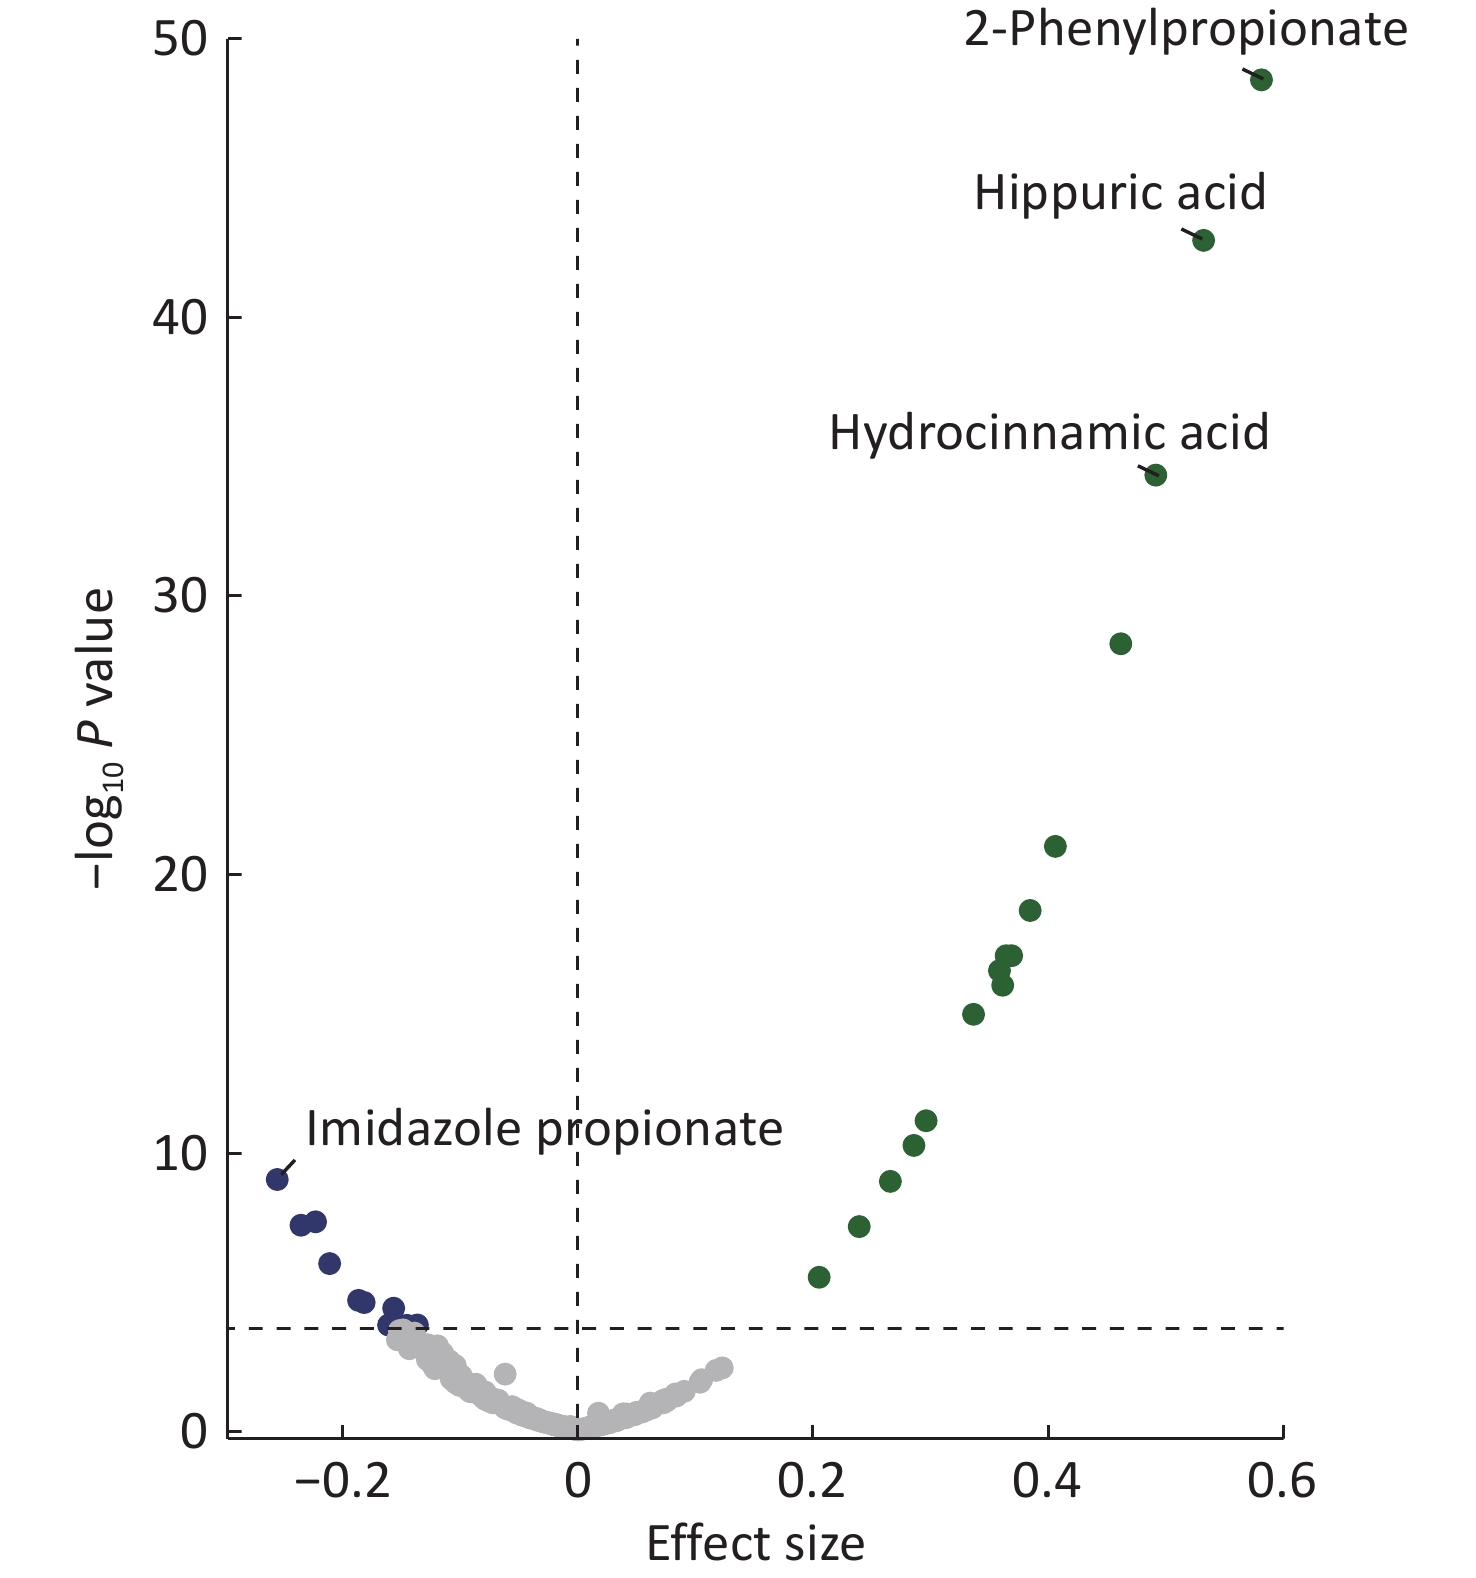
Among the 222 plasma metabolites measured for each participant, gut microbial richness was positively associated with 16 metabolites and negatively associated with 10 metabolites in the LMMs, adjusted for age, sex, BMI, study sites, and the random effect of family (Bonferroni P < 0.05) (Figure 2 and Supplementary Table S5). Twenty richness-related metabolites were annotated to a microbiota source by “MetOrigin” (Supplementary Table S6). Among them, 2-phenylpropionate (Bonferroni P = 7.78 × 10–47), hippuric acid (Bonferroni P = 4.49 × 10–41), and hydrocinnamic acid (Bonferroni P = 1.20 × 10⁻³²) had the strongest positive associations with Chao1. In contrast, the metabolite imidazole propionate (Bonferroni P = 2.29×10⁻⁷) had the strongest negative association with Chao1.
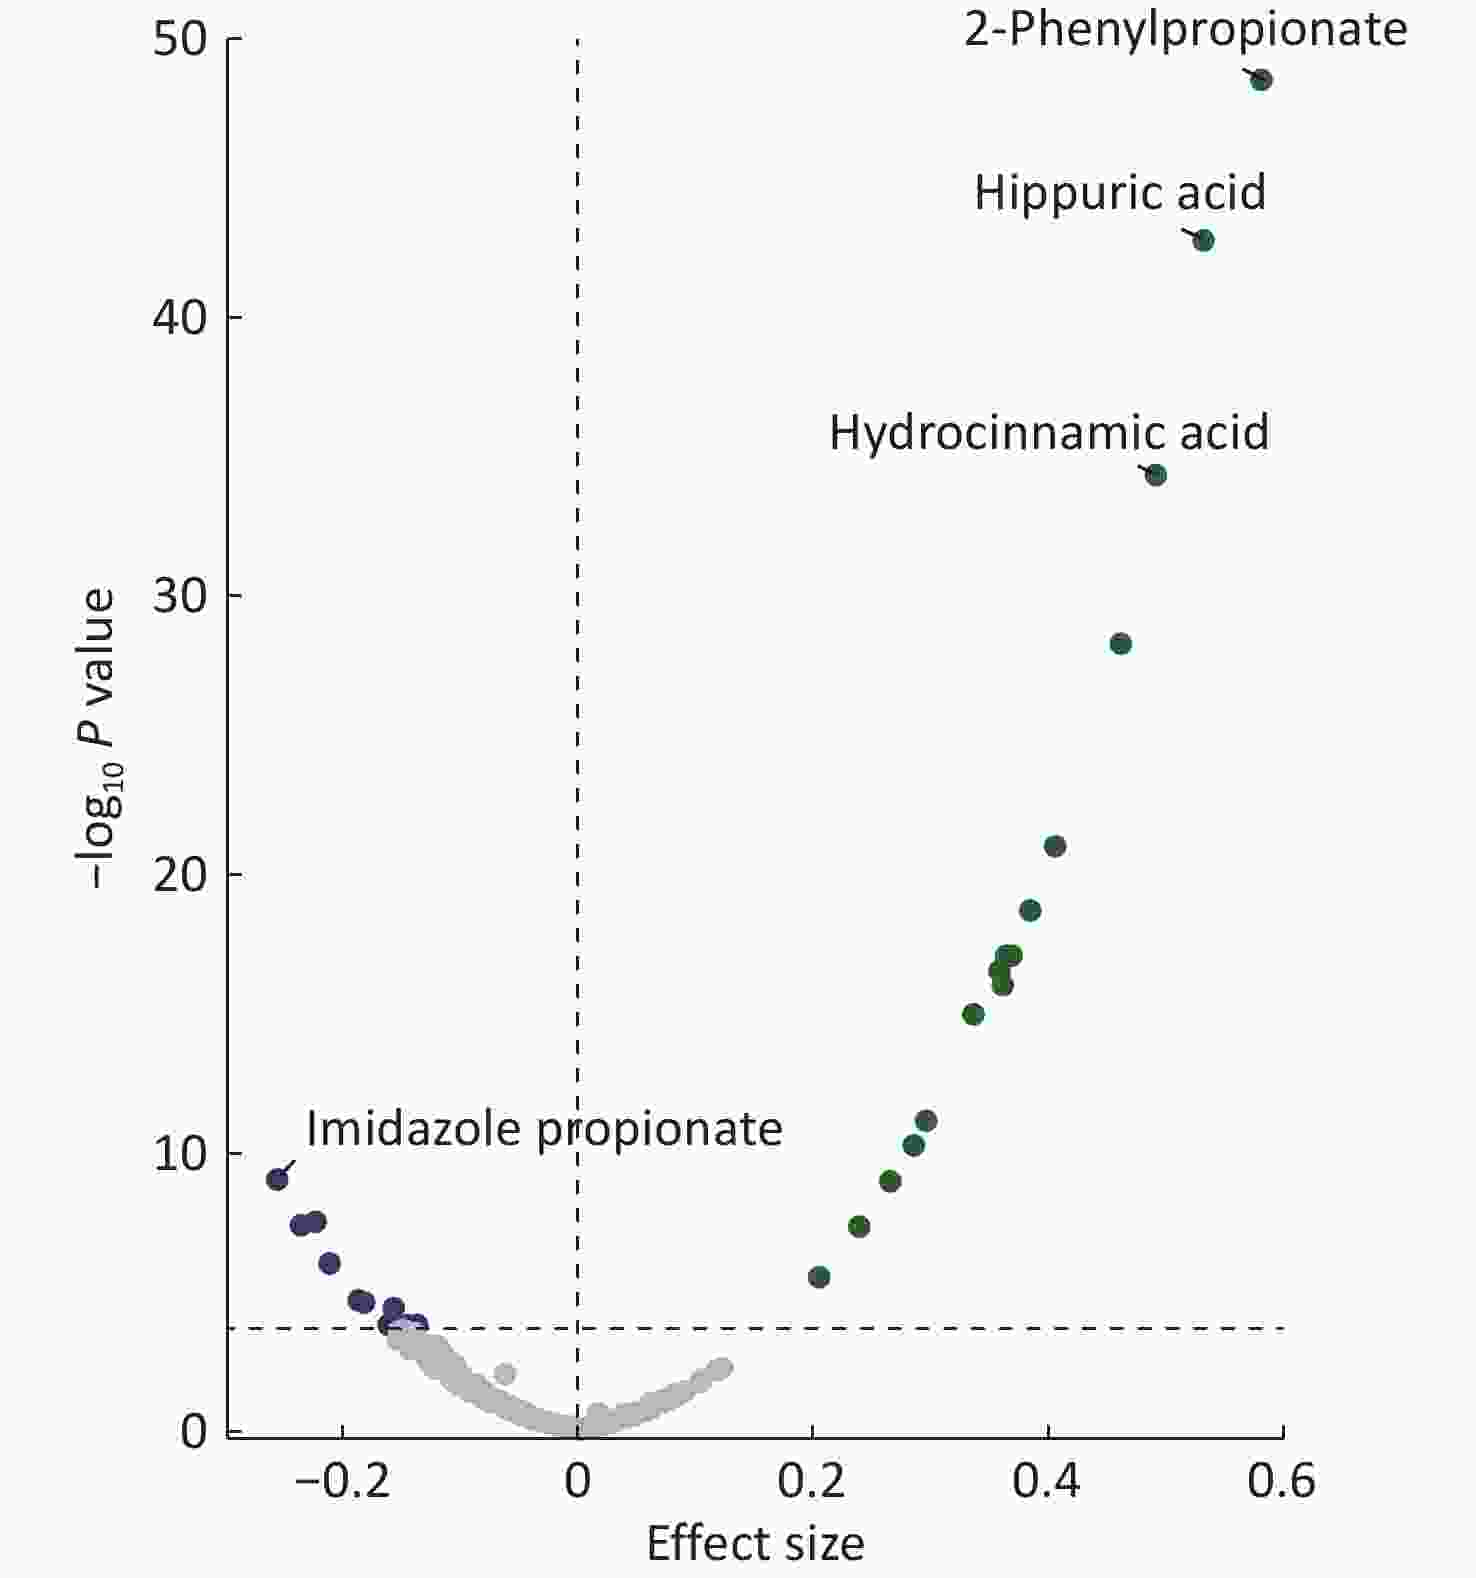
Figure 2. Associations between gut microbial richness and plasma metabolites. Linear mixed models adjusted for age, sex, body mass index, study sites, and the random effect of family were used. All metabolites above the dashed line are significant after multiple-hypothesis correction (Bonferroni P < 0.05, two-sided). Labels are shown for the most positively and negatively correlated metabolites.
-
We evaluated whether the relationship between gut microbial richness and BP or BPV was due to specific microbial metabolic outputs in the blood. We first explored the associations between richness-related metabolites and BP indices and found that imidazole propionate, homovanillic acid, 2-hydroxy-3-methylbutyric acid, and hydrocinnamic acid were significantly associated with at least one BP index (FDR < 0.05) (Supplementary Tables S7–S10).
We performed mediation analyses of the four metabolites and determined that three metabolites mediated the association between gut microbial richness and BP. However, one metabolite mediated the association between gut microbial richness and BPV (Table 2). Specifically, imidazole propionate, homovanillic acid, and 2-hydroxy-3-methylbutyric acid mediated 38.7%, 17.8%, and 14.1%, respectively, of the total effect of gut microbial richness on 24-hour SBP; they also mediated 30.9%, 18.5% and 17.1%, respectively, of the total effect of gut microbial richness on daytime SBP. Homovanillic acid and 2-hydroxy-3-methylbutyric acid mediated 18.6% and 20.5%, respectively, of the total effect of gut microbial richness on daytime DBP. Among these metabolites, imidazole propionate fully mediated the association between gut microbial richness and SBP. Imidazole propionate was significantly associated with higher 24-hour SBP (β [95% CI] = 1.62 [0.67, 2.58] mmHg per 1-SD increment for imidazole propionate; P = 7.41 × 10⁻⁴) and daytime SBP (β [95% CI] = 1.50 [0.53, 2.46] mmHg; P = 2.59 × 10⁻³) when adjusting for the Chao1 index in the LMM (Supplementary Table S11). We found no significant association between the Chao1 index and 24-hour SBP and daytime SBP after adjusting for imidazole propionate.
Table 2. Mediation analysis of metabolites on the associations between gut microbial richness and ambulatory BP indices
Mediation pathway Total effect
β (95% CI)Direct effect
β (95% CI)Indirect effect
β (95% CI)Proportion
mediated, %P value Chao1→Imidazole propionate→24-hour SBP −1.01 (−1.88, −0.13) −0.61 (−1.53, 0.34) −0.40 (−0.72, −0.13) 38.7 0.03 Chao1→2-Hydroxy-3-methylbutyric acid→24-hour SBP −1.00 (−1.90, −0.11) −0.85 (−1.73, 0.01) −0.15 (−0.34, −0.01) 14.1 0.04 Chao1→Homovanillic acid→24-hour SBP −1.00 (−1.90, −0.09) −0.81 (−1.76, 0.12) −0.19 (−0.40, −0.02) 17.8 0.04 Chao1→Imidazole propionate→Daytime SBP −1.21 (−2.11, −0.28) −0.83 (−1.71, 0.12) −0.38 (−0.66, −0.13) 30.9 0.01 Chao1→2-Hydroxy-3-methylbutyric acid→Daytime SBP −1.20 (−2.11, −0.30) −0.99 (−1.91, −0.14) −0.21 (−0.42, −0.04) 17.1 0.02 Chao1→Homovanillic acid→Daytime SBP −1.21 (−2.13, −0.26) −0.99 (−1.92, −0.05) −0.22 (−0.43, −0.05) 18.5 0.02 Chao1→2-Hydroxy-3-methylbutyric acid→Daytime DBP −0.79 (−1.55, −0.05) −0.63 (−1.37, 0.11) −0.17 (−0.33, −0.05) 20.5 0.04 Chao1→Homovanillic acid→Daytime DBP −0.79 (−1.51, −0.08) −0.63 (−1.37, 0.10) −0.15 (−0.32, −0.02) 18.6 0.04 Chao1→Hydrocinnamic acid→24-hour SBPV −0.33 (−0.60, −0.05) −0.10 (−0.42, 0.22) −0.23 (−0.40, −0.06) 67.4 0.02 Note. Age, sex, BMI, study sites, and the random effect of family were adjusted in the mediation analysis. DBP, diastolic blood pressure; SBP, systolic blood pressure; SBPV, systolic blood pressure variability. Regarding BP variability, we discovered that hydrocinnamic acid fully mediated the association between gut microbial richness and 24-hour SBPV, accounting for 67.4% of the mediation effect. Each 1-SD unit increase in hydrocinnamic acid was associated with a decrease in 24-hour SBPV (β [95% CI] = –0.48 [–0.81, –0.15] mmHg; P = 4.90 × 10⁻³) when adjusting for the Chao1 index (Supplementary Table S11). Meanwhile, the direct effect of the Chao1 index on 24-hour SBPV was attenuated (β [95% CI] = –0.10 [–0.42, 0.22] mmHg; P = 0.55) when adjusting for hydrocinnamic acid.
-
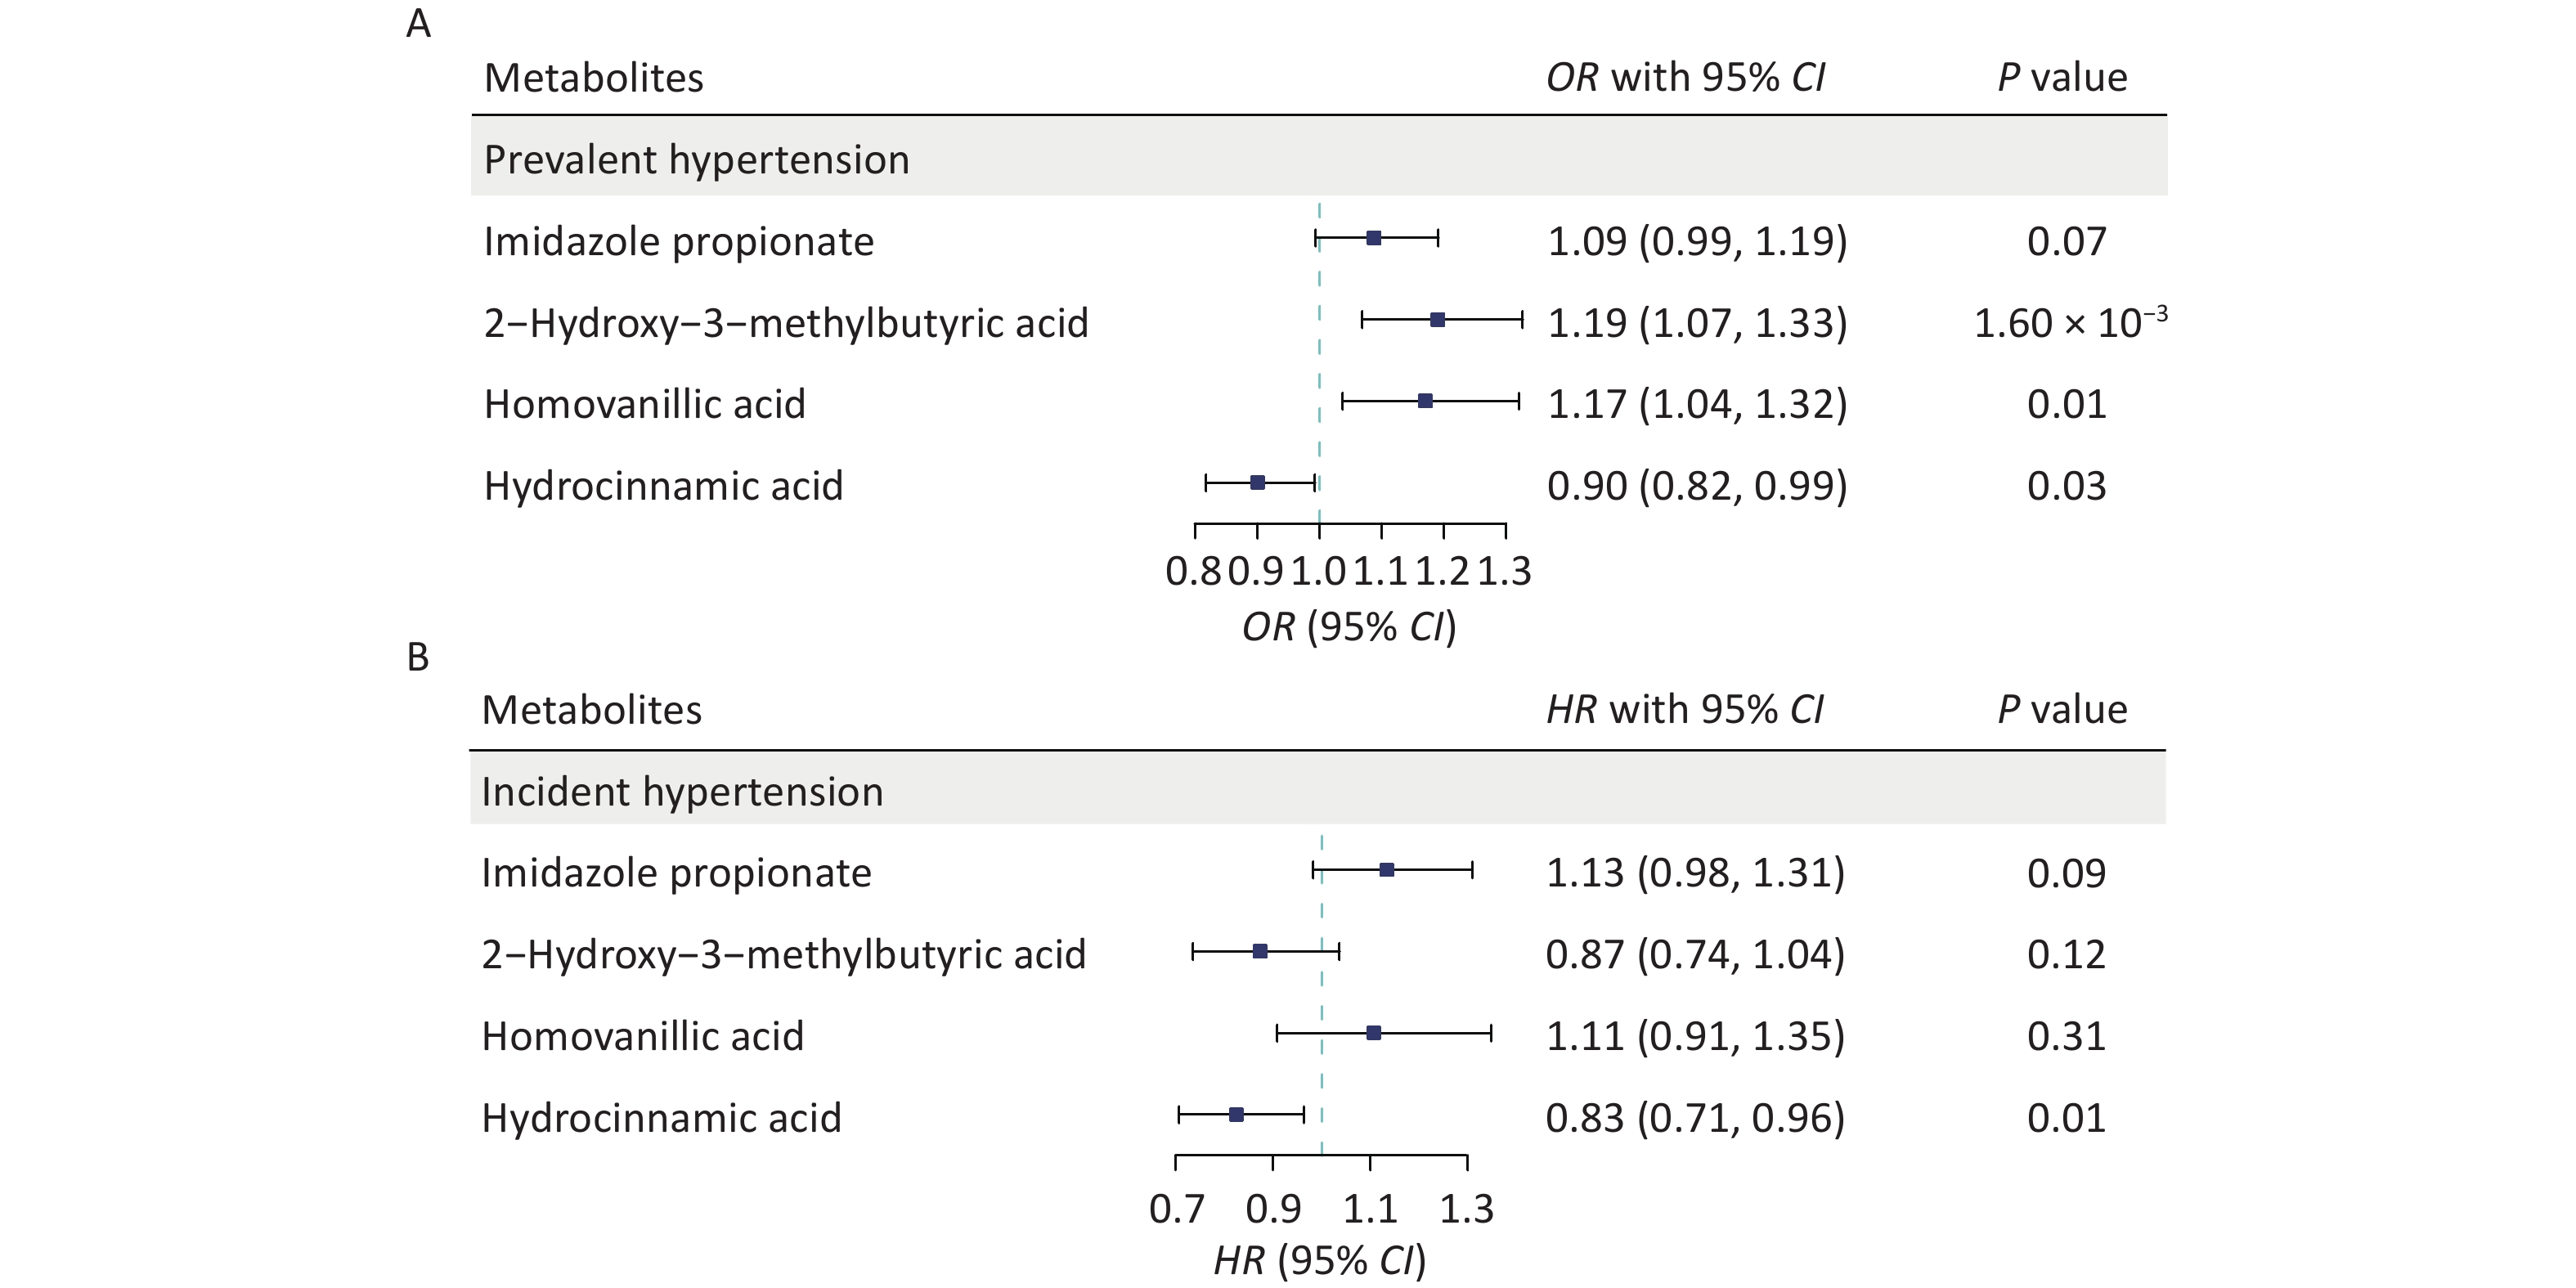
We determined the effects of these four metabolites on both prevalent and incident hypertension in the prospective cohort to evaluate the role of the identified key metabolites in hypertension. Figure 3A shows that each 1-SD unit increase in homovanillic acid (odds ratio [OR] [95% CI] = 1.17 [1.04, 1.32], P = 0.01), 2-hydroxy-3-methylbutyric acid (OR [95% CI] = 1.19 [1.07, 1.33], P = 1.60 × 10⁻³), and hydrocinnamic acid (OR [95% CI] = 0.90 [0.82, 0.99], P = 0.03) was associated with prevalent hypertension. An increase in hydrocinnamic acid levels also reduced the risk of incident hypertension (hazard ratio [HR] [95% CI] = 0.83 [0.71, 0.96]; P = 0.01) (Figure 3B). Meanwhile, imidazole propionate was marginally associated with both prevalent (OR [95% CI] = 1.09 [0.99, 1.19], P = 0.07) and incident hypertension (HR [95% CI] = 1.13 [0.98, 1.31], P = 0.09).
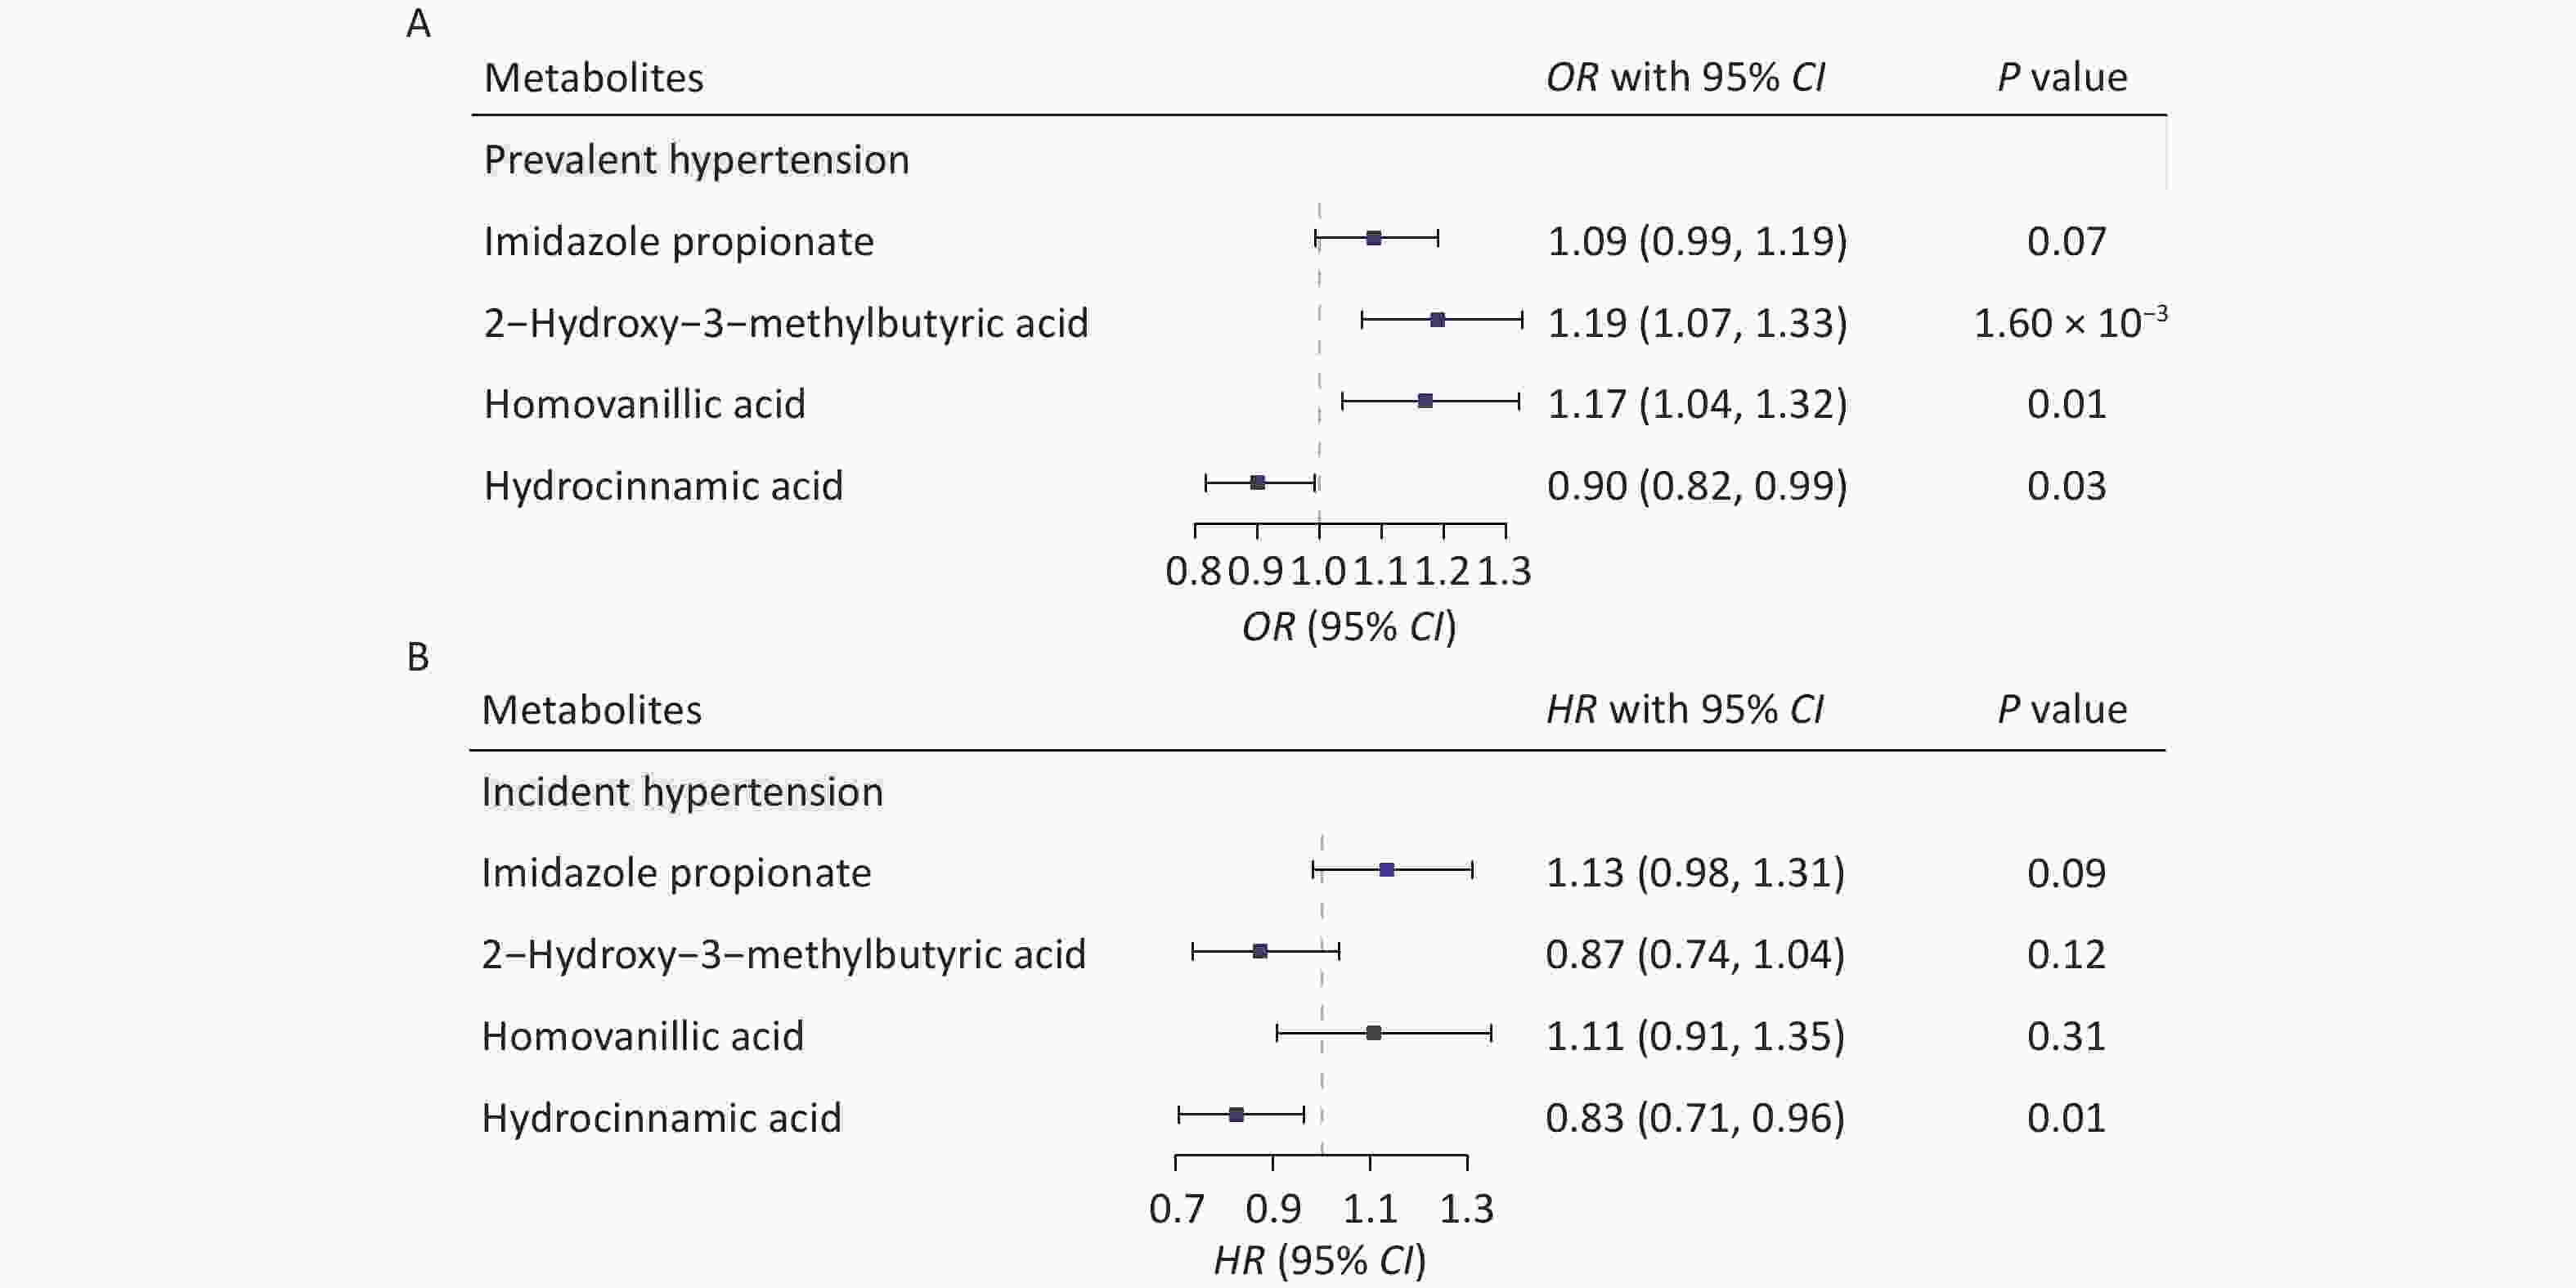
Figure 3. Identified metabolites and the risk of hypertension in the prospective cohort. Associations of the four key metabolites with both prevalent(A) and incident (B) hypertension. Covariates included age, sex, body mass index, physical activity, urbanization, smoking status, alcohol consumption, education level, dyslipidemia, and diabetes mellitus. CI, confidence interval; HR, hazard ratio; OR, odds ratio.
Comparing the highest to the lowest quartile showed that higher levels of imidazole propionate (OR [95% CI] = 1.34 [1.02, 1.74]; Ptrend = 0.02) and 2-hydroxy-3-methylbutyric acid (OR [95% CI] = 1.57 [1.17, 2.11]; Ptrend = 3.40 × 10⁻³) were associated with increased odds of hypertension. Conversely, higher levels of hydrocinnamic acid (OR [95% CI] = 0.76 [0.58, 0.99]; Ptrend = 0.01) were associated with lower odds of hypertension (Supplementary Table S12). Moreover, higher imidazole propionate levels (HR [95% CI] = 1.59 [1.04, 2.45]; Ptrend = 0.03) significantly increased the risk of incident hypertension. In contrast, participants in the highest quartile of hydrocinnamic acid had a 37% lower risk of developing hypertension (HR [95% CI] = 0.63 [0.41, 0.97]; Ptrend = 0.03) than those in the lowest quartile. (Supplementary Table S13).
-
This study examined the associations between gut microbial α-diversity and BP indices based on metagenomic sequencing data and ambulatory BP measurements in the Chinese population. We found that the association between gut microbial richness and BP exhibited a circadian difference within 24 hours. Moreover, imidazole propionate, 2-hydroxy-3-methylbutyric acid, homovanillic acid, and hydrocinnamic acid largely mediated the effects of gut microbial richness on BP and BPV. The relationship between these metabolites and hypertension was evaluated in a large-scale prospective cohort. Our study presents a series of findings that highlight the role of gut microbial richness and its metabolites in BP management.
First, we comprehensively investigated the associations of gut microbial α-diversity with ambulatory BP indices, including mean 24-hour BP, daytime BP, nighttime BP, and their variability. Previous studies have examined the correlation between α-diversity and BP; however, most extant studies were based on 16S rRNA sequencing data and limited to traditional BP measurements.27-30 In contrast, we found that α-diversity was inversely associated with ambulatory BP and office BP, particularly gut microbial richness. Furthermore, we revealed a stronger association between α-diversity and daytime BP than that between α-diversity and nighttime BP, suggesting that the influence of gut microbial composition on BP may vary throughout the day. We also identified three microbial-richness-related metabolites associated with daytime SBP; however, only one was associated with nighttime SBP. This is likely because human metabolism follows a circadian rhythm.31,32 Further studies are warranted to understand the mechanisms by which these metabolites regulate BP. Furthermore, we discovered an inverse association between gut microbial richness and SBPV. A previous study found a negative correlation between α-diversity and morning BP surge,33 indicating that a more diverse gut microbiome may help stabilize BP fluctuations over 24 hours. Because gut microbial diversity is highly modifiable by environmental and lifestyle factors,34-37 increasing the richness of gut microbiota through a healthy lifestyle is important to prevent hypertension.
Second, we identified 26 plasma metabolites that were robustly associated with gut microbial richness. These metabolites are mainly bile acids that are involved in cardiovascular health.38-40 For example, a previous study reported lower diversity in patients with pulmonary arterial hypertension, revealing that these patients had relatively low plasma levels of short-chain fatty acids (SCFAs) and secondary bile acids.40 We discovered four non-bile acid metabolites among these 26 metabolites associated with BP or BPV and further revealed their effects on the risk of hypertension. A recent large population-based study from SCAPIS has confirmed the correlations between α-diversity and these four metabolites.17 Moreover, a previous study demonstrated that 40 metabolites can predict up to 45% of the inter-individual variation in α-diversity,41 suggesting that the host metabolome could be an important interface between the gut ecosystem and human health. Therefore, the effect of gut microbial richness on BP can be largely explained by specific plasma metabolites.
Third, we identified several mediating pathways linking gut microbial richness to BP indices through these metabolites. A more diverse microbiome is likely to produce more beneficial metabolites that improve gastrointestinal and cardiovascular health. For example, hydrocinnamic acid is a phenylpropionic acid associated with higher microbial richness. This metabolite is derived from Bacteroides fragilis and plays an important role in enhancing the intestinal epithelial barrier by activating aryl hydrocarbon receptor signaling.42 Furthermore, phenylpropionic acid correlates with acetate and propionate in feces.43 Our study showed that increased hydrocinnamic acid reduced SBPV and the risk of hypertension, and a previous Chinese cohort study reported that hydrocinnamic acid is negatively associated with atherosclerosis[44]. These findings demonstrate that hydrocinnamic acid may improve cardiovascular health by promoting gut epithelial function and affecting SCFA metabolism. In contrast, imidazole propionate is a detrimental histidine-derived metabolite produced by the microbiota. Specifically, it impairs insulin signaling at the insulin receptor substrate level through the activation of p38γ MAPK, which promotes p62 phosphorylation and activates mTORC1[45]. A recent study has shown that imidazole propionate is associated with increased systemic inflammation and gut permeability markers.46 These findings suggest that the mediating role of imidazole propionate in the association between gut microbial richness and BP may be attributed to its ability to increase inflammation and impair the gut mucosal barrier. Moreover, this metabolite increases in individuals with heart failure and is a significant independent predictor of mortality[46,47]. Collectively, our analysis indicates that microbial metabolites such as hydrocinnamic acid are important interfaces between the gut ecosystem and cardiovascular health; however, further research in animal models is needed to better understand these complex interactions.
Our study had several strengths. First, instead of using office BP, we used ABPM and sleep monitoring to obtain accurate 24-hour, daytime, and nighttime BP and BPV. Second, the effects of key metabolites on both prevalent and incident hypertension were evaluated in a large prospective cohort, highlighting the robustness of the results. However, our study had several limitations. First, we could not validate the correlation between plasma metabolites and gut microbial α-diversity, as microbiome data were unavailable in the cohort. Second, we did not collect blood or fecal samples multiple times during the 24-hour period; thus, we could not assess the circadian rhythms of gut microbial α-diversity and metabolites. Third, we could not evaluate the real-time associations among α-diversity, metabolites, and ambulatory blood pressure indices. Therefore, further studies involving germ-free experiments and multiple samplings are needed.
-
This study suggests that gut microbial richness is negatively associated with BP and BPV. Furthermore, we report that four plasma metabolites largely mediate the effects of gut microbial richness on ambulatory BP indices. Our findings offer novel insights into the pathogenesis of hypertension and provide promising therapeutic targets for its prevention.
doi: 10.3967/bes2025.089
Plasma Metabolites Mediate the Associations of Gut Microbial Diversity with Ambulatory Blood Pressure and its Variability
-
Abstract:
Objective Evidence suggests that depleted gut microbial α-diversity is associated with hypertension; however, whether metabolic markers affect this relationship remains unknown. We aimed to determine the potential metabolites mediating the associations of α-diversity with blood pressure (BP) and BP variability (BPV). Methods Metagenomics and plasma targeted metabolomics were conducted on 523 Chinese participants from the MetaSalt study. The 24-hour, daytime, and nighttime BP and BPV were calculated based on ambulatory BP measurements. Linear mixed models were used to characterize the relationships between α-diversity (Shannon and Chao1 index) and BP indices. Mediation analyses were performed to assess the contribution of metabolites to the observed associations. The influence of key metabolites on hypertension was further evaluated in a prospective cohort of 2,169 participants. Results Gut microbial richness (Chao1) was negatively associated with 24-hour systolic BP, daytime systolic BP, daytime diastolic BP, 24-hour systolic BPV, and nighttime systolic BPV (P < 0.05). Moreover, 26 metabolites were strongly associated with richness (Bonferroni P < 0.05). Among them, four key metabolites (imidazole propionate, 2-hydroxy-3-methylbutyric acid, homovanillic acid, and hydrocinnamic acid) mediated the associations between richness and BP indices (proportions of mediating effects: 14.1–67.4%). These key metabolites were also associated with hypertension in the prospective cohort. For example, each 1-standard deviation unit increase in hydrocinnamic acid significantly reduced the risk of prevalent (OR [95% CI] = 0.90 [0.82, 0.99]; P = 0.03) and incident hypertension (HR [95% CI] = 0.83 [0.71, 0.96]; P = 0.01). Conclusion Our results suggest that gut microbial richness correlates with lower BP and BPV, and that certain metabolites mediate these associations. These findings provide novel insights into the pathogenesis and prevention of hypertension. -
Key words:
- Ambulatory blood pressure monitoring /
- Gut microbial richness /
- Plasma metabolites /
- Mediation /
- Hypertension
The authors declare that they have no competing interests.
This study was approved by the Institutional Review Board and the Ethics Committee of Fuwai Hospital in Beijing. Written informed consent was obtained from all participants before data collection.
注释:1) Authors’ contributions: 2) Competing interests: 3) Ethics: -
Figure 1. Associations of gut microbial α-diversity with blood pressure (BP) and BP variability (BPV) indices. Linear mixed models were used to estimate the effect sizes and 95% confidence intervals of microbial α-diversity on BP (A) and BPV indices (B). Covariates included age, sex, body mass index, study sites, and the random effect of family. BP, blood pressure; BPV, blood pressure variability; CI, confidence interval; DBP, diastolic blood pressure; SBP, systolic blood pressure.
Figure 2. Associations between gut microbial richness and plasma metabolites. Linear mixed models adjusted for age, sex, body mass index, study sites, and the random effect of family were used. All metabolites above the dashed line are significant after multiple-hypothesis correction (Bonferroni P < 0.05, two-sided). Labels are shown for the most positively and negatively correlated metabolites.
Figure 3. Identified metabolites and the risk of hypertension in the prospective cohort. Associations of the four key metabolites with both prevalent(A) and incident (B) hypertension. Covariates included age, sex, body mass index, physical activity, urbanization, smoking status, alcohol consumption, education level, dyslipidemia, and diabetes mellitus. CI, confidence interval; HR, hazard ratio; OR, odds ratio.
Table 1. Characteristics of the study participants
Characteristics Overall (n = 523) Male (n = 194) Female (n = 329) Age, years 48.13 (9.28) 47.47 (10.06) 48.52 (8.78) BMI, kg/m2 26.35 (3.53) 26.41 (3.42) 26.31 (3.60) Blood Pressure, mmHg 24-hour SBP 125.31 (12.28) 129.13 (12.36) 123.08 (11.68) 24-hour DBP 81.30 (9.33) 85.28 (9.96) 78.97 (8.10) Daytime SBP 129.55 (12.53) 133.42 (13.07) 127.27 (11. 63) Daytime DBP 84.86 (9.92) 88.86 (10.58) 82.51 (8.71) Nighttime SBP 116.28 (13.59) 119.73 (13.30) 114.26 (13.37) Nighttime DBP 73.79 (9.70) 77.37 (10.40) 71.69 (8.61) Office SBP 129.48 (13.68) 132.32 (12.68) 127.81 (13.99) Office DBP 80.95 (9.81) 84.01 (10.24) 79.14 (9.10) Blood Pressure Variability, mmHg 24-hour SBPV 12.01 (3.46) 12.29 (4.06) 11.84 (3.05) 24-hour DBPV 9.89 (2.72) 10.18 (3.10) 9.72 (2.46) Daytime SBPV 10.42 (3.26) 10.58 (3.54) 10.33 (3.08) Daytime DBPV 8.73 (2.63) 8.90 (2.77) 8.63 (2.54) Nighttime SBPV 8.44 (3.79) 8.45 (3.89) 8.43 (3.73) Nighttime DBPV 6.88 (2.77) 6.99 (2.68) 6.82 (2.82) Note. Data are presented as mean (standard deviation). BMI, body mass index; DBP, diastolic blood pressure; DBPV, diastolic blood pressure variability; SBP, systolic blood pressure; SBPV, systolic blood pressure variability.  下载: 导出CSV
Table 2. Mediation analysis of metabolites on the associations between gut microbial richness and ambulatory BP indices
Mediation pathway Total effect
β (95% CI)Direct effect
β (95% CI)Indirect effect
β (95% CI)Proportion
mediated, %P value Chao1→Imidazole propionate→24-hour SBP −1.01 (−1.88, −0.13) −0.61 (−1.53, 0.34) −0.40 (−0.72, −0.13) 38.7 0.03 Chao1→2-Hydroxy-3-methylbutyric acid→24-hour SBP −1.00 (−1.90, −0.11) −0.85 (−1.73, 0.01) −0.15 (−0.34, −0.01) 14.1 0.04 Chao1→Homovanillic acid→24-hour SBP −1.00 (−1.90, −0.09) −0.81 (−1.76, 0.12) −0.19 (−0.40, −0.02) 17.8 0.04 Chao1→Imidazole propionate→Daytime SBP −1.21 (−2.11, −0.28) −0.83 (−1.71, 0.12) −0.38 (−0.66, −0.13) 30.9 0.01 Chao1→2-Hydroxy-3-methylbutyric acid→Daytime SBP −1.20 (−2.11, −0.30) −0.99 (−1.91, −0.14) −0.21 (−0.42, −0.04) 17.1 0.02 Chao1→Homovanillic acid→Daytime SBP −1.21 (−2.13, −0.26) −0.99 (−1.92, −0.05) −0.22 (−0.43, −0.05) 18.5 0.02 Chao1→2-Hydroxy-3-methylbutyric acid→Daytime DBP −0.79 (−1.55, −0.05) −0.63 (−1.37, 0.11) −0.17 (−0.33, −0.05) 20.5 0.04 Chao1→Homovanillic acid→Daytime DBP −0.79 (−1.51, −0.08) −0.63 (−1.37, 0.10) −0.15 (−0.32, −0.02) 18.6 0.04 Chao1→Hydrocinnamic acid→24-hour SBPV −0.33 (−0.60, −0.05) −0.10 (−0.42, 0.22) −0.23 (−0.40, −0.06) 67.4 0.02 Note. Age, sex, BMI, study sites, and the random effect of family were adjusted in the mediation analysis. DBP, diastolic blood pressure; SBP, systolic blood pressure; SBPV, systolic blood pressure variability.
下载: 导出CSV
-
[1] NCD Risk Factor Collaboration (NCD-RisC). Worldwide trends in hypertension prevalence and progress in treatment and control from 1990 to 2019: a pooled analysis of 1201 population-representative studies with 104 million participants. Lancet, 2021; 398, 957−80. doi: 10.1016/S0140-6736(21)01330-1 [2] Writing Group of 2010 Chinese Guidelines for the Management of Hypertension. 2010 Chinese guidelines for the management of hypertension. Chin J Cardiol, 2011; 39, 579−616. (In Chinese) [3] Rabi DM, McBrien KA, Sapir-Pichhadze R, et al. Hypertension Canada’s 2020 comprehensive guidelines for the prevention, diagnosis, risk assessment, and treatment of hypertension in adults and children. Can J Cardiol, 2020; 36, 596−624. doi: 10.1016/j.cjca.2020.02.086 [4] Whelton PK, Carey RM, Aronow WS, et al. 2017 ACC/AHA/AAPA/ABC/ACPM/AGS/APhA/ASH/ASPC/NMA/PCNA guideline for the prevention, detection, evaluation, and management of high blood pressure in adults: a report of the American College of Cardiology/American Heart Association Task Force on Clinical Practice Guidelines. Circulation, 2018; 138, e484−594. [5] Williams B, Mancia G, Spiering W, et al. 2018 ESC/ESH Guidelines for the management of arterial hypertension. Eur Heart J, 2018; 39, 3021−104. doi: 10.1093/eurheartj/ehy339 [6] Umemura S, Arima H, Arima S, et al. The Japanese Society of Hypertension guidelines for the management of hypertension (JSH 2019). Hypertens Res, 2019; 42, 1235−481. doi: 10.1038/s41440-019-0284-9 [7] Pickering TG, Shimbo D, Haas D. Ambulatory blood-pressure monitoring. N Engl J Med, 2006; 354, 2368−74. doi: 10.1056/NEJMra060433 [8] Shimbo D, Abdalla M, Falzon L, et al. Role of ambulatory and home blood pressure monitoring in clinical practice: a narrative review. Ann Intern Med, 2015; 163, 691−700. doi: 10.7326/M15-1270 [9] Mancia G, Verdecchia P. Clinical value of ambulatory blood pressure: evidence and limits. Circ Res, 2015; 116, 1034−45. doi: 10.1161/CIRCRESAHA.116.303755 [10] Staessen JA, Li Y, Hara A, et al. Blood pressure measurement anno 2016. Am J Hypertens, 2017; 30, 453−63. [11] Dolan E, Stanton A, Thijs L, et al. Superiority of ambulatory over clinic blood pressure measurement in predicting mortality: the Dublin outcome study. Hypertension, 2005; 46, 156−61. doi: 10.1161/01.HYP.0000170138.56903.7a [12] Yang WY, Melgarejo JD, Thijs L, et al. Association of office and ambulatory blood pressure with mortality and cardiovascular outcomes. JAMA, 2019; 322, 409−20. doi: 10.1001/jama.2019.9811 [13] Johansson JK, Niiranen TJ, Puukka PJ, et al. Prognostic value of the variability in home-measured blood pressure and heart rate: the Finn-Home Study. Hypertension, 2012; 59, 212−8. doi: 10.1161/HYPERTENSIONAHA.111.178657 [14] Marques FZ, Mackay CR, Kaye DM. Beyond gut feelings: how the gut microbiota regulates blood pressure. Nat Rev Cardiol, 2018; 15, 20−32. doi: 10.1038/nrcardio.2017.120 [15] Verhaar BJH, Prodan A, Nieuwdorp M, et al. Gut microbiota in hypertension and atherosclerosis: a review. Nutrients, 2020; 12, 2982. doi: 10.3390/nu12102982 [16] Avery EG, Bartolomaeus H, Maifeld A, et al. The gut microbiome in hypertension: recent advances and future perspectives. Circ Res, 2021; 128, 934−50. doi: 10.1161/CIRCRESAHA.121.318065 [17] Dekkers KF, Sayols-Baixeras S, Baldanzi G, et al. An online atlas of human plasma metabolite signatures of gut microbiome composition. Nat Commun, 2022; 13, 5370. doi: 10.1038/s41467-022-33050-0 [18] Menni C, Zhu JL, Le Roy CI, et al. Serum metabolites reflecting gut microbiome alpha diversity predict type 2 diabetes. Gut Microbes, 2020; 11, 1632−42. doi: 10.1080/19490976.2020.1778261 [19] Kijpaisalratana N, Ament Z, Patki A, et al. Association of circulating metabolites with racial disparities in hypertension and stroke in the REGARDS study. Neurology, 2023; 100, e2312−20. doi: 10.1212/WNL.0000000000202466 [20] Wang ZN, Zhao YZ. Gut microbiota derived metabolites in cardiovascular health and disease. Protein Cell, 2018; 9, 416−31. doi: 10.1007/s13238-018-0549-0 [21] Jia BL, Zou YQ, Han X, et al. Gut microbiome-mediated mechanisms for reducing cholesterol levels: implications for ameliorating cardiovascular disease. Trends Microbiol, 2023; 31, 76−91. doi: 10.1016/j.tim.2022.08.003 [22] Ruan ZL, Li JX, Liu FC, et al. Study design, general characteristics of participants, and preliminary findings from the metabolome, microbiome, and dietary salt intervention study (MetaSalt). Chronic Dis Transl Med, 2021; 7, 227−34. [23] Yang XL, Li JX, Hu DS, et al. Predicting the 10-year risks of atherosclerotic cardiovascular disease in Chinese population: the China-PAR Project (Prediction for ASCVD Risk in China). Circulation, 2016; 134, 1430−40. doi: 10.1161/CIRCULATIONAHA.116.022367 [24] Chinese Preventive Medicine Association, Branch of Heart Disease Prevention and Control, Chinese Preventive Medicine Association, Chinese Diabetes Society, et al. Chinese guideline on healthy lifestyle to prevent cardiometabolic diseases. Chin J Prev Med, 2020; 54, 256−77. (In Chinese) [25] Yu G, Xu CF, Zhang DN, et al. MetOrigin: discriminating the origins of microbial metabolites for integrative analysis of the gut microbiome and metabolome. iMeta, 2022; 1, e10. doi: 10.1002/imt2.10 [26] Tingley D, Yamamoto T, Hirose K, et al. Mediation: R package for causal mediation analysis. J Stat Softw, 2014; 59, 1−38. [27] Verhaar BJH, Collard D, Prodan A, et al. Associations between gut microbiota, faecal short-chain fatty acids, and blood pressure across ethnic groups: the HELIUS study. Eur Heart J, 2020; 41, 4259−67. doi: 10.1093/eurheartj/ehaa704 [28] Sun S, Lulla A, Sioda M, et al. Gut microbiota composition and blood pressure. Hypertension, 2019; 73, 998−1006. doi: 10.1161/HYPERTENSIONAHA.118.12109 [29] Jackson MA, Verdi S, Maxan ME, et al. Gut microbiota associations with common diseases and prescription medications in a population-based cohort. Nat Commun, 2018; 9, 2655. doi: 10.1038/s41467-018-05184-7 [30] De la Cuesta-Zuluaga J, Mueller NT, Álvarez-Quintero R, et al. Higher fecal short-chain fatty acid levels are associated with gut microbiome dysbiosis, obesity, hypertension and cardiometabolic disease risk factors. Nutrients, 2019; 11, 51. [31] Lal H, Verma SK, Wang YJ, et al. Circadian rhythms in cardiovascular metabolism. Circ Res, 2024; 134, 635−58. doi: 10.1161/CIRCRESAHA.123.323520 [32] Reinke H, Asher G. Crosstalk between metabolism and circadian clocks. Nat Rev Mol Cell Biol, 2019; 20, 227−41. doi: 10.1038/s41580-018-0096-9 [33] Dinakis E, Nakai M, Gill P, et al. Association between the gut microbiome and their metabolites with human blood pressure variability. Hypertension, 2022; 79, 1690−701. doi: 10.1161/HYPERTENSIONAHA.122.19350 [34] Liu Y, Yang KN, Jia YQ, et al. Gut microbiome alterations in high-fat-diet-fed mice are associated with antibiotic tolerance. Nat Microbiol, 2021; 6, 874−84. doi: 10.1038/s41564-021-00912-0 [35] Xia WJ, Xu ML, Yu XJ, et al. Antihypertensive effects of exercise involve reshaping of gut microbiota and improvement of gut-brain axis in spontaneously hypertensive rat. Gut Microbes, 2021; 13, 1−24. [36] Savin Z, Kivity S, Yonath H, et al. Smoking and the intestinal microbiome. Arch Microbiol, 2018; 200, 677−84. doi: 10.1007/s00203-018-1506-2 [37] Wu GD, Chen J, Hoffmann C, et al. Linking long-term dietary patterns with gut microbial enterotypes. Science, 2011; 334, 105−8. doi: 10.1126/science.1208344 [38] Lu Q, Chen JX, Jiang LM, et al. Gut microbiota-derived secondary bile acids, bile acids receptor polymorphisms, and risk of cardiovascular disease in individuals with newly diagnosed type 2 diabetes: a cohort study. Am J Clin Nutr, 2024; 119, 324−32. doi: 10.1016/j.ajcnut.2023.08.023 [39] Liu HH, Tian R, Wang H, et al. Gut microbiota from coronary artery disease patients contributes to vascular dysfunction in mice by regulating bile acid metabolism and immune activation. J Transl Med, 2020; 18, 382. doi: 10.1186/s12967-020-02539-x [40] Moutsoglou DM, Tatah J, Prisco SZ, et al. Pulmonary arterial hypertension patients have a proinflammatory gut microbiome and altered circulating microbial metabolites. Am J Respir Crit Care Med, 2023; 207, 740−56. doi: 10.1164/rccm.202203-0490OC [41] Wilmanski T, Rappaport N, Earls JC, et al. Blood metabolome predicts gut microbiome α-diversity in humans. Nat Biotechnol, 2019; 37, 1217−28. doi: 10.1038/s41587-019-0233-9 [42] Hu J, Chen JW, Xu XJ, et al. Gut microbiota-derived 3-phenylpropionic acid promotes intestinal epithelial barrier function via AhR signaling. Microbiome, 2023; 11, 102. doi: 10.1186/s40168-023-01551-9 [43] Gutiérrez-Díaz I, Fernández-Navarro T, Salazar N, et al. Could fecal phenylacetic and phenylpropionic acids be used as indicators of health status?. J Agric Food Chem, 2018; 66, 10438−46. doi: 10.1021/acs.jafc.8b04102 [44] Liu S, Zhao WJ, Liu XY, et al. Metagenomic analysis of the gut microbiome in atherosclerosis patients identify cross-cohort microbial signatures and potential therapeutic target. FASEB J, 2020; 34, 14166−81. doi: 10.1096/fj.202000622R [45] Koh A, Molinaro A, Ståhlman M, et al. Microbially produced imidazole propionate impairs insulin signaling through mTORC1. Cell, 2018; 175, 947-61. e17. [46] Raju SC, Molinaro A, Awoyemi A, et al. Microbial-derived imidazole propionate links the heart failure-associated microbiome alterations to disease severity. Genome Med, 2024; 16, 27. doi: 10.1186/s13073-024-01296-6 [47] Molinaro A, Nemet I, Bel Lassen P, et al. Microbially produced imidazole propionate is associated with heart failure and mortality. JACC Heart Fail, 2023; 11, 810−21. doi: 10.1016/j.jchf.2023.03.008 -

 点击查看大图
计量
- 文章访问数: 27
- HTML全文浏览量: 12
- PDF下载量: 2
- 被引次数: 0

 Quick Links