

 下载:
下载:


-
Hypertension is a common complication or comorbidity of diabetes mellitus whose prevalence is associated with diabetes type, age, obesity, race, and other factors[1-3]. The incidence of both hypertension and diabetes is increasing, and 20%–60% of people with type 2 diabetes mellitus (T2DM) have been reported to have concomitant hypertension[4]. Furthermore, approximately 30% of the patients with T2DM in Chinese outpatient clinics also have a clinical diagnosis of hypertension[5]. The coexistence of T2DM with hypertension is associated with multiple cardiometabolic risk factors and significantly increases the risk of cardiovascular disease, stroke, nephropathy, and retinopathy, as well as the mortality rate, in patients with diabetes[6]. In contrast, controlling hypertension can significantly decrease the risk of diabetes complications and slow the rate of development[7-10].
Glucocorticoids (including cortisol and corticosterone) have been implicated in a broad range of physiological functions, such as regulating metabolism and blood pressure, as well as stress and inflammatory responses; therefore, they are indispensable in maintaining survival[11, 12]. Glucocorticoids also induce insulin resistance, hyperglycemia, and hyperlipidemia through a variety of mechanisms[13]. Research[14] has shown that morning cortisol levels are positively correlated with the body mass index (BMI), waist-to-hip ratio, and levels of blood glucose, insulin, and triglycerides. Another study has suggested that people with T2DM have higher levels of morning cortisol, and these levels are negatively correlated with the insulin sensitivity index[15]. According to the literature, endogenous glucocorticoids increase blood pressure[16, 17]. However, in patients prescribed synthetic corticoids, the prevalence of the hypertension greatly varies, between 0% and 90%[18, 19].
To our knowledge, no definitive conclusion has been reached regarding the relationship between glucocorticoids and hypertension. Glucocorticoids regulate blood pressure by acting on multiple organs, as reported in many clinical observations and experimental studies[20-24]. Therefore, to investigate whether glucocorticoids might be involved in the pathogenesis of diabetes and hypertension, we aimed to explore the characteristics of glucocorticoids in people with dysglycemia and hypertension by analyzing their association with blood pressure indicators.
-
The participants in this study were from the Henan Rural Cohort study, which included 39,259 people 18–79 years of age in five rural regions of Henan province in China at baseline (2015–2017). The cohort details have been described elsewhere[25]. A matched case study[26] was performed after the exclusion of participants taking sex steroid related drugs. Consequently, 925 patients with T2DM were selected, and all cases were matched with participants with impaired fasting glycemia (IFG), on the basis of normal fasting glucose, sex, and age (± 3 years) in the same general population. Finally, 2,775 participants were recruited. In this analysis, we excluded individuals who had normal blood glucose (n = 925) and lacked clinical parameters for blood pressure (n = 4). We also excluded individuals with gestational hypertension (n = 15) and kidney disease (n = 143). After this exclusion process, a total of 1,688 participants 18–79 years of age were included in the final analysis. This study was approved by the Zhengzhou University Life Science Ethics Committee [code: (2015) MEC (S128)]. All participants in the study provided signed written informed consent.
-
Patients or the public were not involved in designing, conducting, reporting, or disseminating our research.
-
Previously validated questionnaires[25, 27] were used by trained investigators to collect demographic (age, sex, education, income, etc.), and lifestyle (smoking, drinking, and exercise) information, as well illness history through face-to-face interviews. The level of education was classified into illiteracy, primary school, middle school, and high school or higher education. Marital status was categorized into married or cohabiting, widowed/divorced/separated, and single. Per capita monthly income was classified into three levels [< 500, between 500 and 999, and ≥ 1,000 renminbi (RMB)]. Smoking status was defined as smoking at least one cigarette per day for 6 consecutive months, and was categorized into never, once, and current. Drinking status was defined as drinking alcohol at least 12 times per year. Physical activity was evaluated with the international physical activity short questionnaire and categorized into low, moderate, and high levels[28].
The investigators measured anthropometric variables, and all participants were asked to wear light clothing and no shoes. Height and weight were measured twice with a standard right-angle device and a weight measurement device (V. BODY HBF-371, OMRON, Japan) to the nearest 0.1 cm and 0.1 kg, respectively[29]. BMI was calculated as body weight (kg) divided by height squared (m2). Blood pressure was measured three times at 30 s intervals in seated participants with an electronic sphygmomanometer (HEM-770AFuzzy, Omron, Japan) after the participants had rested for 5 min, and the mean value was used for analysis[30]. Pulse pressure (PP), mean arterial pressure (MAP), mean blood pressure (MBP), and mean proportional arterial pressure (MPAP) were calculated with the following Formulas[31, 32]:
$$ {\rm P}{\rm P}={\rm S}{\rm B}{\rm P}-{\rm D}{\rm B}{\rm P} \qquad\qquad\qquad\qquad\qquad\qquad\;\;\; $$ (1) $$ {\rm M}{\rm A}{\rm P}=\frac{1}{3}\times {\rm S}{\rm B}{\rm P}+\frac{2}{3}\times {\rm D}{\rm B}{\rm P}=\frac{{\rm S}{\rm B}{\rm P}+2\times {\rm D}{\rm B}{\rm P}}{3}\;\;\;\;\; \,$$ (1) $$ \rm{M}\rm{B}\rm{P}=\frac{1}{2}\times \rm{S}\rm{B}\rm{P}+\frac{1}{2}\times \rm{D}\rm{B}\rm{P}=\frac{\rm{S}\rm{B}\rm{P}+\rm{D}\rm{B}\rm{P}}{2} \qquad\quad $$ (3) $$\begin{aligned} \rm{M}\rm{P}\rm{A}\rm{P}&=\rm{S}\rm{B}\rm{P}\times \left(\frac{\rm{S}\rm{B}\rm{P}}{\rm{S}\rm{B}\rm{P}+\rm{D}\rm{B}\rm{P}}\right)+\rm{D}\rm{B}\rm{P}\left(\frac{\rm{D}\rm{B}\rm{P}}{\rm{S}\rm{B}\rm{P}+\rm{D}\rm{B}\rm{P}}\right)\\ &=\frac{{\rm{S}\rm{B}\rm{P}}^{2}+{\rm{D}\rm{B}\rm{P}}^{2}}{\rm{S}\rm{B}\rm{P}+\rm{D}\rm{B}\rm{P}}\; \end{aligned}$$ (4) -
Fasting venous blood was collected from each participant after a fast of at least 8 h, with no anticoagulant treatment. The samples were then centrifuged immediately after coagulation, and the serum was stored at –80 °C. Fasting plasma glucose (FPG) was measured with a Roche Cobas C501 automatic biochemical analyzer. The serum levels of glucocorticoids (cortisol, deoxycortisol, and cortisone) were measured with liquid chromatography-tandem mass spectrometry on a Waters XEVO TQ-S system (Waters, Milford, MA, USA). We used blind determination when the case or control status of each sample analyzed in the same run was unknown. Values below the limit of detection and undetectable results were replaced with the value of half the detection limit.
-
IFG and T2DM were collectively referred to as dysglycemia, and the diagnostic criteria for IFG and T2DM were those recommended by the American Diabetes Association (2002) and World Health Organization (1999) guidelines. Excluding type 1 diabetes, gestational diabetes, and other special types of diabetes, we defined IFG as 6.1 mmol/L ≤ FPG < 7.0 mmol/L, or 5.7% < HbA1C < 6.5%. T2DM was defined as FPG ≥ 7.0 mmol/L, or HbA1C > 6.5%, or a self-reported previous diagnosis of diabetes by a physician and administration of antiglycemic agents in the prior 2 weeks.
-
A diagnosis of hypertension, as recommended by the Chinese guidelines for the prevention and treatment hypertension (revised 2010)[33], was defined according to the following standards: 1) SBP ≥ 140 mmHg and or DBP ≥ 90 mmHg; 2) self-reported hypertension diagnosed by a physician and current use of antihypertensive treatment in the prior 2 weeks. Participants who reported non-hypertension but were found to be hypertensive when measured were considered to have undiagnosed hypertension.
-
Continuous non-normal variables are expressed in median (quartiles) and compared with the Mann-Whitney U test, whereas categorical variables are expressed as a percentage and compared with a chi-squared test. To explore the potential nonlinear relationships and evaluate dose-response relationships, we categorized serum glucocorticoid (cortisol, deoxycortisol, and cortisone) levels in tertiles, and used the lowest tertiles as the reference. Serum glucocorticoid levels and blood pressure indicators were log-transformed (Ln-) to better approximate a normal distribution. Logistic regression analysis was used to estimate the association between serum glucocorticoids and the risk of dysglycemia with hypertension. The odds ratio (OR) and 95% confidence interval (CI) of dysglycemia with hypertension are reported in tertiles in separate models. We performed trend tests by entering the categorical variables as continuous variables in the logistic regression models. Stratified logistic regression was also performed. Linear regression was also used to examine the relationships between the serum levels of glucocorticoids (Ln-cortisol, Ln-deoxycortisol, and Ln-cortisone) and characteristics of hypertension (Ln-SBP, Ln-SDP, Ln-PP, Ln-MAP, Ln-MBP, and Ln-MPAP). Multivariable adjustment modelling was performed as follows: model 1 was adjusted for age, sex, education, marital status, and per capita monthly income; model 2 was adjusted for the same parameters as model 1, plus drinking and smoking status; and model 3 was adjusted for the same parameters as model 2, plus BMI and physical activity. To further observe the association between continuous serum glucocorticoid (cortisol, deoxycortisol and cortisone) levels and hypertension, we used restricted cubic regression splines. Statistical analyses were performed in SPSS software, version 21.0 (SPSS Inc., Chicago) and SAS V.9.1 (SAS Institute). Two-sided test P values < 0.05 were considered statistically significant.
-
The study population contained of 552 cases of dysglycemia with hypertension (32.7%) and 1,136 cases of dysglycemia with non-hypertension (67.3%). Participants with hypertension were more likely to have a lower education, per capita monthly income, and physical activity level (Table 1). Participants with hypertension appeared to have higher BMI, SBP, DBP, PP, MAP, MBP, MPAP, FPG, serum cortisol, and serum deoxycortisol.
Table 1. Characteristics of the study population with dysglycemia with and without hypertension
Variables Dysglycemia with hypertension x2/z P No Yes n = 1,136 (67.3%) n = 552 (32.7%) Age (years) 60.00 (53.00, 65.00) 63.00 (56.00, 68.00) −6.84 < 0.001 Sex, n (%) 34.96 < 0.001 Male 486 (42.8) 154 (27.9) Female 650 (57.2) 398 (72.1) Education, n (%) 18.01 0.001 Illiteracy 258 (22.7) 169 (20.6) Primary school 343 (20.2) 176 (31.9) Middle school 412 (36.3) 164 (29.7) High school or higher 123 (10.8) 43 (7.8) Marital status, n (%) 4.36 0.225 Married/cohabiting 1,105 (89.3) 483 (87.5) Widowed/divorced/separated 100 (8.8) 63 (11.4) Single 21 (1.8) 6 (1.1) Per capita monthly income (RMB), n (%) 3.84 0.429 < 500 462 (40.7) 238 (43.1) 500–999 347 (30.5) 172 (31.2) ≥ 1,000 327 (28.7) 142 (25.7) Smoking habit, n (%) 26.33 < 0.001 Never 815 (71.8) 452 (81.9) Once 89 (7.8) 41 (7.4) Current 232 (20.4) 59 (10.7) Drinking status, n (%) 8.36 0.015 Never 920 (81.0) 468 (84.8) Once 63 (5.5) 36 (6.5) Current 153 (13.5) 48 (8.7) Physical activity, n (%) 17.99 < 0.001 Low 281 (24.7) 177 (32.1) Moderate 539 (47.4) 268 (48.6) High 316 (27.8) 107 (19.4) BMI (kg/m2) 24.25 (22.15, 26.48) 25.86 (23.73, 28.04) −9.20 < 0.001 SBP (mmHg) 117.00 (109.00, 126.00) 143.00 (132.00, 152.00) −26.21 < 0.001 DBP (mmHg) 72.00 (66.00, 78.00) 84.00 (77.00, 91.00) −21.04 < 0.001 PP (mmHg) 45.00 (39.00, 51.00) 58.00 (49.00, 67.00) −19.36 < 0.001 MAP (mmHg) 87.67 (80.67, 93.33) 104.33 (96.33, 110.67) −25.16 < 0.001 MBP (mmHg) 95.00 (88.00, 101.50) 113.50 (105.13, 121.38) −25.95 < 0.001 MPAP (mmHg) 100.32 (93.49, 107.28) 121.14 (112.93, 129.08) −26.38 < 0.001 FPG (mmol/L) 5.93 (5.10, 7.63) 6.56 (5.37, 8.46) −5.09 < 0.001 HbA1c (%) 6.10 (5.80, 7.20) 6.40 (5.90, 760) −4.02 < 0.001 Serum cortisol (ng/mL) 141.95 (96.10, 189.25) 153.50 (105.33, 200.30) −2.63 0.009 Serum deoxycortisol (ng/mL) 0.30 (0.20, 0.40) 0.30 (0.20, 0.50) −3.87 < 0.001 Serum cortisone (ng/mL) 12.90 (9.50, 16.10) 12.90 (10.00, 16.60) −0.89 0.373 Ratio of serum cortisol to cortisone 10.64 (7.66, 15.35) 10.96 (7.66, 15.35) −1.04 0.300 Note. Continuous variables are expressed in median (quartiles) and compared with Mann-Whitney U test; categorical variables are expressed in percentage and compared by chi-squared test. BMI: body mass index; SBP: systolic blood pressure; DBP: diastolic blood pressure; PP: pulse pressure; MAP: mean arterial pressure; MBP: mean blood pressure; MPAM: mean proportional arterial pressure; FPG: fasting plasma glucose; HbA1c: hemoglobin A1c. -
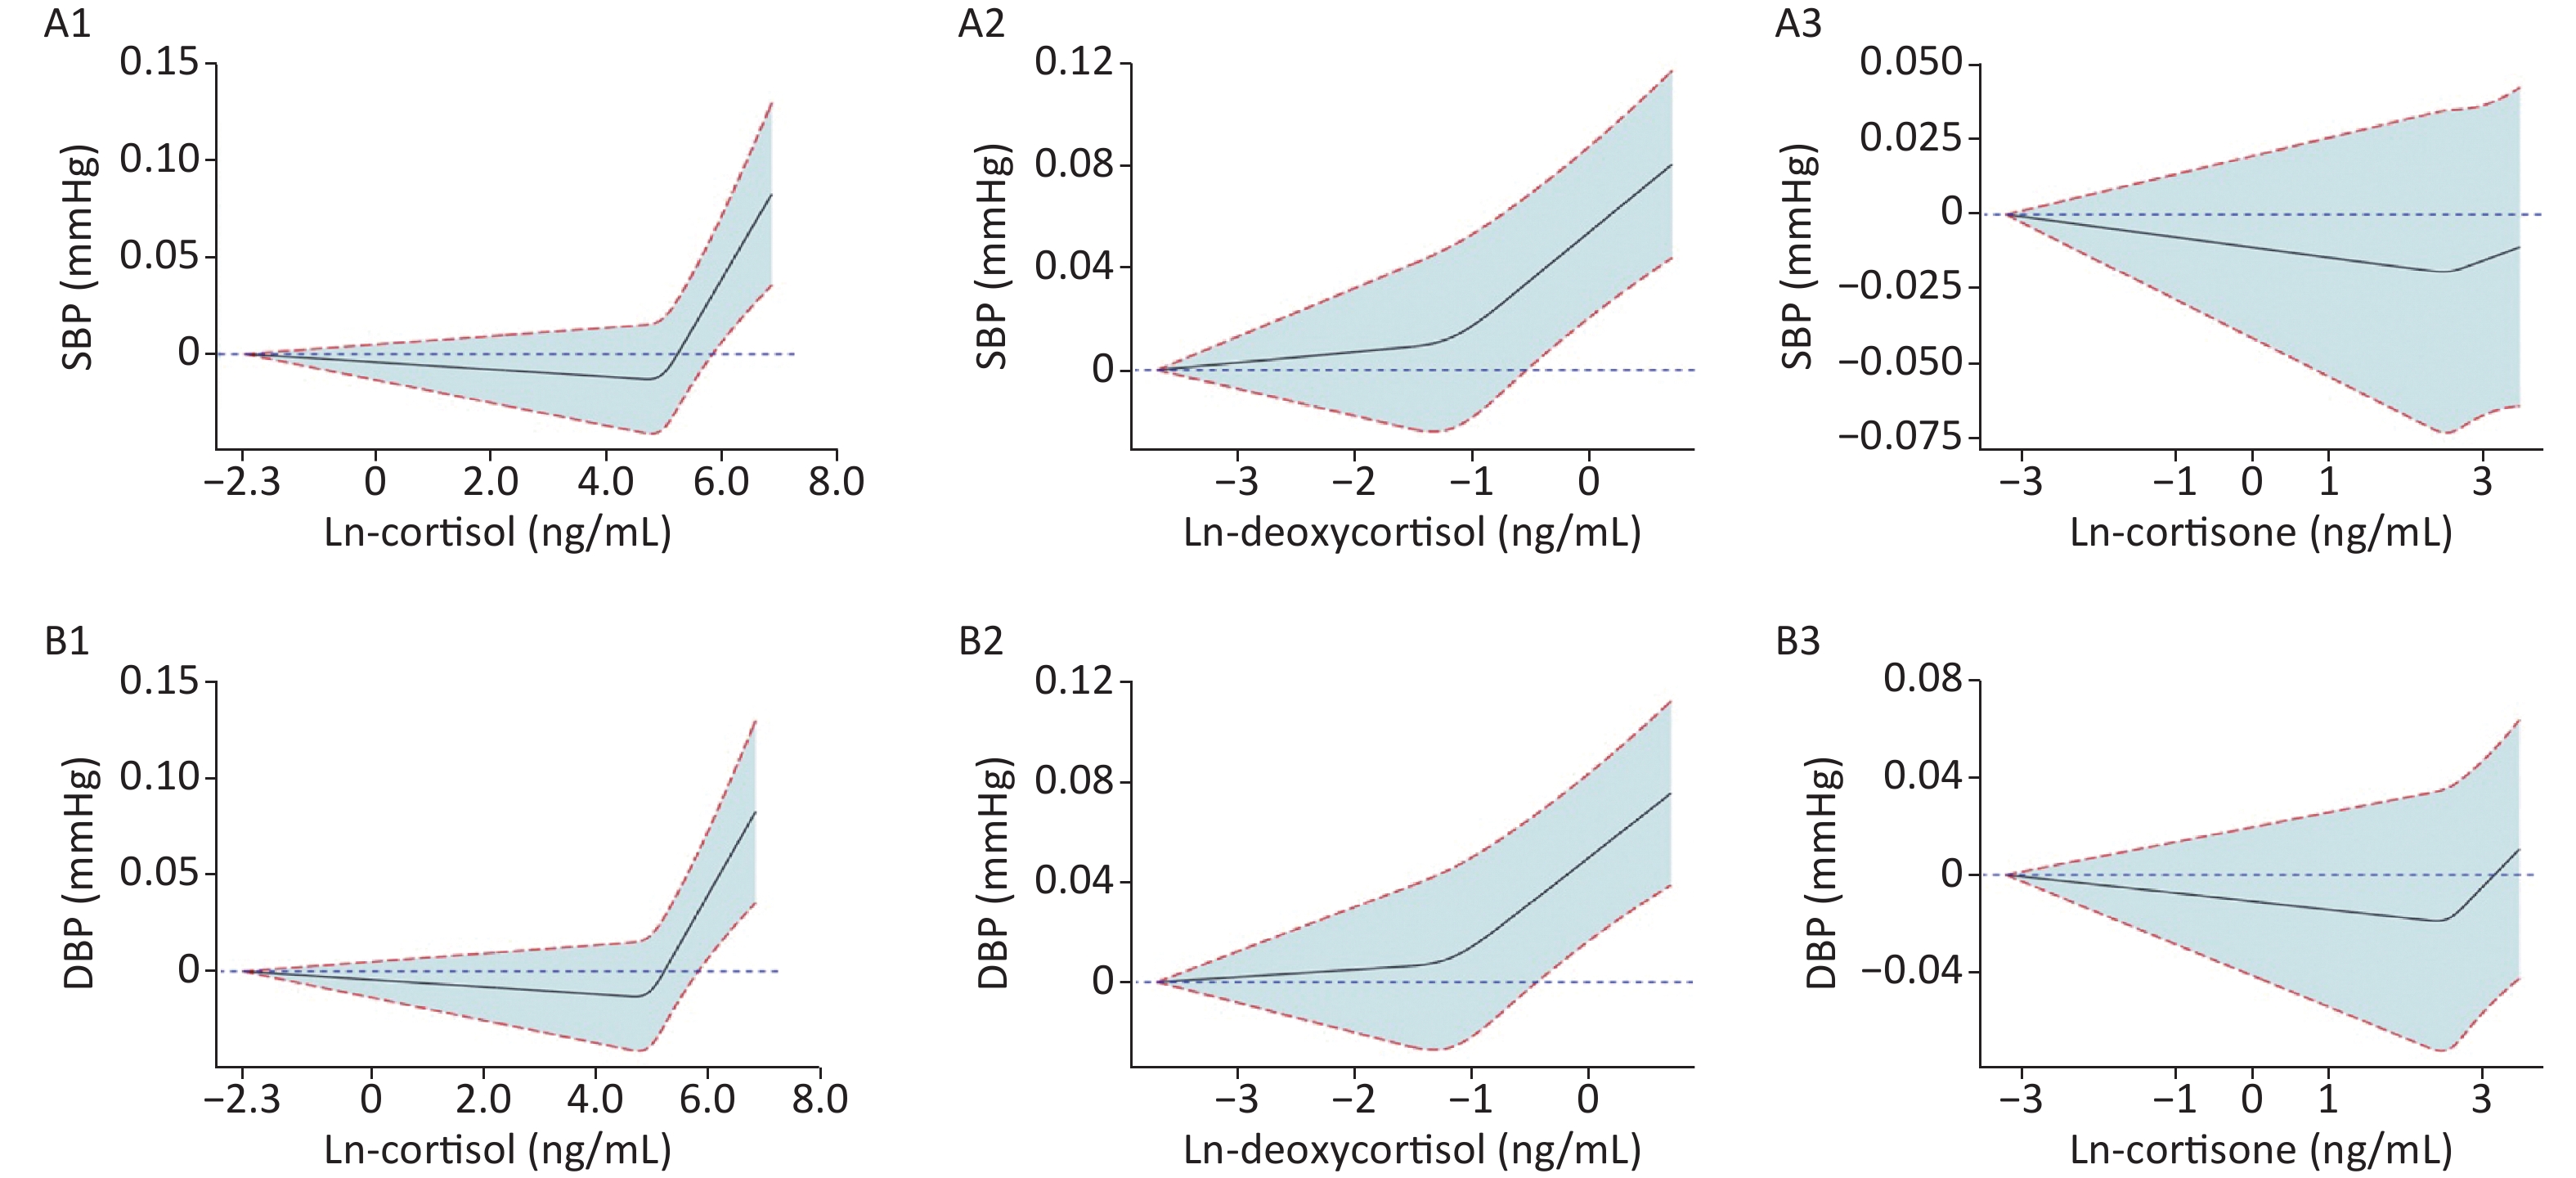
To observe the trend between Ln-glucocorticoids and BP, we generated restricted spline curves for serum Ln-glucocorticoids (Supplementary Figure S1, available in www.besjournal.com). As demonstrated, elevated SBP was associated with increased serum deoxycortisol levels. However, no significant differences in the trends were observed for the relationship between SBP and serum Ln-cortisol or Ln-cortisone. A similar trend between Ln-glucocorticoids and DBP was also observed.
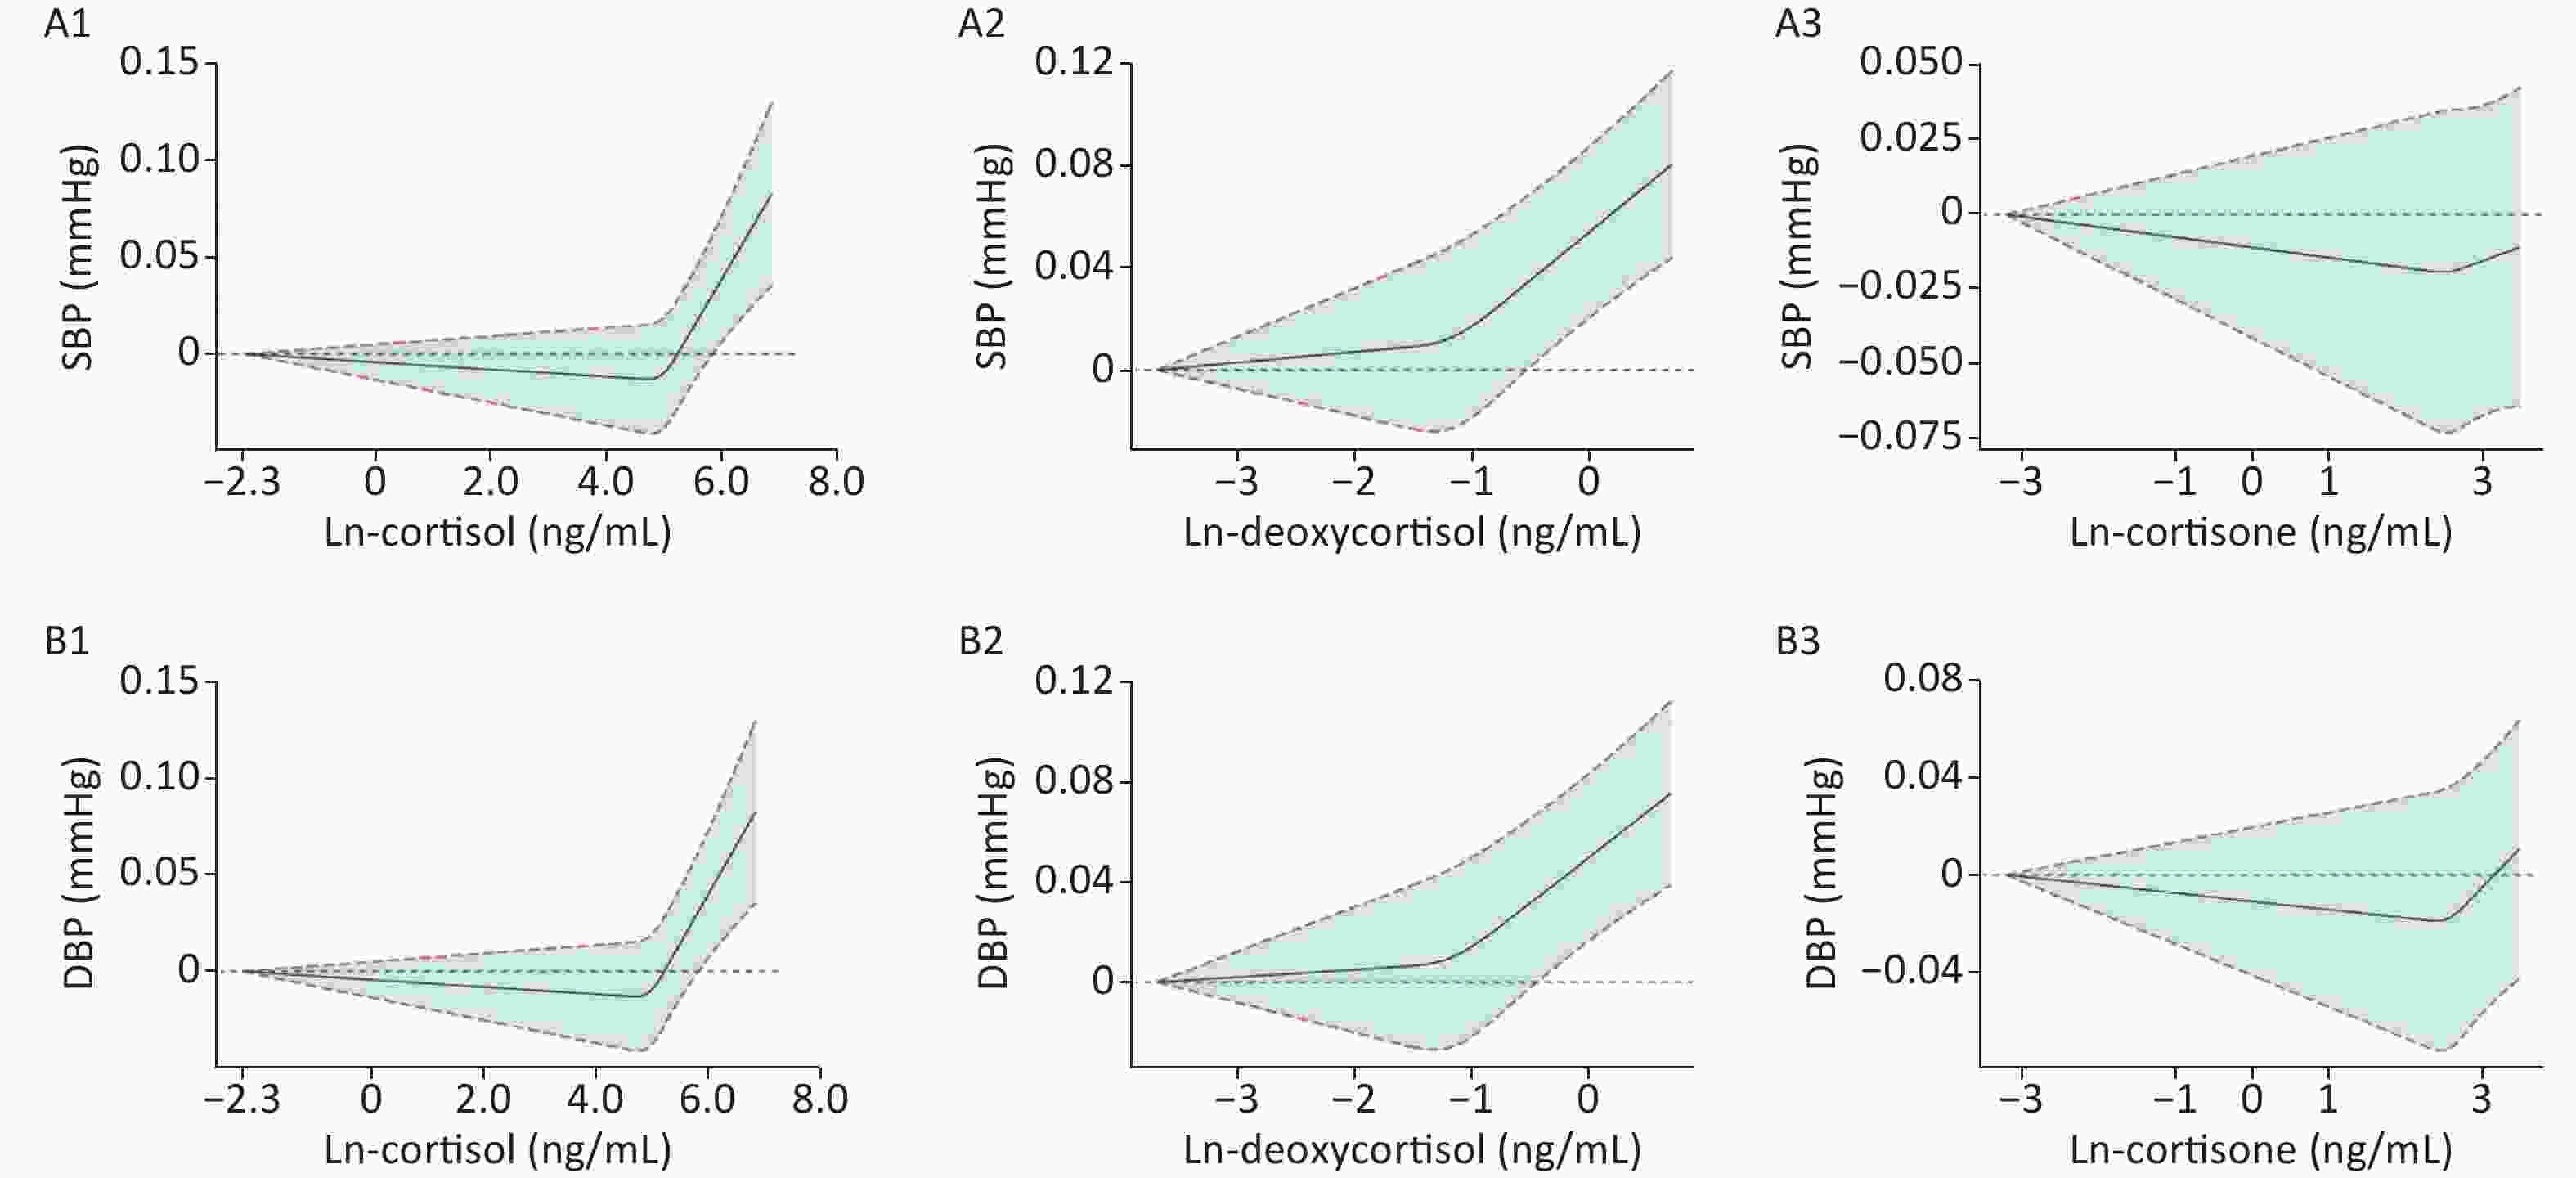
Figure S1. Mean and 95% confidence intervals of SBP (A1–A3) and DBP (B1–B3) along with changes in serum Ln-cortisol, Ln-deoxycortisol, and Ln-cortisone from restricted cubic splines analysis, adjusted for age, sex, education, marital status, per capita monthly income, drinking and smoking status, BMI, and physical activity. SBP: systolic blood pressure; DBP: diastolic blood pressure. Ln-, natural log-transformed.
-
Table 2 shows the association between serum Ln-glucocorticoids and dysglycemia with hypertension. The ORs (95% CIs) of participants with the highest tertile of the Ln-cortisol were 1.42 (1.11, 1.83) and 1.55 (1.18, 2.04), as compared with the lowest tertile in the crude and full-adjusted model. In the crude model, the highest tertile of the Ln-deoxycortisol was significantly associated with an increased risk of dysglycemia with hypertension (OR: 1.57, 95% CI: 1.23, 2.00), as compared with the lowest tertile. After adjustment for covariates (model 1–3), the ORs (95% CIs) were 1.56 (1.21, 2.01), 1.56 (1.21, 2.01), and 1.59 (1.22, 2.07), respectively. No significant correlation was observed between serum Ln-cortisone and dysglycemia with hypertension in both the crude and adjusted models.
Table 2. Association between serum Ln-glucocorticoids and dysglycemia with hypertension
Item Crude Model 1 Model 2 Model 3 OR (95% CI) P value OR (95% CI) P value OR (95% CI) P value OR (95% CI) P value Serum Ln-cortisol Tertile 1 1 1 1 1 Tertile 2 1.203
(0.934, 1.551)0.152 1.198
(0.922, 1.556)0.177 1.194
(0.919, 1.551)0.184 1.253
(0.953, 1.646)0.106 Tertile 3 1.422
(1.107, 1.828)0.006 1.419
(1.096, 1.837)0.008 1.411
(1.089, 1.828)0.009 1.552
(1.183, 2.036)0.001 Ptrand 0.006 0.008 0.009 0.001 Serum Ln-deoxycortisol Tertile 1 1 1 1 1 Tertile 2 1.030
(0.803, 1.321)0.817 1.034
(0.799, 1.337)0.799 1.035
(0.800, 1.340)0.792 0.988
(0.755, 1.292)0.927 Tertile 3 1.565
(1.225, 1.999)< 0.001 1.558
(1.210, 2.006)0.001 1.557
(1.209, 2.005)0.001 1.591
(1.222, 2.072)0.001 Ptrand 0.001 0.001 0.001 0.001 Serum Ln-cortisone Tertile 1 1 1 1 1 Tertile 2 0.975
(0.760, 1.252)0.845 1.040
(0.804, 1.345)0.764 1.036
(0.801, 1.340)0.789 0.988
(0.755, 1.292)0.928 Tertile 3 1.078
(0.841, 1.381)0.555 1.111
(0.861, 1.434)0.419 1.101
(0.852, 1.422)0.462 1.060
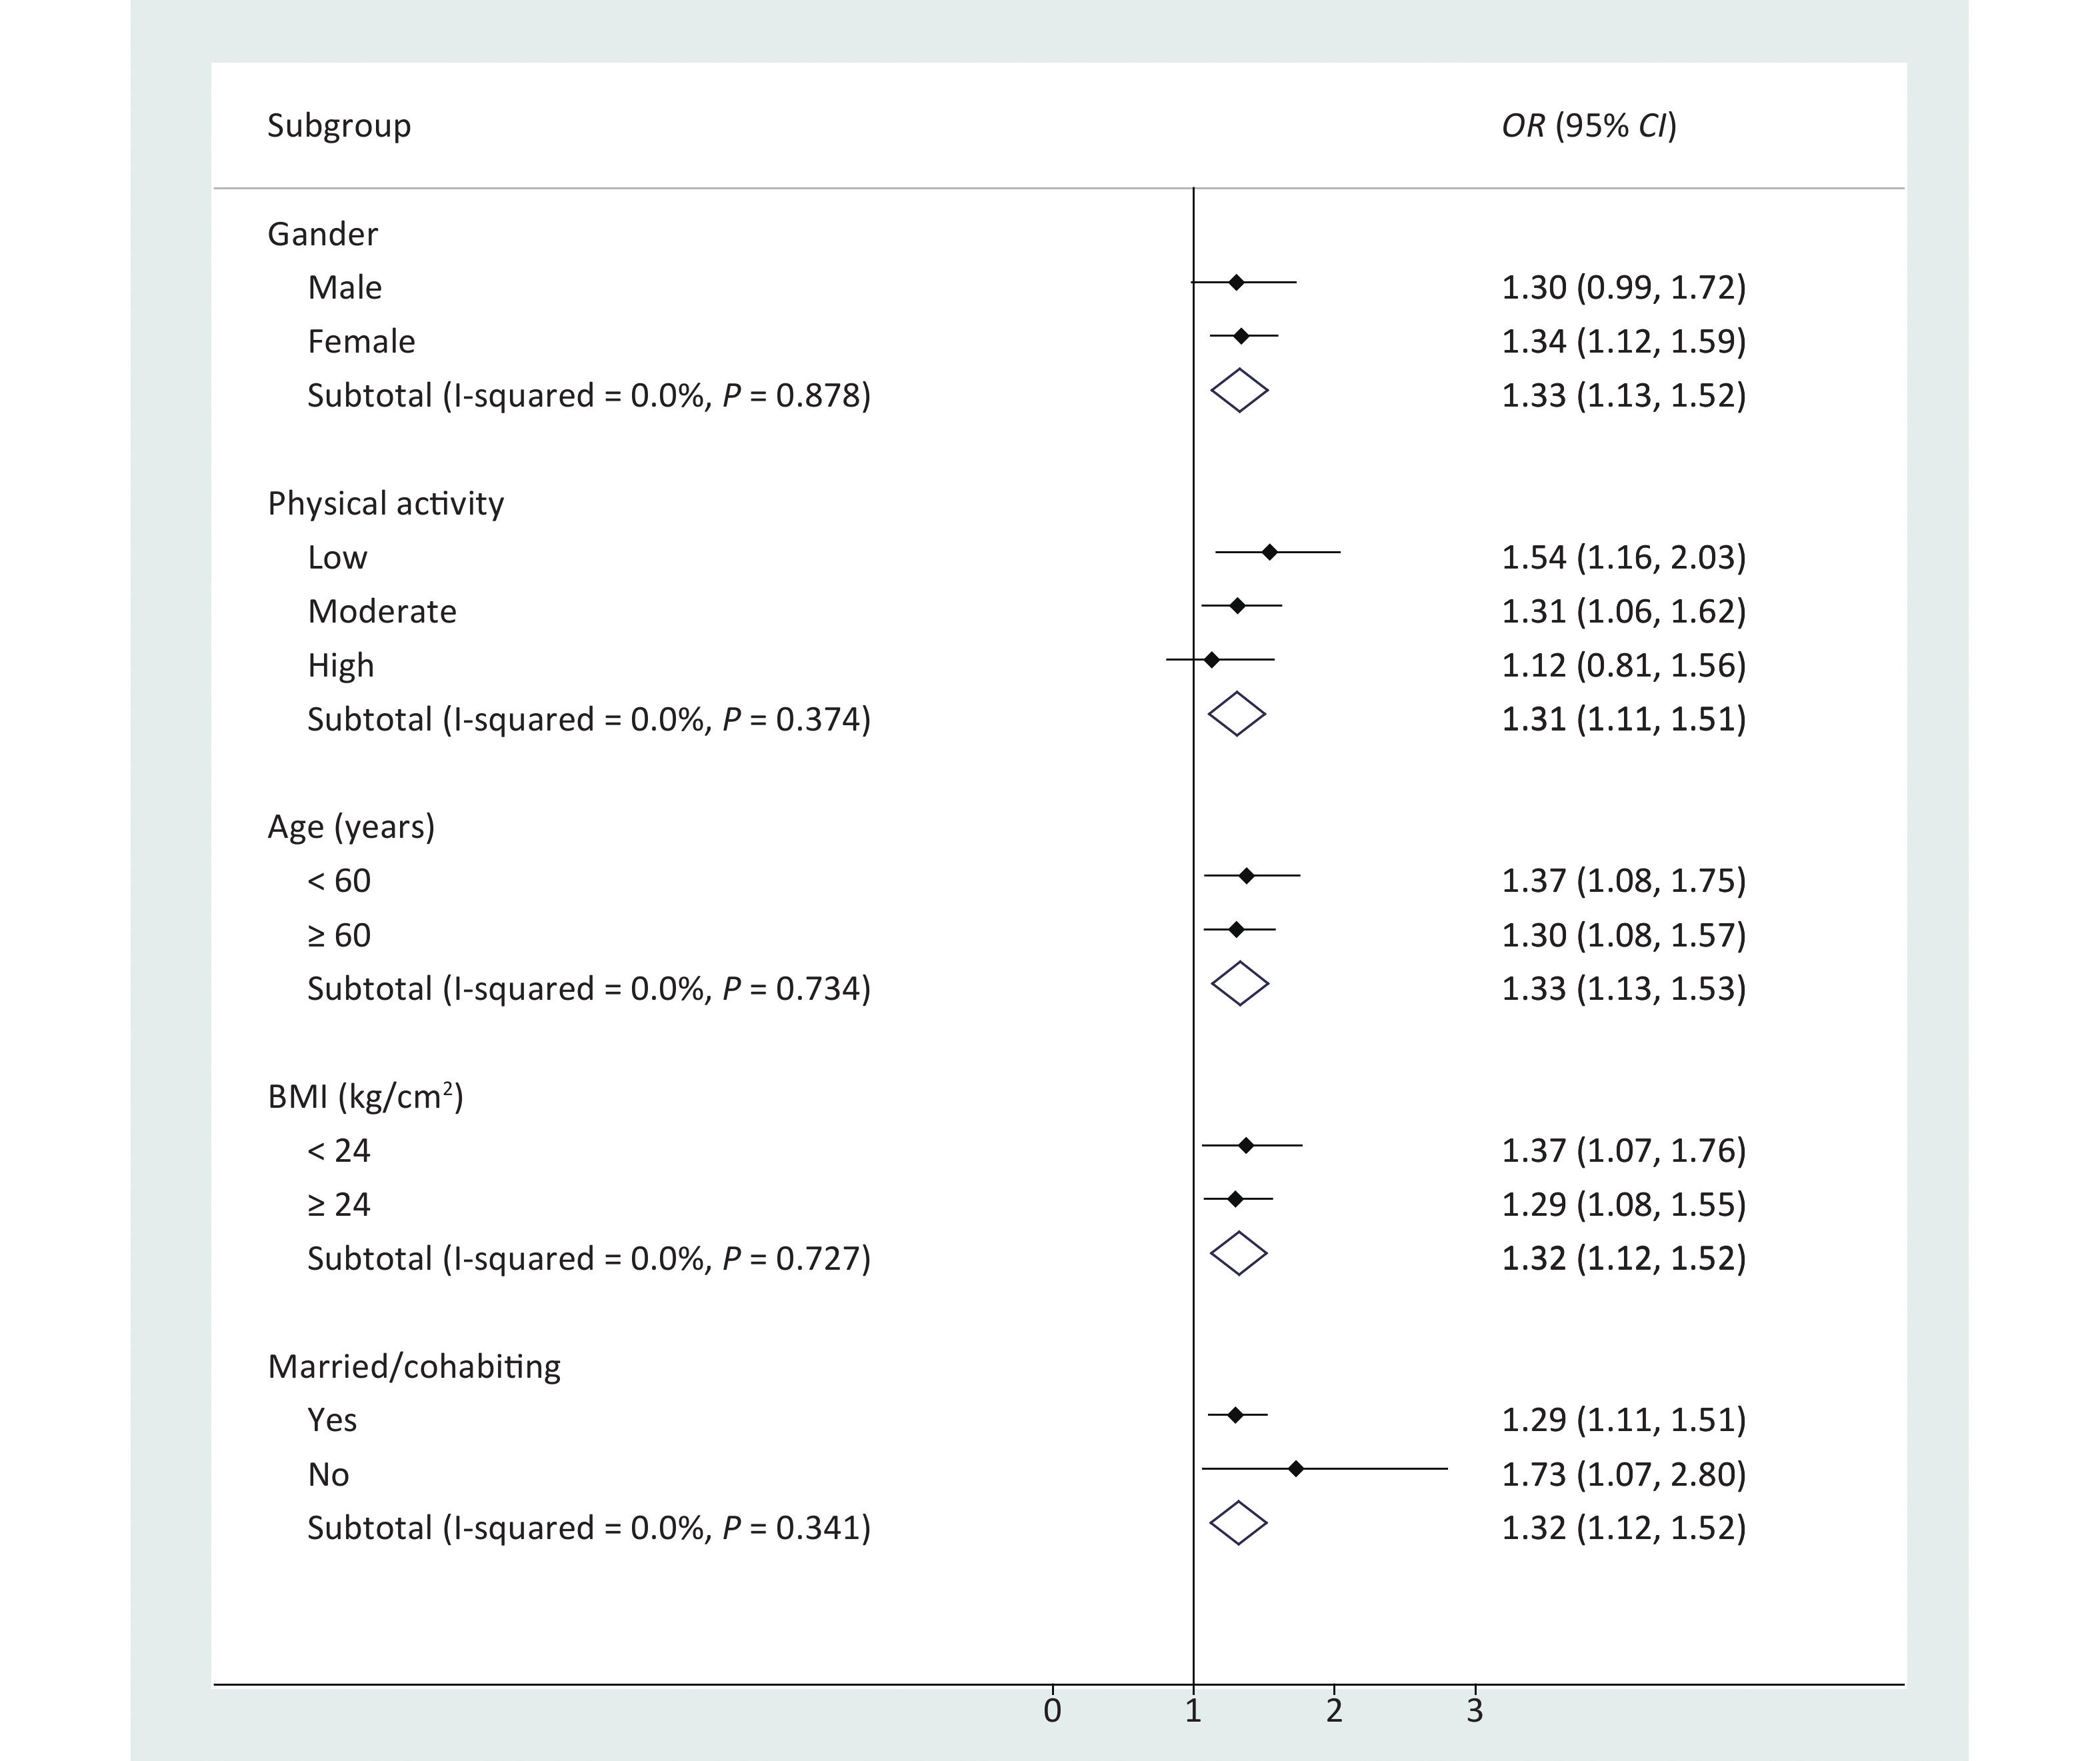
(0.812, 1.385)0.668 Ptrand 0.557 0.420 0.463 0.667 Note. Model 1 was adjusted by age, sex, education, marital status, and per capita monthly income. Model 2 was further adjusted by drinking and smoking status, based on model 1. Model 3 was further adjusted by BMI and physical activity, based on model 2. Ln-, natural log-transformed. The results of stratified logistic regression showed that participants who were male, were unmarried/divorced/widowed, or had a low BMI or low physical activity had higher risk in the association between serum Ln-deoxycortisol and dysglycemia with hypertension (Figure 1). No significant correlation was observed between Ln-cortisol or Ln-cortisone and dysglycemia with hypertension after stratification by baseline characteristics (Supplementary Table S1, available in www.besjournal.com). In addition, when the association between serum Ln-glucocorticoids and dysglycemia with hypertension was stratified by T2DM and IFG (Table 3), the strongest association was observed between Ln-glucocorticoids and T2DM with hypertension. The results of further sensitivity analysis (Supplementary Table S2, available in www.besjournal.com) showed that the OR (95% CI) of the highest tertile of serum deoxycortisol was 1.682 (1.242, 2.277) after removal of the hypertension controlled population (n = 167).
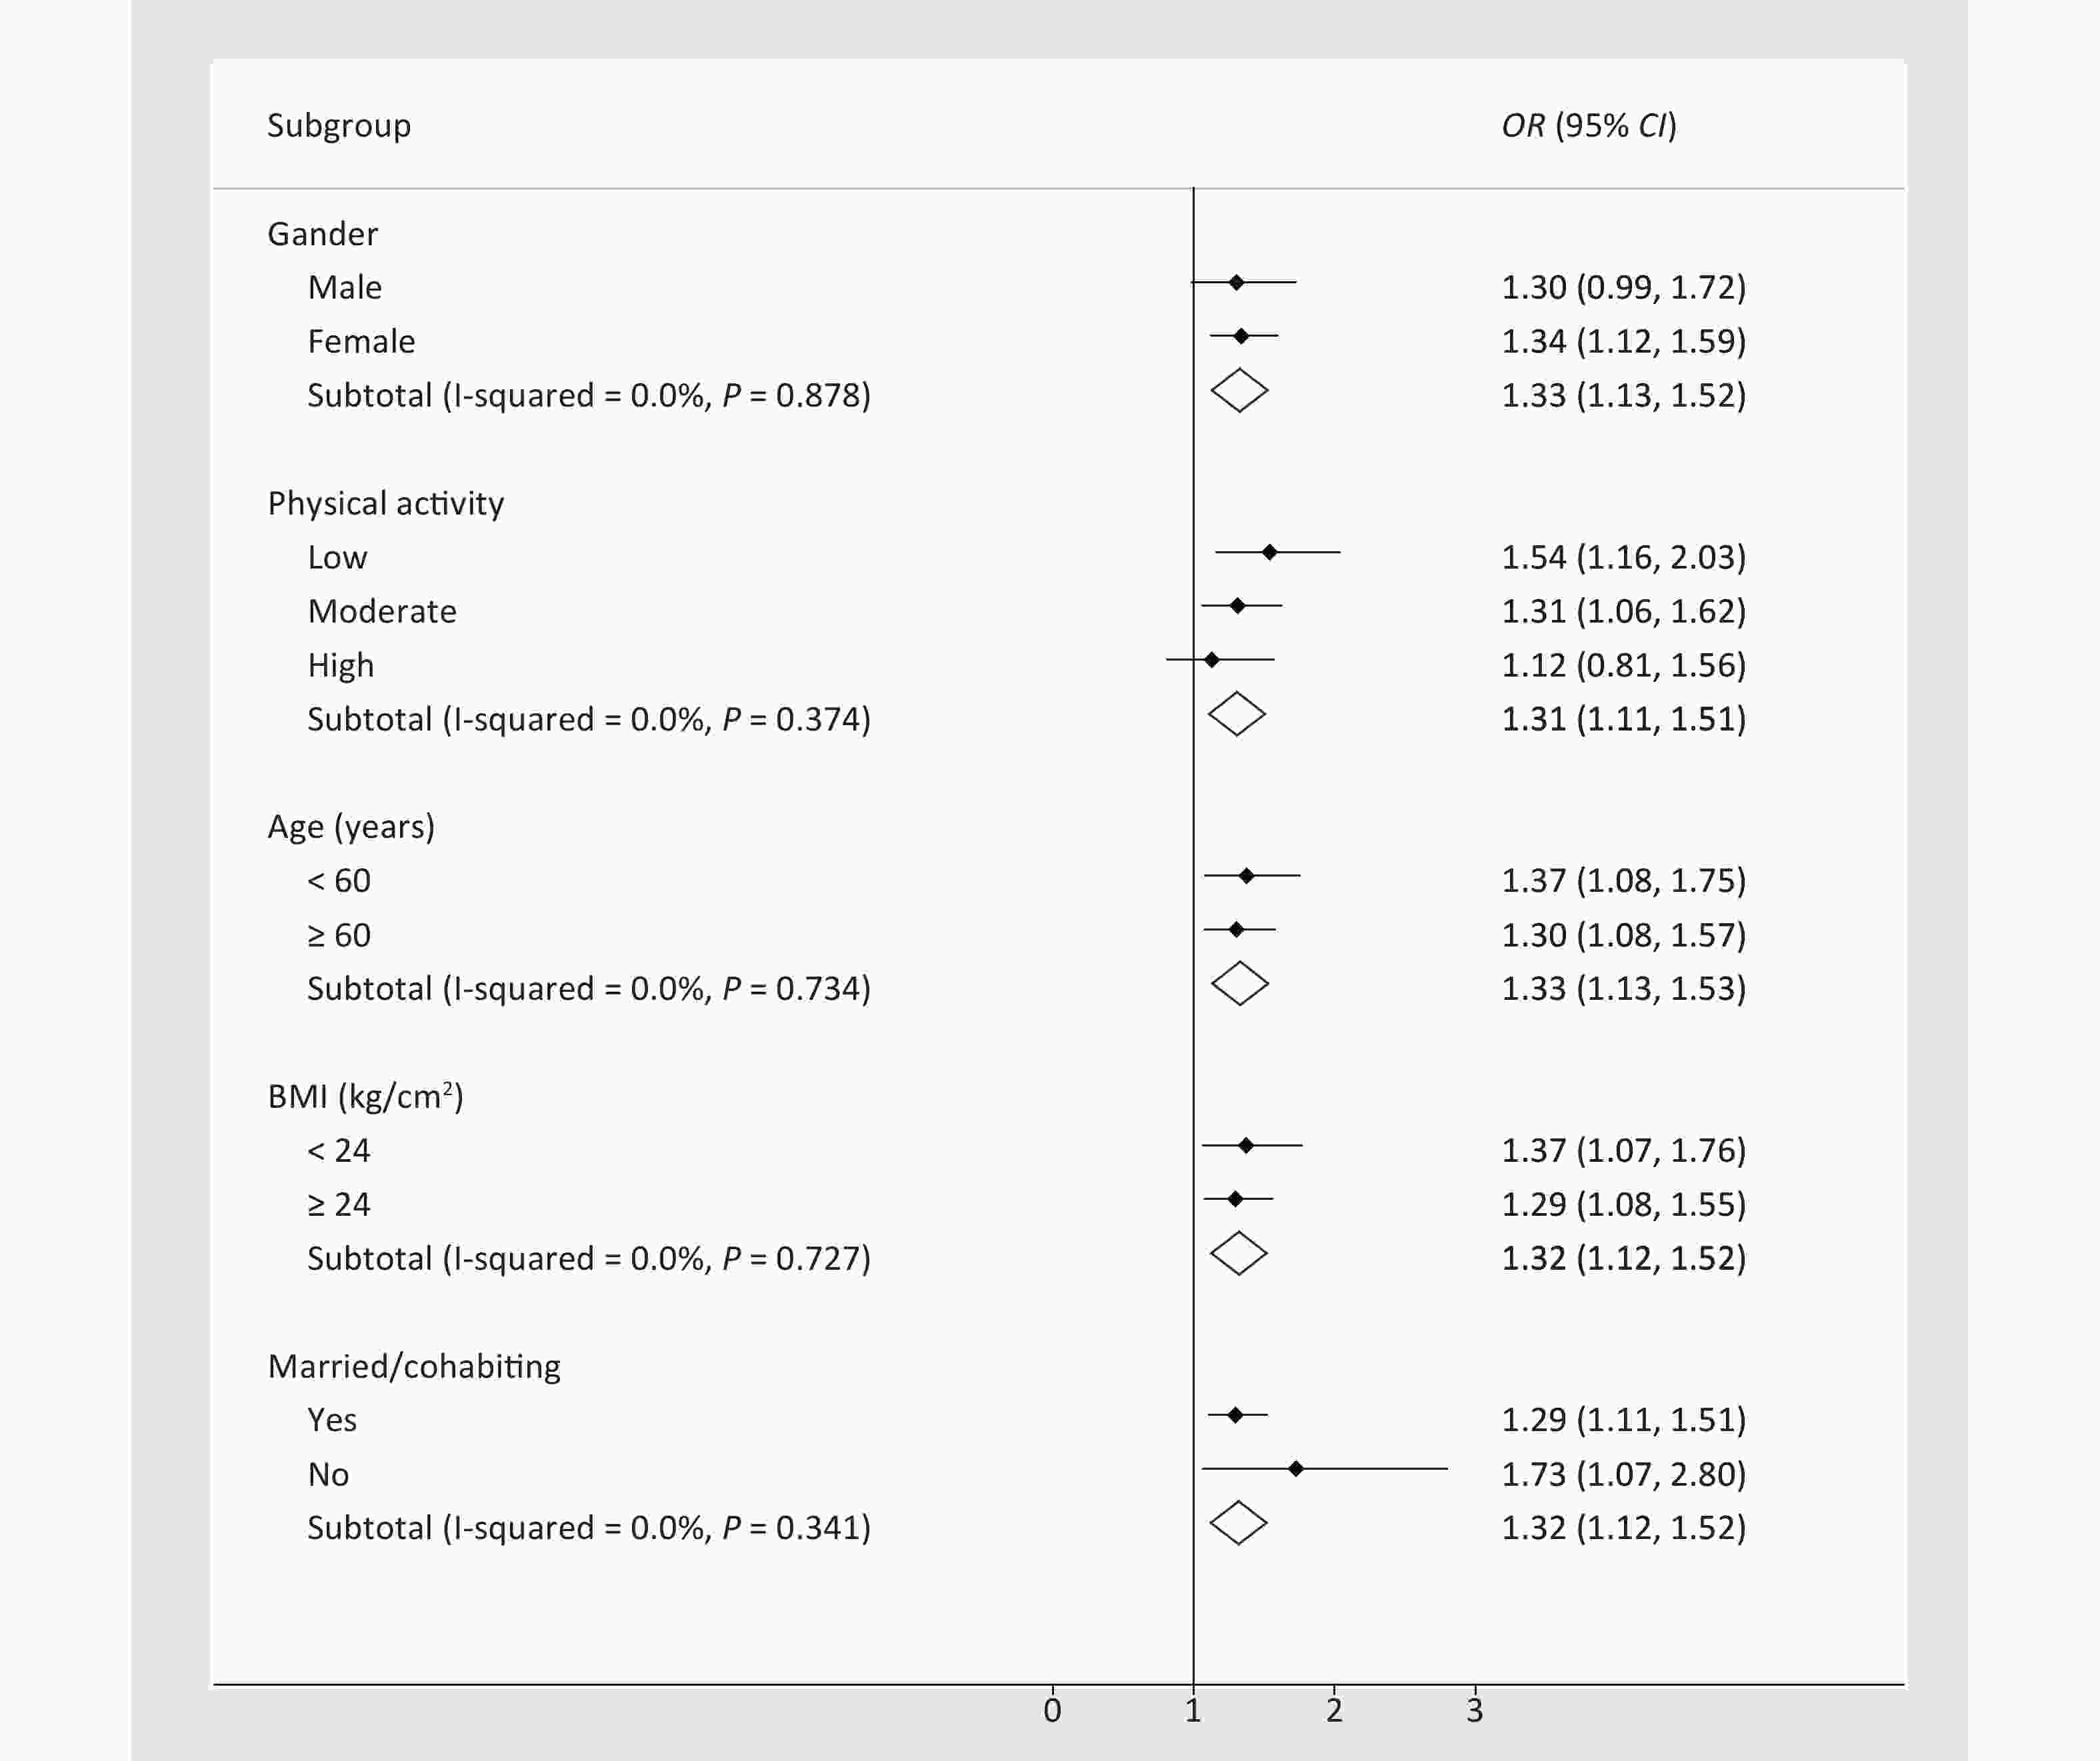
Figure 1. Association between serum Ln-deoxycortisol and dysglycemia with hypertension, stratified by baseline characteristics. The odds ratio (OR) and 95% confidence interval (CI) were calculated by stratified logistic regression adjusted for age, sex, education, marital status, per capita monthly income, drinking and smoking status, BMI, and physical activity. BMI: body mass index.
Table 3. Association between serum Ln-glucocorticoids and dysglycemia with hypertension, stratified by T2DM and IFG
Item T2DM, n = 838 IFG, n = 850 OR (95% CI) P value OR (95% CI) P value Serum Ln-cortisol Tertile 1 1 1 Tertile 2 1.156 (0.786, 1.700) 0.462 1.359 (0.913, 2.022) 0.130 Tertile 3 1.530 (1.051, 2.228) 0.027 1.555 (1.041, 2.325) 0.031 Ptrand 0.026 0.031 Serum Ln-deoxycortisol Tertile 1 1 1 Tertile 2 1.051 (0.722, 1.530) 0.796 0.861 (0.580, 1.277) 0.456 Tertile 3 1.717 (1.180, 2.498) 0.005 1.429 (0.974, 2.095) 0.068 Ptrand 0.006 0.105 Serum Ln-cortisone Tertile 1 1 1 Tertile 2 0.956 (0.651, 1.404) 0.819 0.965 (0.658, 1.417) 0.857 Tertile 3 0.987 (0.673, 1.447) 0.946 1.047 (0.712, 1.541) 0.814 Ptrand 0.957 0.829 Note. T2DM: type 2 diabetes mellitus; IFG: impaired fasting glucose; OR: odds ratio; CI: confidence interval. Ln-, natural log-transformed. The model was adjusted by age, sex, education, marital status, per capita monthly income, drinking and smoking status, BMI, and physical activity. -
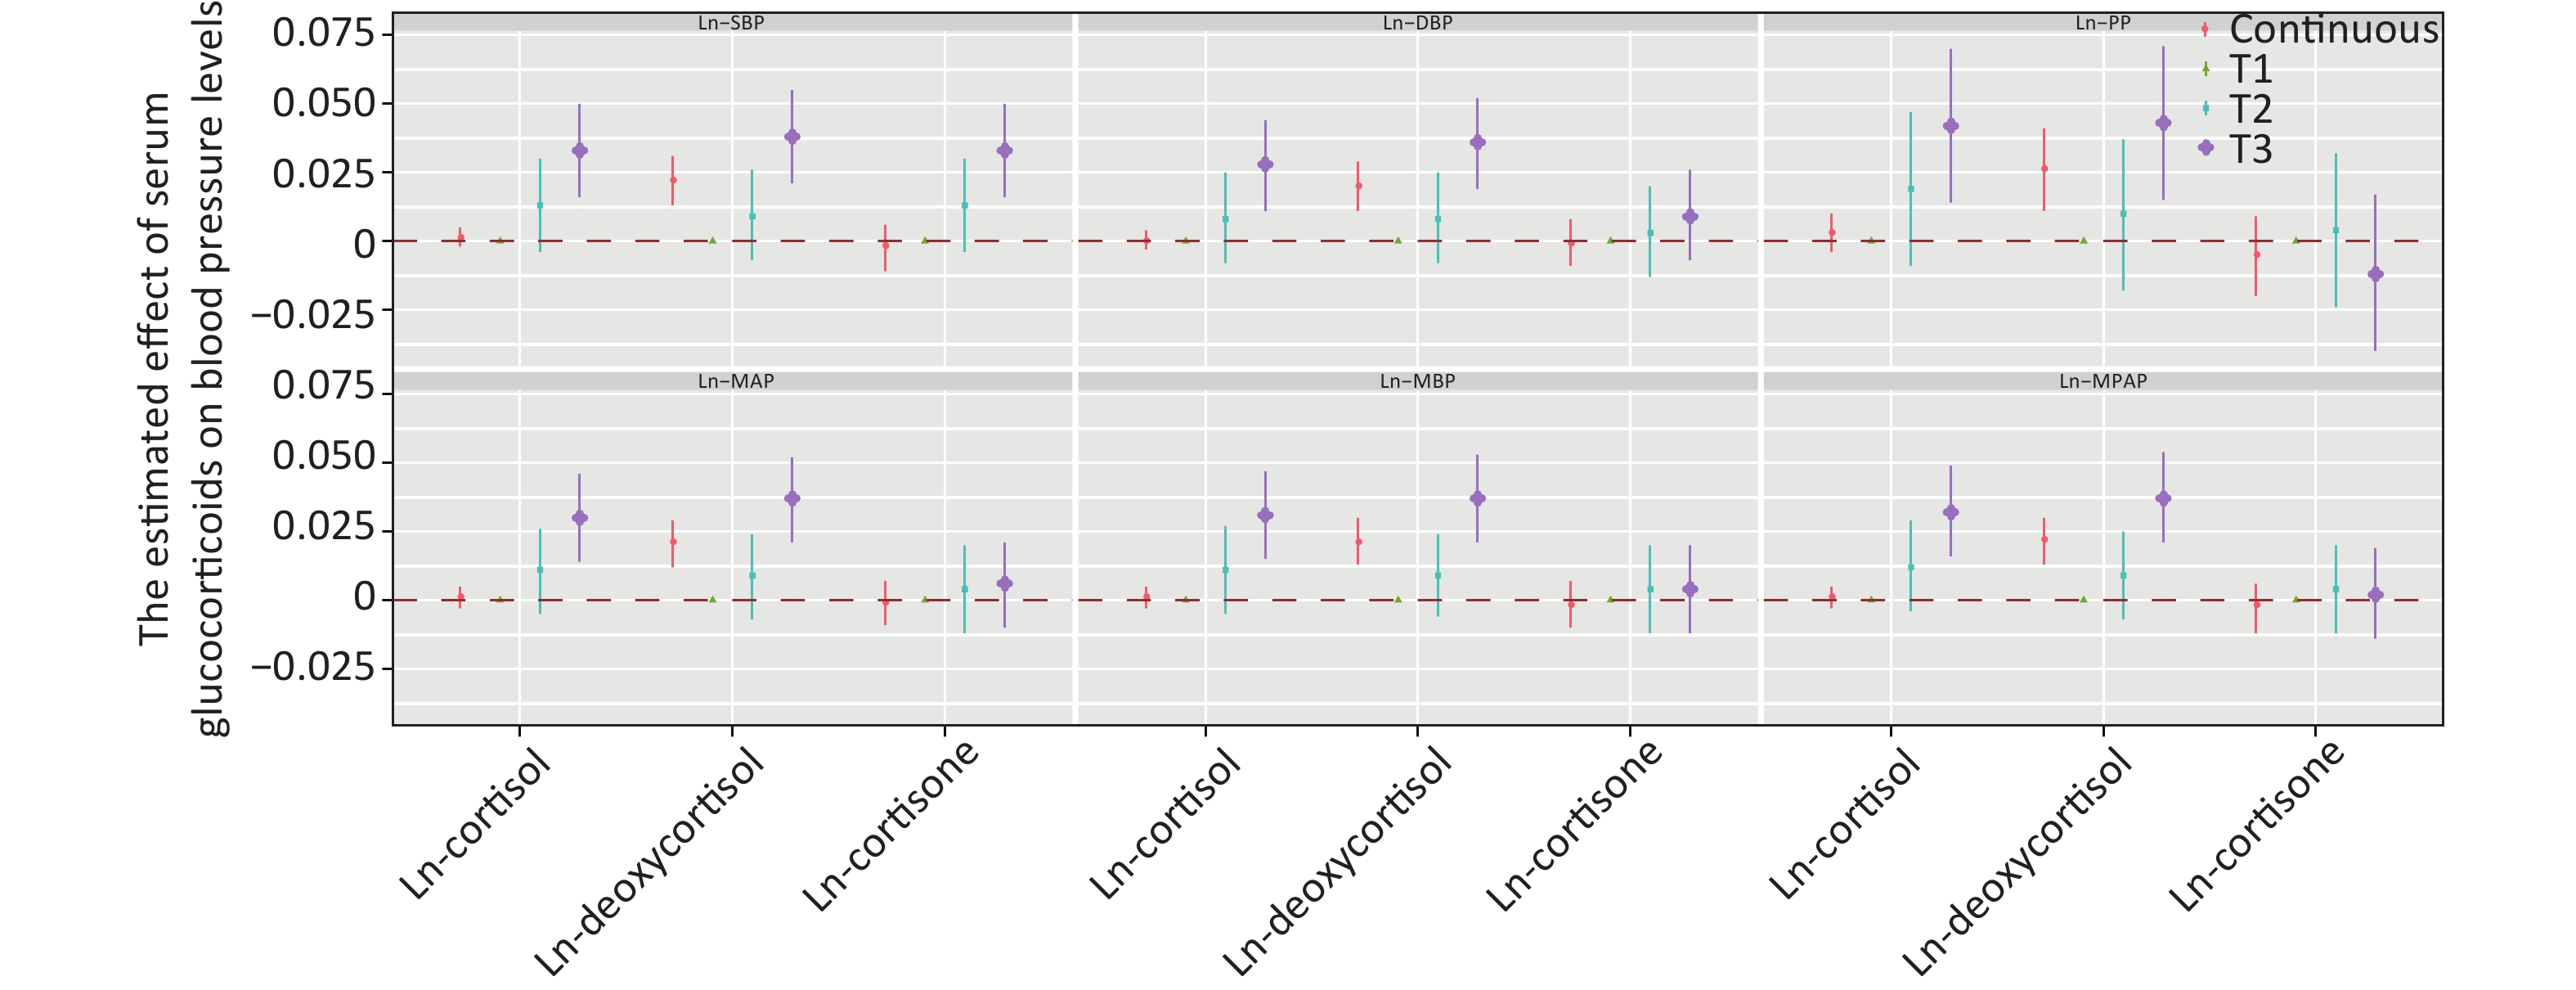
Figure 2 shows the positive correlation between deoxycortisol and various indices of blood pressure. After adjustment for multiple variables and comparison with tertile 1, only the third tertile of Ln-deoxycortisol was associated with a 0.033 mmHg (95% CI: 0.016, 0.050) higher Ln-SBP, 0.036 mmHg (0.019, 0.052) higher Ln-DBP, 0.043 mmHg (0.015, 0.071) higher Ln-PP, 0.037 mmHg (0.021, 0.052) higher Ln-MAP, 0.037 mmHg (0.021, 0.053) higher Ln-MBP, and 0.037 mmHg (0.021, 0.054) higher Ln-MPAP. The results for other models are shown in Supplementary Table S3, available in www.besjournal.com.
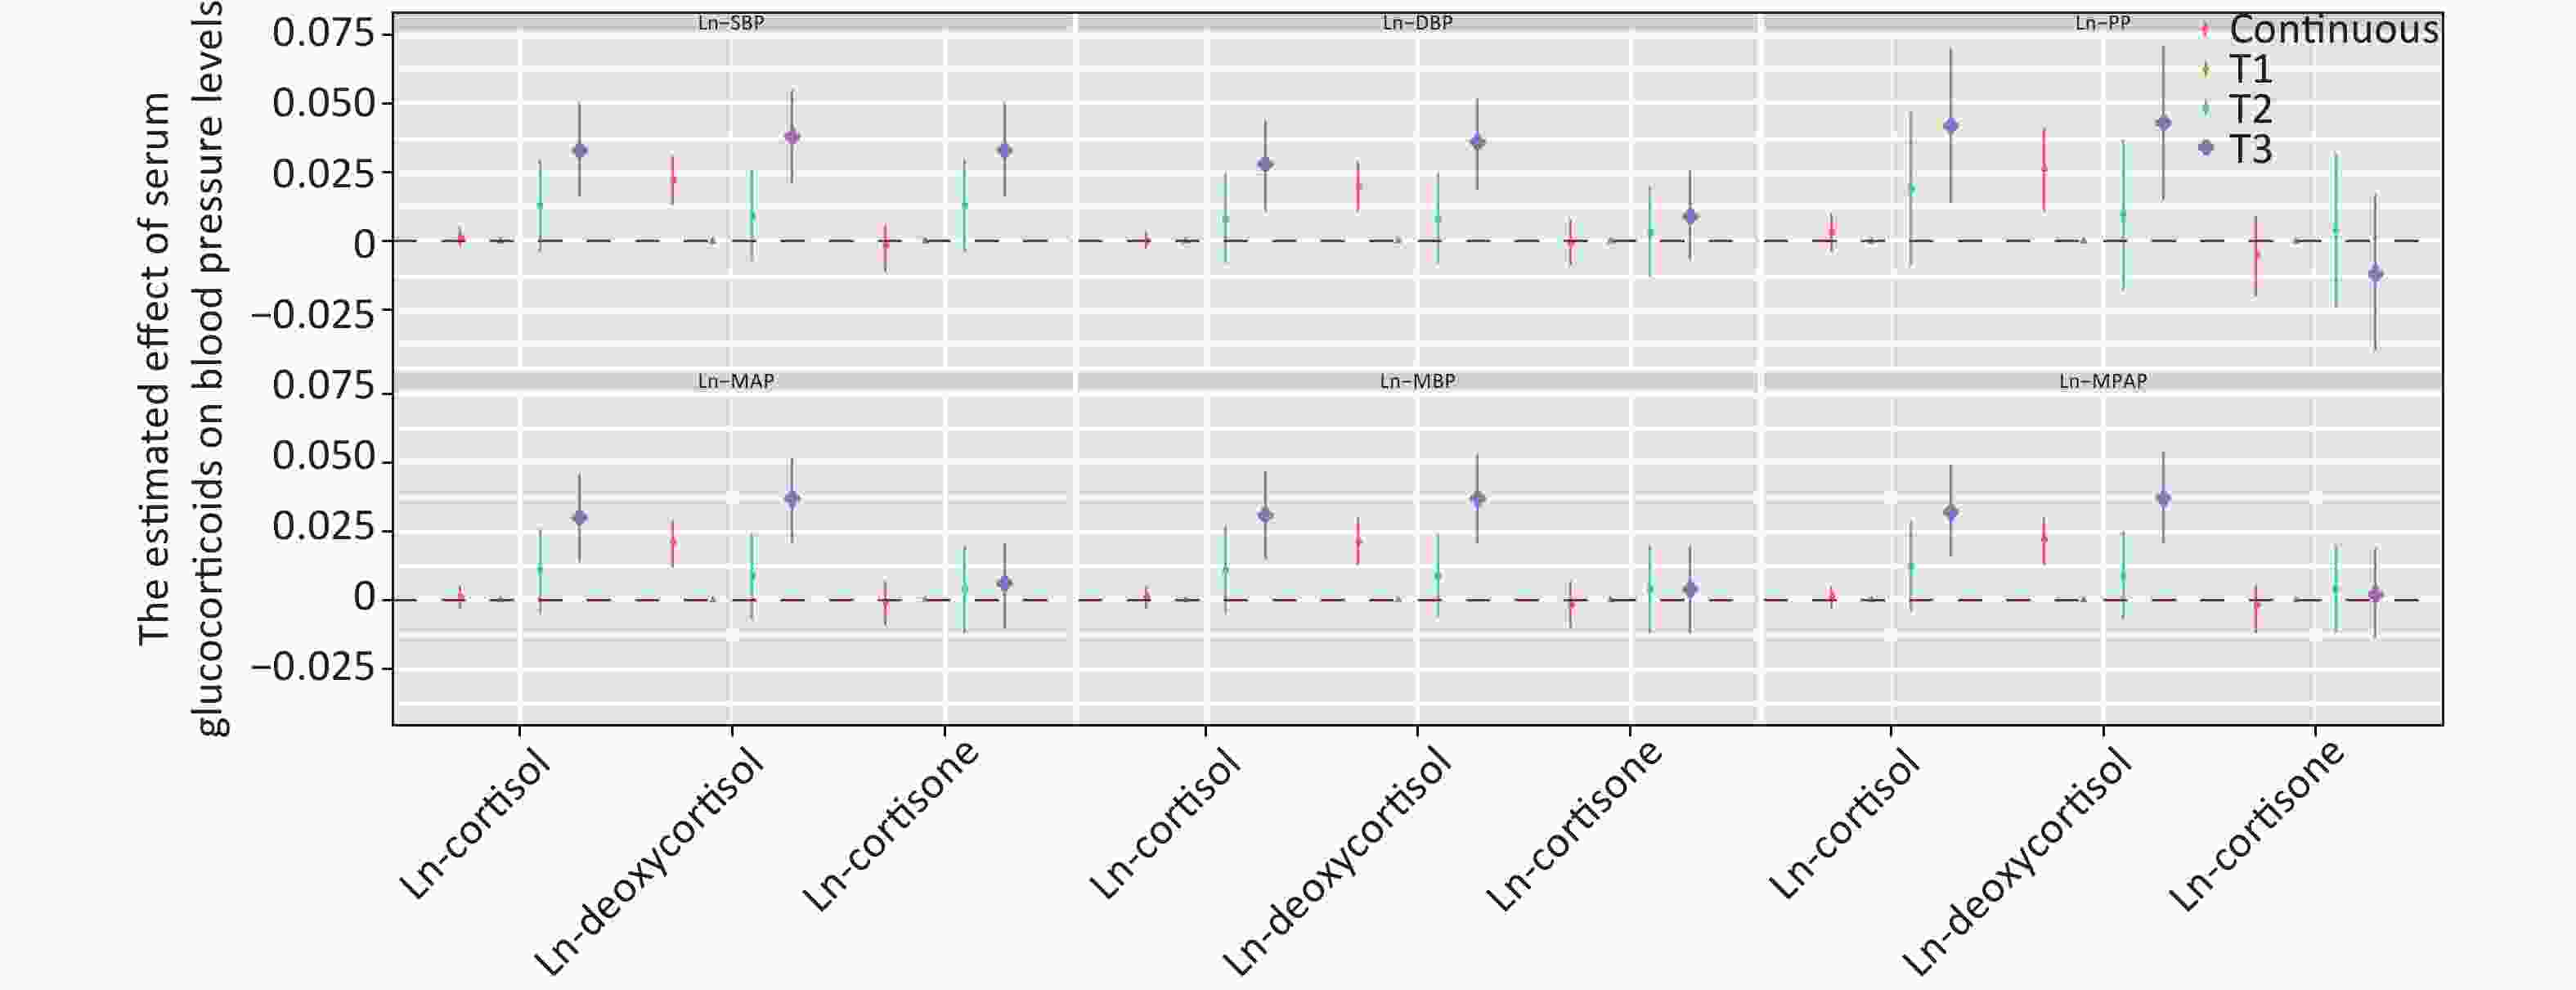
Figure 2. Estimated effect of serum glucocorticoids on blood pressure levels. The β coefficients were assessed by a linear regression model adjusted by age, sex, education, marital status, per capita monthly income, drinking and smoking status, BMI, and physical activity. SBP: systolic blood pressure; DBP: diastolic blood pressure; PP: pulse pressure; MAP: mean arterial pressure; MBP: mean blood pressure; MPAM: mean proportional arterial pressure. Ln-, natural log-transformed.
-
This study established the prevalence of co-morbidities among rural residents of Henan, China. The prevalence of hypertension (32.7%) among people with dysglycemia was not unexpected and has been described in many studies worldwide[4,34-36]. Patients with co-morbidities had higher levels of serum cortisol and deoxycortisol. Glucocorticoids are important insulin anti-regulatory hormones that strongly inhibit insulin action[37]. Increased glucocorticoids therefore may promote insulin resistance, visceral obesity, and hypertension[38]. Animal studies have shown that glucocorticoid action in the bone impairs osteoblast function, thus contributing to insulin resistance[39, 40]. Similarly, patients are prone to developing diabetes in response to high glucocorticoid levels[41]. Excess glucocorticoids can lead to abnormal metabolism and cardiovascular function, thereby inducing hypertension, hyperglycemia, and insulin resistance, which is also commonly found in patients with Cushing syndrome and metabolic syndrome[42, 43].
Our research highlighted that SBP increased with increasing serum deoxycortisol levels. Furthermore, DBP increased with increasing cortisol levels. Abundant evidence has indicated that glucocorticoids, through effects entirely independent of the mineralocorticoid receptor, induce sustained blood pressure elevation in both animals and humans[44-47]. Glucocorticoids improve vascular tension and maintain blood pressure by enhancing the sensitivity of vascular smooth muscle to catecholamine[48, 49]. Glucocorticoids therefore regulate blood pressure through the function of the heart, vascular endothelial cells, and vascular smooth muscle[23, 50, 51]. Consequently, increasing evidence indicates that spontaneous hypertension is associated with the abnormal secretion of glucocorticoids.
Glucocorticoids (deoxycortisol and cortisol) increase the risk of hypertension in people with dysglycemia, particularly those with T2DM. However, the levels of serum glucocorticoids have rarely been reported in pre-diabetic populations. The highest tertile of the Ln-cortisol was significantly associated with an increased risk of pre-diabetes, as compared with the lowest tertile. In a study on a Chinese population[15], the level of plasma cortisol in the T2DM group (5.85 nmol/L) was higher than that in controls (2.7 nmol/L), P < 0.05. A meta-analysis of 93 randomized controlled trials has shown that patients exposed to glucocorticoids have twice the risk of hypertension as those exposed to placebo [odds ratio, 2.2 (1.4–3.8)][52]. Glucocorticoid-mediated hypertension has been commonly thought to be moderated by excess sodium and water reabsorption by the renal mineralocorticoid receptor[53, 54]. In addition, glucocorticoids have been implicated in the regulation of blood pressure via a wide variety of extrarenal tissues, including the vascular smooth muscle, vascular endothelium, central nervous system, and adipose tissue[22, 23, 43, 55, 56].
This study was performed in a large sample cohort, including serum specimens from 1,688 participants with a wide age span. The major strength of this study is that it is the first of its kind, to our knowledge, to assess the relationship between glucocorticoids and an increased risk of hypertension in populations with dysglycemia (including pre-diabetes and T2DM). Moreover, the relationship between glucocorticoids and indices of blood pressure was explored through restrictive cubic spline analysis. Notwithstanding, several study limitations should also be considered. Although glucocorticoid levels fluctuate over time, we used the same morning fasting blood as that performed in other studies to detect glucocorticoids. We did not exclude the participants who used glucocorticoid drugs, because no relevant information was collected. Moreover, this was a case-control study and therefore could not determine whether the association was a causal or coincidental phenomenon. Finally, this was a single study limited to the Chinese Han population, thus potentially limiting the extrapolation of these findings to other racial groups.
-
Glucocorticoids (deoxycortisol and cortisol) increase the risk of hypertension in people with dysglycemia, particularly those with T2DM. High levels of serum glucocorticoids may promote higher SBP, PP, and MAP in people with dysglycemia and hypertension. Given that people with T2DM are already at increased risk of hypertension, patients with higher levels of glucocorticoids should have their blood pressure verified regularly and treated appropriately.
-
This study was conducted according to the guidelines of the Declaration of Helsinki, and the Ethics Committee of Zhengzhou University approved all procedures involving human participants/patients. Written informed consent was obtained from all participants/patients.
-
All authors have read and approve this version of the article, and due care has been taken to ensure the integrity of the work.
-
The data that support the findings of this study are available from The Henan Rural Cohort, but restrictions apply to the availability of these data, which were used under license for the current study and thus are not publicly available. However, data are available from the authors upon reasonable request and with permission of The Henan Rural Cohort.
-
The authors declare no conflicts of interest. Research data are not shared.
-
XL, WJL, and ZXM conceived and designed the study. SBP, CL, DDZ, SCY, JJG, JSL, and CJW performed the investigation. YX, XL, and DDW analyzed the data. YX wrote the manuscript. All authors read and approved the final manuscript.
-
The authors thank the participants and all research staff involved in the current study. The authors thank the anonymous reviewers for their helpful suggestions to improve the article.
Table S1. Association between serum Ln-glucocorticoids and dysglycemia with hypertension, stratified by baseline characteristics
Item Serum Ln-cortisol Serum Ln-deoxycortisol Serum Ln-cortisone OR lower CI upper CI P OR lower CI upper CI P OR lower CI upper CI P Sex Male 0.980 0.877 1.095 0.717 1.301 0.985 1.719 0.064 0.885 0.691 1.134 0.335 Female 1.007 0.933 1.086 0.857 1.335 1.121 1.591 0.001 1.061 0.901 1.249 0.481 Physical activity Low 1.070 0.942 1.214 0.299 1.537 1.162 2.034 0.003 0.859 0.668 1.106 0.239 Moderate 1.015 0.922 1.117 0.761 1.311 1.062 1.619 0.012 1.126 0.913 1.390 0.268 High 0.923 0.825 1.033 0.162 1.125 0.810 1.563 0.483 1.013 0.763 1.345 0.930 Age (years) < 60 1.051 0.943 1.173 0.368 1.374 1.080 1.748 0.010 1.073 0.864 1.332 0.523 ≥ 60 0.996 0.893 1.045 0.387 1.302 1.078 1.573 0.006 0.960 0.799 1.154 0.960 BMI (kg/cm2) < 24 1.040 0.925 1.169 0.512 1.370 1.066 1.761 0.014 1.047 0.822 1.334 0.708 ≥ 24 0.980 0.909 1.057 0.603 1.295 1.078 1.554 0.006 0.995 0.842 1.177 0.956 Married/cohabiting Yes 0.991 0.927 1.059 0.783 1.295 1.108 1.514 0.001 0.989 0.857 1.141 0.877 No 1.029 0.843 1.255 0.781 1.726 1.066 2.795 0.026 1.204 0.733 1.977 0.464 Note. OR: odds ratio; CI: confidence interval; BMI: body mass index. Ln-, natural log-transformed. Table S2. Association between serum Ln-glucocorticoids and dysglycemia with hypertension, excluding the population with controlled hypertension
Item OR (95% CI) P value Serum Ln-cortisol Tertile 1 1 Tertile 2 1.239 (0.909, 1.689) 0.175 Tertile 3 1.682 (1.242, 2.277) 0.001 Ptrand 0.001 Serum Ln-deoxycortisol Tertile 1 1 Tertile 2 1.239 (0.909, 1.689) 0.173 Tertile 3 1.682 (1.242, 2.277) 0.001 Ptrand 0.001 Serum Ln-cortisone Tertile 1 1 Tertile 2 1.007 (0.745, 1.362) 0.964 Tertile 3 1.082 (0.802, 1.460) 0.604 Ptrand 0.602 Note. The model was adjusted by age, sex, education, marital status, per capita monthly income, drinking and smoking status, BMI, and physical activity. OR: odds ratio; CI: confidence interval; Ln-: natural log-transformed. Table S3. Association of Ln-glucocorticoids with Ln-blood pressure
Item Linear regression β coefficients Unadjusted Model 1 Model 2 Model 3 Ln-SBP Ln-cortisol Continuous 0.002 (−0.003, 0.006) 0.002 (−0.002, 0.006) 0.002 (−0.002, 0.006) 0.001 (−0.002, 0.005) Tertile 1 Referent Referent Referent Referent Tertile 2 0.013 (−0.006, 0.031) 0.009 (−0.009, 0.027) 0.009 (−0.008, 0.027) 0.013 (−0.004, 0.030) Tertile 3 0.032 (0.014, 0.050) 0.030 (0.012, 0.047) 0.028 (0.011, 0.046) 0.033 (0.016, 0.050) Ln-deoxycortisol Continuous 0.026 (0.016, 0.036) 0.025 (0.015, 0.034) 0.024 (0.015, 0.034) 0.022 (0.013, 0.031) Tertile 1 Referent Referent Referent Referent Tertile 2 0.017 (−0.001, 0.034) 0.015 (−0.002, 0.032) 0.015 (−0.002, 0.032) 0.009 (−0.007, 0.026) Tertile 3 0.046 (0.028, 0.064) 0.043 (0.025, 0.061) 0.042 (0.025, 0.060) 0.038 (0.021, 0.055) Ln-cortisone Continuous −0.001 (−0.011, 0.008) −0.001 (−0.010, 0.008) −0.001 (−0.010, 0.008) −0.002 (−0.011, 0.006) Tertile 1 Referent Referent Referent Referent Tertile 2 0.003 (−0.015, 0.022) 0.008 (−0.010, 0.026) 0.007 (−0.010, 0.025) 0.013 (−0.004, 0.030) Tertile 3 0.004 (−0.015, 0.022) 0.006 (−0.012, 0.024) 0.006 (−0.012, 0.024) 0.033 (0.016, 0.050) Ln-SDP Ln-cortisol Continuous 0.001 (−0.003, 0.005) 0.001 (−0.00, 0.005) 0.001 (−0.003, 0.005) < 0.001 (−0.003, 0.004) Tertile 1 Referent Referent Referent Referent Tertile 2 0.001 (−0.017, 0.019) 0.004 (−0.014, 0.022) 0.004 (−0.015, 0.022) 0.008 (−0.008, 0.025) Tertile 3 0.022 (0.004, 0.041) 0.024 (0.005, 0.042) 0.022 (0.003, 0.040) 0.028 (0.011, 0.044) Ln-deoxycortisol Continuous 0.022 (0.012, 0.032) 0.024 (0.014, 0.033) 0.023 (0.013, 0.033) 0.020 (0.011, 0.029) Tertile 1 Referent Referent Referent Referent Tertile 2 0.012 (−0.006, 0.030) 0.015 (−0.003, 0.033) 0.015 (−0.003, 0.033) 0.008 (−0.008, 0.025) Tertile 3 0.040 (0.022, 0.059) 0.042 (0.024, 0.060) 0.041 (0.023, 0.059) 0.036 (0.019, 0.052) Ln-cortisone Continuous 0.002 (−0.007, 0.012) 0.002 (−0.007, 0.012) 0.002 (−0.008, 0.011) −0.001 (−0.009, 0.008) Tertile 1 Referent Referent Referent Referent Tertile 2 0.010 (−0.008, 0.029) 0.010 (−0.009, 0.028) 0.008 (−0.010, 0.026) 0.003 (−0.013, 0.020) Tertile 3 0.017 (−0.001, 0.035) 0.017 (−0.002, 0.035) 0.016 (−0.002, 0.034) 0.009 (−0.007, 0.026) Ln-PP Ln-cortisol Continuous 0.002 (−0.005, 0.010) 0.033 (−0.004, 0.010) 0.003 (−0.004, 0.010) 0.003 (−0.004, 0.010) Tertile 1 Referent Referent Referent Referent Tertile 2 0.030 (−0.002, 0.061) 0.017 (−0.012, 0.045) 0.017 (−0.011, 0.046) 0.019 (−0.009, 0.047) Tertile 3 0.046 (0.015, 0.078) 0.038 (0.010, 0.066) 0.039 (0.010, 0.067) 0.042 (0.014, 0.070) Ln-deoxycortisol Continuous 0.033 (0.016, 0.050) 0.027 (0.012, 0.042) 0.027 (0.012, 0.042) 0.026 (0.011, 0.041) Tertile 1 Referent Referent Referent Referent Tertile 2 0.024 (−0.007, 0.054) 0.014 (−0.014, 0.041) 0.014 (−0.014, 0.041) 0.010 (−0.018, 0.037) Tertile 3 0.056 (0.025, 0.088) 0.045 (0.017, 0.074) 0.045 (0.017, 0.073) 0.043 (0.015, 0.071) Ln-cortisone Continuous −0.006 (−0.023, 0.010) −0.006 (−0.021, 0.008) −0.005 (−0.020, 0.009) −0.005 (−0.020, 0.009) Tertile 1 Referent Referent Referent Referent Tertile 2 −0.007 (−0.039, 0.024) 0.005 (−0.023, 0.034) 0.006 (−0.022, 0.034) 0.004 (−0.024, 0.032) Tertile 3 −0.018 (−0.049, 0.014) −0.011 (−0.039, 0.017) −0.009 (−0.038, 0.019) −0.012 (−0.040, 0.017) Ln-MAP Ln-cortisol Continuous 0.001 (−0.003, 0.005) 0.001 (−0.003, 0.005) 0.001 (−0.003, 0.005) 0.001 (−0.003, 0.005) Tertile 1 Referent Referent Referent Referent Tertile 2 0.007 (−0.011, 0.024) 0.006 (−0.011, 0.024) 0.006 (−0.011, 0.023) 0.011 (−0.005, 0.026) Tertile 3 0.027 (0.010, 0.044) 0.026 (0.009, 0.043) 0.025 (0.008, 0.042) 0.030 (0.014, 0.046) Ln-deoxycortisol Continuous 0.024 (0.015, 0.033) 0.024 (0.015, 0.033) 0.024 (0.014, 0.033) 0.021 (0.012, 0.029) Tertile 1 Referent Referent Referent Referent Tertile 2 0.014 (−0.002, 0.031) 0.015 (−0.002, 0.032) 0.015 (−0.002, 0.032) 0.009 (−0.007, 0.024) Tertile 3 0.043 (0.026, 0.060) 0.043 (0.026, 0.060) 0.042 (0.025, 0.059) 0.037 (0.021, 0.052) Ln-cortisone Continuous 0.001 (−0.008, 0.010) 0.001 (−0.008, 0.010) < 0.001 (−0.008, 0.009) −0.001 (−0.009, 0.007) Tertile 1 Referent Referent Referent Referent Tertile 2 0.007 (−0.010, 0.024) 0.009 (−0.008, 0.026) 0.008 (−0.009, 0.025) 0.004 (−0.012, 0.020) Tertile 3 0.011 (−0.006, 0.028) 0.012 (−0.005, 0.029) 0.011 (−0.006, 0.028) 0.006 (−0.010, 0.021) Ln-MBP Ln-cortisol Continuous 0.001 (−0.003,0.005) 0.002 (−0.002, 0.006) 0.001 (−0.003, 0.006) 0.001 (−0.003, 0.005) Tertile 1 Referent Referent Referent Referent Tertile 2 0.008 (−0.009, 0.026) 0.007 (−0.010, 0.024) 0.007 (−0.010, 0.024) 0.011 (−0.005, 0.027) Tertile 3 0.028 (0.011, 0.046) 0.027 (0.010, 0.044) 0.026 (0.009, 0.043) 0.031 (0.015, 0.047) Ln-deoxycortisol Continuous 0.025 (0.015, 0.034) 0.024 (0.015, 0.033) 0.024 (0.015, 0.033) 0.021 (0.013, 0.030) Tertile 1 Referent Referent Referent Referent Tertile 2 0.015 (−0.002, 0.032) 0.015 (−0.002, 0.032) 0.015 (−0.002, 0.031) 0.009 (−0.006, 0.024) Tertile 3 0.044 (0.027, 0061) 0.043 (0.026, 0.060) 0.042 (0.025, 0.059) 0.037 (0.021, 0.053) Ln-cortisone Continuous < 0.001 (−0.009, 0.009) < 0.001 (−0.008, 0.009) < 0.001 (−0.009, 0.009) −0.002 (−0.010, 0.007) Tertile 1 Referent Referent Referent Referent Tertile 2 0.006 (−0.011, 0.023) 0.009 (−0.008, 0.026) 0.008 (−0.009, 0.025) 0.004 (−0.012, 0.020) Tertile 3 0.009 (−0.009, 0.026) 0.010 (−0.007, 0.027) 0.010 (−0.007, 0.027) 0.004 (−0.012, 0.020) Ln-MPAP Ln-cortisol Continuous 0.002 (−0.003, 0.006) 0.002 (−0.002, 0.006) 0.002 (−0.002, 0.006) 0.001 (−0.003, 0.005) Tertile 1 Referent Referent Referent Referent Tertile 2 0.011 (−0.007, 0.029) 0.009 (−0.009, 0.026) 0.009 (−0.009, 0.026) 0.012 (−0.004, 0.029) Tertile 3 0.030 (0.013, 0.048) 0.029 (0.011, 0.046) 0.027 (0.010, 0.045) 0.032 (0.016, 0.049) Ln-deoxycortisol Continuous 0.025 (0.016, 0.035) 0.024 (0.015, 0.034) 0.024 (0.015, 0.033) 0.022 (0.013, 0.030) Tertile 1 Referent Referent Referent Referent Tertile 2 0.016 (−0.001, 0.033) 0.015 (−0.002, 0.032) 0.015 (−0.002, 0.032) 0.009 (−0.007, 0.025) Tertile 3 0.045 (0.027, 0.063) 0.043 (0.025, 0.060) 0.042 (0.025, 0.059) 0.037 (0.021, 0.054) Ln-cortisone Continuous −0.001 (−0.010, 0.009) < 0.001 (−0.009, 0.009) < 0.001 (−0.009, 0.008) −0.002 (−0.010, 0.006) Tertile 1 Referent Referent Referent Referent Tertile 2 0.005 (−0.013, 0.022) 0.009 (−0.009, 0.026) 0.008 (−0.010, 0.025) 0.004 (−0.012, 0.020) Tertile 3 0.006 (−0.012, 0.023) 0.008 (−0.010, 0.025) 0.008 (−0.010, 0.025) 0.002 (−0.014, 0.019) Note. Model 1 was adjusted by age, sex, education, marital status, and per capita monthly income. Model 2 was further adjusted by drinking and smoking status, based on model 1. Model 3 was further adjusted by BMI and physical activity, based on model 2. SBP: systolic blood pressure; DBP: diastolic blood pressure; PP: pulse pressure; MAP: mean arterial pressure; MBP: mean blood pressure; MPAM: mean proportional arterial pressure. Ln-: natural log-transformed.
doi: 10.3967/bes2021.131
Association of Serum Glucocorticoids with Various Blood Pressure Indices in Patients with Dysglycemia and Hypertension: the Henan Rural Cohort Study
-
Abstract:
Objective To our knowledge, no definitive conclusion has been reached regarding the relationship between glucocorticoids and hypertension. Here, we aimed to explore the characteristics of glucocorticoids in participants with dysglycemia and hypertension, and to analyze their association with blood pressure indicators. Methods The participants of this study were from the Henan Rural Cohort study. A total of 1,688 patients 18–79 years of age were included in the matched case control study after application of the inclusion and exclusion criteria. Statistical methods were used to analyze the association between glucocorticoids and various indices of blood pressure, through approaches such as logistic regression analysis, trend tests, linear regression, and restricted cubic regression. Results The study population consisted of 552 patients with dysglycemia and hypertension (32.7%). The patients with co-morbidities had higher levels of serum cortisol (P = 0.009) and deoxycortisol (P < 0.001). The adjusted odds ratios (and 95% confidence intervals) for dysglycemia with hypertension were 1.55 (1.18, 2.04) for the highest tertile of Ln-cortisol compared with the lowest tertile. Additionally, the highest Ln-deoxycortisol levels were associated with increased prevalence of dysglycemia with hypertension by 159% (95% confidence interval: 122%, 207%). Conclusions Serum deoxycortisol was positively correlated with systolic blood pressure, pulse pressure, mean arterial pressure, mean blood pressure, and mean proportional arterial pressure. Glucocorticoids (deoxycortisol and cortisol) increase the risk of hypertension in people with dysglycemia, particularly in those with T2DM. -
Key words:
- Glucocorticoids /
- Dysglycemia with hypertension /
- Blood pressure /
- Chinese rural
-
S1. Mean and 95% confidence intervals of SBP (A1–A3) and DBP (B1–B3) along with changes in serum Ln-cortisol, Ln-deoxycortisol, and Ln-cortisone from restricted cubic splines analysis, adjusted for age, sex, education, marital status, per capita monthly income, drinking and smoking status, BMI, and physical activity. SBP: systolic blood pressure; DBP: diastolic blood pressure. Ln-, natural log-transformed.
Figure 1. Association between serum Ln-deoxycortisol and dysglycemia with hypertension, stratified by baseline characteristics. The odds ratio (OR) and 95% confidence interval (CI) were calculated by stratified logistic regression adjusted for age, sex, education, marital status, per capita monthly income, drinking and smoking status, BMI, and physical activity. BMI: body mass index.
Figure 2. Estimated effect of serum glucocorticoids on blood pressure levels. The β coefficients were assessed by a linear regression model adjusted by age, sex, education, marital status, per capita monthly income, drinking and smoking status, BMI, and physical activity. SBP: systolic blood pressure; DBP: diastolic blood pressure; PP: pulse pressure; MAP: mean arterial pressure; MBP: mean blood pressure; MPAM: mean proportional arterial pressure. Ln-, natural log-transformed.
Table 1. Characteristics of the study population with dysglycemia with and without hypertension
Variables Dysglycemia with hypertension x2/z P No Yes n = 1,136 (67.3%) n = 552 (32.7%) Age (years) 60.00 (53.00, 65.00) 63.00 (56.00, 68.00) −6.84 < 0.001 Sex, n (%) 34.96 < 0.001 Male 486 (42.8) 154 (27.9) Female 650 (57.2) 398 (72.1) Education, n (%) 18.01 0.001 Illiteracy 258 (22.7) 169 (20.6) Primary school 343 (20.2) 176 (31.9) Middle school 412 (36.3) 164 (29.7) High school or higher 123 (10.8) 43 (7.8) Marital status, n (%) 4.36 0.225 Married/cohabiting 1,105 (89.3) 483 (87.5) Widowed/divorced/separated 100 (8.8) 63 (11.4) Single 21 (1.8) 6 (1.1) Per capita monthly income (RMB), n (%) 3.84 0.429 < 500 462 (40.7) 238 (43.1) 500–999 347 (30.5) 172 (31.2) ≥ 1,000 327 (28.7) 142 (25.7) Smoking habit, n (%) 26.33 < 0.001 Never 815 (71.8) 452 (81.9) Once 89 (7.8) 41 (7.4) Current 232 (20.4) 59 (10.7) Drinking status, n (%) 8.36 0.015 Never 920 (81.0) 468 (84.8) Once 63 (5.5) 36 (6.5) Current 153 (13.5) 48 (8.7) Physical activity, n (%) 17.99 < 0.001 Low 281 (24.7) 177 (32.1) Moderate 539 (47.4) 268 (48.6) High 316 (27.8) 107 (19.4) BMI (kg/m2) 24.25 (22.15, 26.48) 25.86 (23.73, 28.04) −9.20 < 0.001 SBP (mmHg) 117.00 (109.00, 126.00) 143.00 (132.00, 152.00) −26.21 < 0.001 DBP (mmHg) 72.00 (66.00, 78.00) 84.00 (77.00, 91.00) −21.04 < 0.001 PP (mmHg) 45.00 (39.00, 51.00) 58.00 (49.00, 67.00) −19.36 < 0.001 MAP (mmHg) 87.67 (80.67, 93.33) 104.33 (96.33, 110.67) −25.16 < 0.001 MBP (mmHg) 95.00 (88.00, 101.50) 113.50 (105.13, 121.38) −25.95 < 0.001 MPAP (mmHg) 100.32 (93.49, 107.28) 121.14 (112.93, 129.08) −26.38 < 0.001 FPG (mmol/L) 5.93 (5.10, 7.63) 6.56 (5.37, 8.46) −5.09 < 0.001 HbA1c (%) 6.10 (5.80, 7.20) 6.40 (5.90, 760) −4.02 < 0.001 Serum cortisol (ng/mL) 141.95 (96.10, 189.25) 153.50 (105.33, 200.30) −2.63 0.009 Serum deoxycortisol (ng/mL) 0.30 (0.20, 0.40) 0.30 (0.20, 0.50) −3.87 < 0.001 Serum cortisone (ng/mL) 12.90 (9.50, 16.10) 12.90 (10.00, 16.60) −0.89 0.373 Ratio of serum cortisol to cortisone 10.64 (7.66, 15.35) 10.96 (7.66, 15.35) −1.04 0.300 Note. Continuous variables are expressed in median (quartiles) and compared with Mann-Whitney U test; categorical variables are expressed in percentage and compared by chi-squared test. BMI: body mass index; SBP: systolic blood pressure; DBP: diastolic blood pressure; PP: pulse pressure; MAP: mean arterial pressure; MBP: mean blood pressure; MPAM: mean proportional arterial pressure; FPG: fasting plasma glucose; HbA1c: hemoglobin A1c.  下载: 导出CSV
Table 2. Association between serum Ln-glucocorticoids and dysglycemia with hypertension
Item Crude Model 1 Model 2 Model 3 OR (95% CI) P value OR (95% CI) P value OR (95% CI) P value OR (95% CI) P value Serum Ln-cortisol Tertile 1 1 1 1 1 Tertile 2 1.203
(0.934, 1.551)0.152 1.198
(0.922, 1.556)0.177 1.194
(0.919, 1.551)0.184 1.253
(0.953, 1.646)0.106 Tertile 3 1.422
(1.107, 1.828)0.006 1.419
(1.096, 1.837)0.008 1.411
(1.089, 1.828)0.009 1.552
(1.183, 2.036)0.001 Ptrand 0.006 0.008 0.009 0.001 Serum Ln-deoxycortisol Tertile 1 1 1 1 1 Tertile 2 1.030
(0.803, 1.321)0.817 1.034
(0.799, 1.337)0.799 1.035
(0.800, 1.340)0.792 0.988
(0.755, 1.292)0.927 Tertile 3 1.565
(1.225, 1.999)< 0.001 1.558
(1.210, 2.006)0.001 1.557
(1.209, 2.005)0.001 1.591
(1.222, 2.072)0.001 Ptrand 0.001 0.001 0.001 0.001 Serum Ln-cortisone Tertile 1 1 1 1 1 Tertile 2 0.975
(0.760, 1.252)0.845 1.040
(0.804, 1.345)0.764 1.036
(0.801, 1.340)0.789 0.988
(0.755, 1.292)0.928 Tertile 3 1.078
(0.841, 1.381)0.555 1.111
(0.861, 1.434)0.419 1.101
(0.852, 1.422)0.462 1.060
(0.812, 1.385)0.668 Ptrand 0.557 0.420 0.463 0.667 Note. Model 1 was adjusted by age, sex, education, marital status, and per capita monthly income. Model 2 was further adjusted by drinking and smoking status, based on model 1. Model 3 was further adjusted by BMI and physical activity, based on model 2. Ln-, natural log-transformed.
下载: 导出CSV
Table 3. Association between serum Ln-glucocorticoids and dysglycemia with hypertension, stratified by T2DM and IFG
Item T2DM, n = 838 IFG, n = 850 OR (95% CI) P value OR (95% CI) P value Serum Ln-cortisol Tertile 1 1 1 Tertile 2 1.156 (0.786, 1.700) 0.462 1.359 (0.913, 2.022) 0.130 Tertile 3 1.530 (1.051, 2.228) 0.027 1.555 (1.041, 2.325) 0.031 Ptrand 0.026 0.031 Serum Ln-deoxycortisol Tertile 1 1 1 Tertile 2 1.051 (0.722, 1.530) 0.796 0.861 (0.580, 1.277) 0.456 Tertile 3 1.717 (1.180, 2.498) 0.005 1.429 (0.974, 2.095) 0.068 Ptrand 0.006 0.105 Serum Ln-cortisone Tertile 1 1 1 Tertile 2 0.956 (0.651, 1.404) 0.819 0.965 (0.658, 1.417) 0.857 Tertile 3 0.987 (0.673, 1.447) 0.946 1.047 (0.712, 1.541) 0.814 Ptrand 0.957 0.829 Note. T2DM: type 2 diabetes mellitus; IFG: impaired fasting glucose; OR: odds ratio; CI: confidence interval. Ln-, natural log-transformed. The model was adjusted by age, sex, education, marital status, per capita monthly income, drinking and smoking status, BMI, and physical activity.
下载: 导出CSV
S1. Association between serum Ln-glucocorticoids and dysglycemia with hypertension, stratified by baseline characteristics
Item Serum Ln-cortisol Serum Ln-deoxycortisol Serum Ln-cortisone OR lower CI upper CI P OR lower CI upper CI P OR lower CI upper CI P Sex Male 0.980 0.877 1.095 0.717 1.301 0.985 1.719 0.064 0.885 0.691 1.134 0.335 Female 1.007 0.933 1.086 0.857 1.335 1.121 1.591 0.001 1.061 0.901 1.249 0.481 Physical activity Low 1.070 0.942 1.214 0.299 1.537 1.162 2.034 0.003 0.859 0.668 1.106 0.239 Moderate 1.015 0.922 1.117 0.761 1.311 1.062 1.619 0.012 1.126 0.913 1.390 0.268 High 0.923 0.825 1.033 0.162 1.125 0.810 1.563 0.483 1.013 0.763 1.345 0.930 Age (years) < 60 1.051 0.943 1.173 0.368 1.374 1.080 1.748 0.010 1.073 0.864 1.332 0.523 ≥ 60 0.996 0.893 1.045 0.387 1.302 1.078 1.573 0.006 0.960 0.799 1.154 0.960 BMI (kg/cm2) < 24 1.040 0.925 1.169 0.512 1.370 1.066 1.761 0.014 1.047 0.822 1.334 0.708 ≥ 24 0.980 0.909 1.057 0.603 1.295 1.078 1.554 0.006 0.995 0.842 1.177 0.956 Married/cohabiting Yes 0.991 0.927 1.059 0.783 1.295 1.108 1.514 0.001 0.989 0.857 1.141 0.877 No 1.029 0.843 1.255 0.781 1.726 1.066 2.795 0.026 1.204 0.733 1.977 0.464 Note. OR: odds ratio; CI: confidence interval; BMI: body mass index. Ln-, natural log-transformed.
下载: 导出CSV
S2. Association between serum Ln-glucocorticoids and dysglycemia with hypertension, excluding the population with controlled hypertension
Item OR (95% CI) P value Serum Ln-cortisol Tertile 1 1 Tertile 2 1.239 (0.909, 1.689) 0.175 Tertile 3 1.682 (1.242, 2.277) 0.001 Ptrand 0.001 Serum Ln-deoxycortisol Tertile 1 1 Tertile 2 1.239 (0.909, 1.689) 0.173 Tertile 3 1.682 (1.242, 2.277) 0.001 Ptrand 0.001 Serum Ln-cortisone Tertile 1 1 Tertile 2 1.007 (0.745, 1.362) 0.964 Tertile 3 1.082 (0.802, 1.460) 0.604 Ptrand 0.602 Note. The model was adjusted by age, sex, education, marital status, per capita monthly income, drinking and smoking status, BMI, and physical activity. OR: odds ratio; CI: confidence interval; Ln-: natural log-transformed.
下载: 导出CSV
S3. Association of Ln-glucocorticoids with Ln-blood pressure
Item Linear regression β coefficients Unadjusted Model 1 Model 2 Model 3 Ln-SBP Ln-cortisol Continuous 0.002 (−0.003, 0.006) 0.002 (−0.002, 0.006) 0.002 (−0.002, 0.006) 0.001 (−0.002, 0.005) Tertile 1 Referent Referent Referent Referent Tertile 2 0.013 (−0.006, 0.031) 0.009 (−0.009, 0.027) 0.009 (−0.008, 0.027) 0.013 (−0.004, 0.030) Tertile 3 0.032 (0.014, 0.050) 0.030 (0.012, 0.047) 0.028 (0.011, 0.046) 0.033 (0.016, 0.050) Ln-deoxycortisol Continuous 0.026 (0.016, 0.036) 0.025 (0.015, 0.034) 0.024 (0.015, 0.034) 0.022 (0.013, 0.031) Tertile 1 Referent Referent Referent Referent Tertile 2 0.017 (−0.001, 0.034) 0.015 (−0.002, 0.032) 0.015 (−0.002, 0.032) 0.009 (−0.007, 0.026) Tertile 3 0.046 (0.028, 0.064) 0.043 (0.025, 0.061) 0.042 (0.025, 0.060) 0.038 (0.021, 0.055) Ln-cortisone Continuous −0.001 (−0.011, 0.008) −0.001 (−0.010, 0.008) −0.001 (−0.010, 0.008) −0.002 (−0.011, 0.006) Tertile 1 Referent Referent Referent Referent Tertile 2 0.003 (−0.015, 0.022) 0.008 (−0.010, 0.026) 0.007 (−0.010, 0.025) 0.013 (−0.004, 0.030) Tertile 3 0.004 (−0.015, 0.022) 0.006 (−0.012, 0.024) 0.006 (−0.012, 0.024) 0.033 (0.016, 0.050) Ln-SDP Ln-cortisol Continuous 0.001 (−0.003, 0.005) 0.001 (−0.00, 0.005) 0.001 (−0.003, 0.005) < 0.001 (−0.003, 0.004) Tertile 1 Referent Referent Referent Referent Tertile 2 0.001 (−0.017, 0.019) 0.004 (−0.014, 0.022) 0.004 (−0.015, 0.022) 0.008 (−0.008, 0.025) Tertile 3 0.022 (0.004, 0.041) 0.024 (0.005, 0.042) 0.022 (0.003, 0.040) 0.028 (0.011, 0.044) Ln-deoxycortisol Continuous 0.022 (0.012, 0.032) 0.024 (0.014, 0.033) 0.023 (0.013, 0.033) 0.020 (0.011, 0.029) Tertile 1 Referent Referent Referent Referent Tertile 2 0.012 (−0.006, 0.030) 0.015 (−0.003, 0.033) 0.015 (−0.003, 0.033) 0.008 (−0.008, 0.025) Tertile 3 0.040 (0.022, 0.059) 0.042 (0.024, 0.060) 0.041 (0.023, 0.059) 0.036 (0.019, 0.052) Ln-cortisone Continuous 0.002 (−0.007, 0.012) 0.002 (−0.007, 0.012) 0.002 (−0.008, 0.011) −0.001 (−0.009, 0.008) Tertile 1 Referent Referent Referent Referent Tertile 2 0.010 (−0.008, 0.029) 0.010 (−0.009, 0.028) 0.008 (−0.010, 0.026) 0.003 (−0.013, 0.020) Tertile 3 0.017 (−0.001, 0.035) 0.017 (−0.002, 0.035) 0.016 (−0.002, 0.034) 0.009 (−0.007, 0.026) Ln-PP Ln-cortisol Continuous 0.002 (−0.005, 0.010) 0.033 (−0.004, 0.010) 0.003 (−0.004, 0.010) 0.003 (−0.004, 0.010) Tertile 1 Referent Referent Referent Referent Tertile 2 0.030 (−0.002, 0.061) 0.017 (−0.012, 0.045) 0.017 (−0.011, 0.046) 0.019 (−0.009, 0.047) Tertile 3 0.046 (0.015, 0.078) 0.038 (0.010, 0.066) 0.039 (0.010, 0.067) 0.042 (0.014, 0.070) Ln-deoxycortisol Continuous 0.033 (0.016, 0.050) 0.027 (0.012, 0.042) 0.027 (0.012, 0.042) 0.026 (0.011, 0.041) Tertile 1 Referent Referent Referent Referent Tertile 2 0.024 (−0.007, 0.054) 0.014 (−0.014, 0.041) 0.014 (−0.014, 0.041) 0.010 (−0.018, 0.037) Tertile 3 0.056 (0.025, 0.088) 0.045 (0.017, 0.074) 0.045 (0.017, 0.073) 0.043 (0.015, 0.071) Ln-cortisone Continuous −0.006 (−0.023, 0.010) −0.006 (−0.021, 0.008) −0.005 (−0.020, 0.009) −0.005 (−0.020, 0.009) Tertile 1 Referent Referent Referent Referent Tertile 2 −0.007 (−0.039, 0.024) 0.005 (−0.023, 0.034) 0.006 (−0.022, 0.034) 0.004 (−0.024, 0.032) Tertile 3 −0.018 (−0.049, 0.014) −0.011 (−0.039, 0.017) −0.009 (−0.038, 0.019) −0.012 (−0.040, 0.017) Ln-MAP Ln-cortisol Continuous 0.001 (−0.003, 0.005) 0.001 (−0.003, 0.005) 0.001 (−0.003, 0.005) 0.001 (−0.003, 0.005) Tertile 1 Referent Referent Referent Referent Tertile 2 0.007 (−0.011, 0.024) 0.006 (−0.011, 0.024) 0.006 (−0.011, 0.023) 0.011 (−0.005, 0.026) Tertile 3 0.027 (0.010, 0.044) 0.026 (0.009, 0.043) 0.025 (0.008, 0.042) 0.030 (0.014, 0.046) Ln-deoxycortisol Continuous 0.024 (0.015, 0.033) 0.024 (0.015, 0.033) 0.024 (0.014, 0.033) 0.021 (0.012, 0.029) Tertile 1 Referent Referent Referent Referent Tertile 2 0.014 (−0.002, 0.031) 0.015 (−0.002, 0.032) 0.015 (−0.002, 0.032) 0.009 (−0.007, 0.024) Tertile 3 0.043 (0.026, 0.060) 0.043 (0.026, 0.060) 0.042 (0.025, 0.059) 0.037 (0.021, 0.052) Ln-cortisone Continuous 0.001 (−0.008, 0.010) 0.001 (−0.008, 0.010) < 0.001 (−0.008, 0.009) −0.001 (−0.009, 0.007) Tertile 1 Referent Referent Referent Referent Tertile 2 0.007 (−0.010, 0.024) 0.009 (−0.008, 0.026) 0.008 (−0.009, 0.025) 0.004 (−0.012, 0.020) Tertile 3 0.011 (−0.006, 0.028) 0.012 (−0.005, 0.029) 0.011 (−0.006, 0.028) 0.006 (−0.010, 0.021) Ln-MBP Ln-cortisol Continuous 0.001 (−0.003,0.005) 0.002 (−0.002, 0.006) 0.001 (−0.003, 0.006) 0.001 (−0.003, 0.005) Tertile 1 Referent Referent Referent Referent Tertile 2 0.008 (−0.009, 0.026) 0.007 (−0.010, 0.024) 0.007 (−0.010, 0.024) 0.011 (−0.005, 0.027) Tertile 3 0.028 (0.011, 0.046) 0.027 (0.010, 0.044) 0.026 (0.009, 0.043) 0.031 (0.015, 0.047) Ln-deoxycortisol Continuous 0.025 (0.015, 0.034) 0.024 (0.015, 0.033) 0.024 (0.015, 0.033) 0.021 (0.013, 0.030) Tertile 1 Referent Referent Referent Referent Tertile 2 0.015 (−0.002, 0.032) 0.015 (−0.002, 0.032) 0.015 (−0.002, 0.031) 0.009 (−0.006, 0.024) Tertile 3 0.044 (0.027, 0061) 0.043 (0.026, 0.060) 0.042 (0.025, 0.059) 0.037 (0.021, 0.053) Ln-cortisone Continuous < 0.001 (−0.009, 0.009) < 0.001 (−0.008, 0.009) < 0.001 (−0.009, 0.009) −0.002 (−0.010, 0.007) Tertile 1 Referent Referent Referent Referent Tertile 2 0.006 (−0.011, 0.023) 0.009 (−0.008, 0.026) 0.008 (−0.009, 0.025) 0.004 (−0.012, 0.020) Tertile 3 0.009 (−0.009, 0.026) 0.010 (−0.007, 0.027) 0.010 (−0.007, 0.027) 0.004 (−0.012, 0.020) Ln-MPAP Ln-cortisol Continuous 0.002 (−0.003, 0.006) 0.002 (−0.002, 0.006) 0.002 (−0.002, 0.006) 0.001 (−0.003, 0.005) Tertile 1 Referent Referent Referent Referent Tertile 2 0.011 (−0.007, 0.029) 0.009 (−0.009, 0.026) 0.009 (−0.009, 0.026) 0.012 (−0.004, 0.029) Tertile 3 0.030 (0.013, 0.048) 0.029 (0.011, 0.046) 0.027 (0.010, 0.045) 0.032 (0.016, 0.049) Ln-deoxycortisol Continuous 0.025 (0.016, 0.035) 0.024 (0.015, 0.034) 0.024 (0.015, 0.033) 0.022 (0.013, 0.030) Tertile 1 Referent Referent Referent Referent Tertile 2 0.016 (−0.001, 0.033) 0.015 (−0.002, 0.032) 0.015 (−0.002, 0.032) 0.009 (−0.007, 0.025) Tertile 3 0.045 (0.027, 0.063) 0.043 (0.025, 0.060) 0.042 (0.025, 0.059) 0.037 (0.021, 0.054) Ln-cortisone Continuous −0.001 (−0.010, 0.009) < 0.001 (−0.009, 0.009) < 0.001 (−0.009, 0.008) −0.002 (−0.010, 0.006) Tertile 1 Referent Referent Referent Referent Tertile 2 0.005 (−0.013, 0.022) 0.009 (−0.009, 0.026) 0.008 (−0.010, 0.025) 0.004 (−0.012, 0.020) Tertile 3 0.006 (−0.012, 0.023) 0.008 (−0.010, 0.025) 0.008 (−0.010, 0.025) 0.002 (−0.014, 0.019) Note. Model 1 was adjusted by age, sex, education, marital status, and per capita monthly income. Model 2 was further adjusted by drinking and smoking status, based on model 1. Model 3 was further adjusted by BMI and physical activity, based on model 2. SBP: systolic blood pressure; DBP: diastolic blood pressure; PP: pulse pressure; MAP: mean arterial pressure; MBP: mean blood pressure; MPAM: mean proportional arterial pressure. Ln-: natural log-transformed.
下载: 导出CSV
-
[1] Zhai Y, Ren ZP, Zhang M, et al. Abdominal obesity and its attribution to all-cause mortality in the general population with 14 years follow-up: findings from Shanxi cohort in China. Biomed Environ Sci, 2020; 33, 227−37. [2] Liang B, Tang WW, Zhang WQ, et al. Prevalence and associated factors of diabetes mellitus in a very elderly Chinese population: a cross-sectional study. Biomed Environ Sci, 2020; 33, 315−22. [3] Kemps H, Krankel N, Dörr M, et al. Exercise training for patients with type 2 diabetes and cardiovascular disease: What to pursue and how to do it. A Position Paper of the European Association of Preventive Cardiology (EAPC). Eur J Prev Cardiol, 2019; 26, 709−27. [4] Lopez-Jaramillo P, Lopez-Lopez J, Lopez-Lopez C, et al. The goal of blood pressure in the hypertensive patient with diabetes is defined: now the challenge is go from recommendations to practice. Diabetol Metab Syndr, 2014; 6, 31. doi: 10.1186/1758-5996-6-31 [5] Chinese Medical Association Diabetes Society. Guidelines for the prevention and treatment of type 2 diabetes mellitus in China (2013 vertion). Chin J Diabetes, 2014; 22, 2−42. (In Chinese [6] Messerli FH, Grossman E. Diabetes, hypertension, and cardiovascular disease: an update. Hypertension, 2001; 38, E11. [7] Collins R, MacMahon S. Blood pressure, antihypertensive drug treatment and the risks of stroke and of coronary heart disease. Br Med Bull, 1994; 50, 272−98. doi: 10.1093/oxfordjournals.bmb.a072892 [8] Cushman WC, Evans GW, Byington RP, et al. Effects of intensive blood-pressure control in type 2 diabetes mellitus. N Engl J Med, 2010; 362, 1575−85. doi: 10.1056/NEJMoa1001286 [9] Vaccaro O, Stamler J, Neaton JD. Sixteen-year coronary mortality in black and white men with diabetes screened for the Multiple Risk Factor Intervention Trial (MRFIT). Int J Epidemiol, 1998; 27, 636−41. doi: 10.1093/ije/27.4.636 [10] UK Prospective Diabetes Study Group. Tight blood pressure control and risk of macrovascular and microvascular complications in type 2 diabetes: UKPDS 38. UK Prospective Diabetes Study Group. BMJ, 1998; 317, 703−13. [11] Taves MD, Ashwell JD. Glucocorticoids in T cell development, differentiation and function. Nat Rev Immunol, 2021; 21, 233−43. doi: 10.1038/s41577-020-00464-0 [12] Park SR, Kim SK, Kim SR, et al. Noncanonical functions of glucocorticoids: a novel role for glucocorticoids in performing multiple beneficial functions in endometrial stem cells. Cell Death Dis, 2021; 12, 612. doi: 10.1038/s41419-021-03893-4 [13] Seppä S, Tenhola S, Voutilainen R. Association of serum total osteocalcin concentrations with endogenous glucocorticoids and insulin sensitivity markers in 12-year-old children: a cross-sectional study. Front Endocrinol, 2019; 10, 798. doi: 10.3389/fendo.2019.00798 [14] Wallerius S, Rosmond R, Ljung T, et al. Rise in morning saliva cortisol is associated with abdominal obesity in men: a preliminary report. J Endocrinol Invest, 2003; 26, 616−9. doi: 10.1007/BF03347017 [15] Wang XH, Tian HM. Plasma levels of cortisol, free fatty acids and their relationships to insulin resistance in patients with type 2 diabetes. Chin J Endocrinol Metab, 2004; 20, 210−1. (In Chinese [16] Grossmann C, Scholz T, Rochel M, et al. Transactivation via the human glucocorticoid and mineralocorticoid receptor by therapeutically used steroids in CV-1 cells: a comparison of their glucocorticoid and mineralocorticoid properties. Eur J Endocrinol, 2004; 151, 397−406. doi: 10.1530/eje.0.1510397 [17] Fardet L, Nazareth I, Petersen I. Synthetic glucocorticoids and early variations of blood pressure: a population-based cohort study. J Clin Endocrinol Metab, 2015; 100, 2777−83. doi: 10.1210/jc.2015-1127 [18] Shubin H. Long term (five or more years) administration of corticosteroids in pulmonary diseases. Dis Chest, 1965; 48, 287−90. doi: 10.1378/chest.48.3.287 [19] Covar RA, Leung DYM, McCormick D, et al. Risk factors associated with glucocorticoid-induced adverse effects in children with severe asthma. J Allergy Clin Immunol, 2000; 106, 651−9. doi: 10.1067/mai.2000.109830 [20] Glorioso N, Filigheddu F, Parpaglia PP, et al. 11 β-hydroxysteroid dehydrogenase type 2 activity is associated with left ventricular mass in essential hypertension. Eur Heart J, 2005; 26, 498−504. doi: 10.1093/eurheartj/ehi070 [21] Fukuda S, Yasu T, Kobayashi N, et al. Contribution of fluid shear response in leukocytes to hemodynamic resistance in the spontaneously hypertensive rat. Circ Res, 2004; 95, 100−8. doi: 10.1161/01.RES.0000133677.77465.38 [22] Schäfer SC, Wallerath T, Closs EI, et al. Dexamethasone suppresses eNOS and CAT-1 and induces oxidative stress in mouse resistance arterioles. Am J Physiol-Heart Circ Physiol, 2005; 288, H436−44. doi: 10.1152/ajpheart.00587.2004 [23] Yang SM, Zhang LB. Glucocorticoids and vascular reactivity. Curr Vasc Pharmacol, 2004; 2, 1−12. doi: 10.2174/1570161043476483 [24] Mildenhall LFJ, Battin MR, Morton SMB, et al. Exposure to repeat doses of antenatal glucocorticoids is associated with altered cardiovascular status after birth. Arch Dis Child Fetal Neonatal Ed, 2006; 91, F56−60. [25] Liu XT, Mao ZX, Li YQ, et al. Cohort profile: the Henan rural cohort: a prospective study of chronic non-communicable diseases. Int J Epidemiol, 2019; 48, 1756−j. doi: 10.1093/ije/dyz039 [26] Liu X, Jiang JJ, Liu XT, et al. Association of serum testosterone with different classes of glucose metabolism and the mediation effect of obesity: the Henan Rural Cohort Study. Diabetes Metab Res Rev, 2019; 35, e3133. [27] Xue Y, Yang KL, Wang BY, et al. Reproducibility and validity of an FFQ in the Henan Rural Cohort Study. Public Health Nutr, 2020; 23, 34−40. doi: 10.1017/S1368980019002416 [28] Craig CL, Marshall AL, Sjöström M, et al. International physical activity questionnaire: 12-country reliability and validity. Med Sci Sport Exer, 2003; 35, 1381−95. doi: 10.1249/01.MSS.0000078924.61453.FB [29] Tian ZY, Li YQ, Mao ZX, et al. Sex-specific relationship between visceral fat index and dyslipidemia in Chinese rural adults: the Henan Rural Cohort Study. Prev Med, 2018; 116, 104−11. doi: 10.1016/j.ypmed.2018.09.009 [30] Zhang HQ, Li YQ, Mao ZX, et al. A dose-response association of night sleep duration with hypertension in a Chinese rural population: the Henan Rural Cohort Study. J Am Soc Hypertens, 2018; 12, 867−79.e3. doi: 10.1016/j.jash.2018.10.005 [31] Franklin SS, Lopez VA, Wong ND, et al. Single versus combined blood pressure components and risk for cardiovascular disease the Framingham heart study. Circulation, 2009; 119, 243−50. doi: 10.1161/CIRCULATIONAHA.108.797936 [32] Lewington S, Clarke R, Qizilbash N, et al. Age-specific relevance of usual blood pressure to vascular mortality: a meta-analysis of individual data for one million adults in 61 prospective studies. Lancet, 2002; 360, 1903−13. doi: 10.1016/S0140-6736(02)11911-8 [33] Zhang HQ, Li YQ, Zhao XY, et al. The association between PSQI score and hypertension in a Chinese rural population: the Henan Rural Cohort Study. Sleep Med, 2019; 58, 27−34. doi: 10.1016/j.sleep.2019.03.001 [34] Yu D, Du ML, Sun DJ, et al. Characteristics of hypertension death in low-income regions of Inner Mongolia, China. Biomed Environ Sci, 2020; 33, 53−7. [35] Adeniyi OV, Yogeswaran P, Longo-Mbenza B, et al. Uncontrolled hypertension and its determinants in patients with concomitant type 2 diabetes mellitus (T2DM) in rural South Africa. PLoS One, 2016; 11, e0150033. doi: 10.1371/journal.pone.0150033 [36] Chow CK, Teo KK, Rangarajan S, et al. Prevalence, awareness, treatment, and control of hypertension in rural and urban communities in high-, middle-, and low-income countries. JAMA, 2013; 310, 959−68. doi: 10.1001/jama.2013.184182 [37] Kotani M, Tamura N, Inoue T, et al. A case of type B insulin resistance syndrome treated with low-dose glucocorticoids. Endocrinol Diabetes Metab Case Rep, 2019; 2019, 19−0115. [38] Liu YJ, Nakagawa Y, Wang Y, et al. Increased glucocorticoid receptor and 11 β-hydroxysteroid dehydrogenase type 1 expression in hepatocytes may contribute to the phenotype of type 2 diabetes in db/db mice. Diabetes, 2005; 54, 32−40. doi: 10.2337/diabetes.54.1.32 [39] Cooper MS, Seibel MJ, Zhou H. Glucocorticoids, bone and energy metabolism. Bone, 2016; 82, 64−8. doi: 10.1016/j.bone.2015.05.038 [40] Brennan-Speranza TC, Henneicke H, Gasparini SJ, et al. Osteoblasts mediate the adverse effects of glucocorticoids on fuel metabolism. J Clin Invest, 2012; 122, 4172−89. doi: 10.1172/JCI63377 [41] Kokkinopoulou I, Diakoumi A, Moutsatsou P. Glucocorticoid receptor signaling in diabetes. Int J Mol Sci, 2021; 22, 11173. doi: 10.3390/ijms222011173 [42] Björntorp P, Holm G, Rosmond R. Hypothalamic arousal, insulin resistance and Type 2 diabetes mellitus. Diabet Med, 1999; 16, 373−83. doi: 10.1046/j.1464-5491.1999.00067.x [43] Goodwin JE, Geller DS. Glucocorticoid-induced hypertension. Pediatr Nephrol, 2012; 27, 1059−66. doi: 10.1007/s00467-011-1928-4 [44] Bertagna X, Bertagna C, Laudat MH, et al. Pituitary-adrenal response to the antiglucocorticoid action of RU 486 in Cushing's syndrome. J Clin Endocrinol Metab, 1986; 63, 639−43. doi: 10.1210/jcem-63-3-639 [45] Kalimi M. Role of antiglucocorticoid RU 486 on dexamethasone-induced hypertension in rats. Am J Physiol Endocrinol Metab, 1989; 256, E682−5. doi: 10.1152/ajpendo.1989.256.5.E682 [46] Mangos GJ, Whitworth JA, Williamson PM, et al. Glucocorticoids and the kidney. Nephrology, 2003; 8, 267−73. doi: 10.1111/j.1440-1797.2003.00215.x [47] Banerjee RR, Marina N, Katznelson L, et al. Mifepristone treatment of Cushing's syndrome in a pediatric patient. Pediatrics, 2015; 136, E1377−81. doi: 10.1542/peds.2015-0684 [48] Davies AO, Lefkowitz RJ. Regulation of β-adrenergic receptors by steroid hormones. Annu Rev Physiol, 1984; 46, 119−30. doi: 10.1146/annurev.ph.46.030184.001003 [49] Odore R, Badino P, Pagliasso S, et al. Changes in lymphocyte glucocorticoid and β-adrenergic receptors in veal calves treated with clenbuterol and steroid hormones for growth-promoting purposes. J Vet Pharmacol Ther, 2006; 29, 91−7. doi: 10.1111/j.1365-2885.2006.00719.x [50] Whitworth JA, Brown MA, Kelly JJ, et al. Experimental studies on cortisol-induced hypertension in humans. J Hum Hypertens, 1995; 9, 395−9. [51] Liang W. Variation in food quality may threaten the validity of epidemiological studies in China. J Epidemiol Community Health, 2006; 60, 1099. doi: 10.1136/jech.2006.049957 [52] Conn PHO, Poynard T. Corticosteroids and peptic ulcer: meta-analysis of adverse events during steroid therapy. J Intern Med, 1994; 236, 619−32. doi: 10.1111/j.1365-2796.1994.tb00855.x [53] Baid S, Nieman LK. Glucocorticoid excess and hypertension. Curr Hypertens Rep, 2004; 6, 493−9. doi: 10.1007/s11906-004-0046-0 [54] Whitworth JA, Mangos GJ, Kelly JJ. Cushing, cortisol, and cardiovascular disease. Hypertension, 2000; 36, 912−6. doi: 10.1161/01.HYP.36.5.912 [55] Mir N, Chin SA, Riddell MC, et al. Genomic and non-genomic actions of glucocorticoids on adipose tissue lipid metabolism. Int J Mol Sci, 2021; 22, 8503. doi: 10.3390/ijms22168503 [56] Martocchia A, Curto M, Toussan L, et al. Pharmacological strategies against glucocorticoid-mediated brain damage during chronic disorders. Recent Pat CNS Drug Discov, 2011; 6, 196−204. -
 21098Supplementary Materials.pdf

-

 点击查看大图
计量
- 文章访问数: 1251
- HTML全文浏览量: 531
- PDF下载量: 147
- 被引次数: 0


 Quick Links