

 下载:
下载:

-
Persistent high-risk human papillomavirus (HR-HPV) infection has become a research hotspot in recent years; however, clinical practice has found that not all women with HR-HPV infection develop cervical lesions[1,2]. The immune system has an automatic clearance effect on HR-HPV infection; however, some patients with HR-HPV infection eventually develop cervical cancer[3]. Therefore, factors that influence the outcome of HR-HPV infection have attracted attention, and it is speculated that the main influencing mechanism is immune regulation[4,5]. Cytokines mediate innate immunity and specific immune responses[4,6]. Therefore, it plays an important role in human defense mechanisms and acute-phase responses. Some studies have reported an association between systemic cytokines, gynecological diseases[4,7], and local microenvironmental cytokines[5,8,9]. It is unknown whether systemic and local immunity are consistent in the same patient with HR-HPV infection at the same time. Therefore, this study explored the difference between local and systemic immunity in women with cervical HR-HPV infection and focused on the role of local microenvironmental cytokines in the occurrence of high-grade squamous intraepithelial lesions (HSIL).
-
A total of 73 patients with HR-HPV infection and 31 healthy screening subjects with negative HR-HPV results were enrolled between March 2023 and June 2025. The former were from the Shanghai First Maternity and Infant Health Care Hospital, and the latter were from the Shanghai First Maternity and Infant Health Care Hospital and Shanghai East Hospital. The inclusion criteria were as follows: non-menopausal women aged 21–55 years with a sexual life and no history of vaginal irrigation, medication, or sexual life within 3 days of sampling. Both the cervix and the uterus were intact. Exclusion criteria included various malignant tumors, other immune functions or endocrine system diseases, mental illness, unconsciousness, or uncooperation. According to the pathological diagnosis, 73 patients with HR-HPV infection were divided into HSIL (n = 33) and non-HSIL (N-HSIL) (n = 40) groups. This study was approved by the Medical Ethics Committees of Shanghai First Maternity and Infant Hospital (Ethics No.: KS 23359) and Shanghai East Hospital (2024 Research Review No. 031).
-
Cervical secretion samples were collected from all study participants during the non-menstrual period. The speculum was placed in the vagina and the cervical and vaginal walls were fully exposed. A dry, sterile cotton swab was used to collect the appropriate amount of secretion from the cervical orifice and was set aside. Within 4 h, the secretions on the sterile cotton swab were eluted in a sterile EP tube equipped with 1 ml of normal saline, mixed by swirling, centrifuged at 4000 rpm at 4 °C for 10 min, and the supernatant was collected. The samples were stored at -80 °C until use.
-
In certain study subjects, EDTA-anticoagulated blood and secretions were collected simultaneously because of the requirements for routine blood testing. Similar to the pretreatment of secretions, within 4 h we performed centrifugation at 4000 rpm at 4 °C for 10 min, and the plasma was collected and stored in the refrigerator at -80 °C until use.
-
Flow cytometry was performed using a Mindray BriCyteE6 (Mindray Bio-Medical Electronics Co. Ltd., China). A cytokine joint detection kit was purchased from Shanghai Yingyu Biotechnology Co., Ltd.. This assay is based on immunofluorescence staining. There were 12 types of capture microspheres with different fluorescence intensities in the capture microsphere mixture in the kit, and 12 types of specific antibodies were coated on the surface of the capture microspheres. The captured microspheres specifically bound to the cytokines in the tested samples and then bound to the PE-labeled fluorescence detection reagents. A double-antibody sandwich complex was formed by capturing the microspheres, samples to be tested, and detection antibodies. By analyzing the fluorescence intensity of the double-antibody sandwich complex, the cytokine content of the sample was determined to assist in judging the immune function status of the body. Additionally, all collected samples were tested after excluding unqualified samples, such as those with hemolysis.
-
Data processing and analysis were performed using R version 4.3.3 (2024-02-29) and Zstats 1.0 (www.zstats.net). GraphPad Prism 10 software was used for analysis. Non-parametric tests, including Wilcoxon matched-pairs signed rank and Mann-Whitney tests, were used in this study; P < 0.05 was considered statistically significant.
-
We examined contemporaneous plasma and secretory cytokines from 13 patients with HR-HPV and 12 negative for HR-HPV. The results showed that there were statistical differences in eight cytokines between the two sample types of the same patient, showing that IL-2, IL-6, TNF-α, IFN-γ, IL-1β, IL-12p70, IFN-α, and IL-8 were dominant in the secretion. The systemic cytokine profile does not reflect immunity in the local microenvironment (Figure 1).
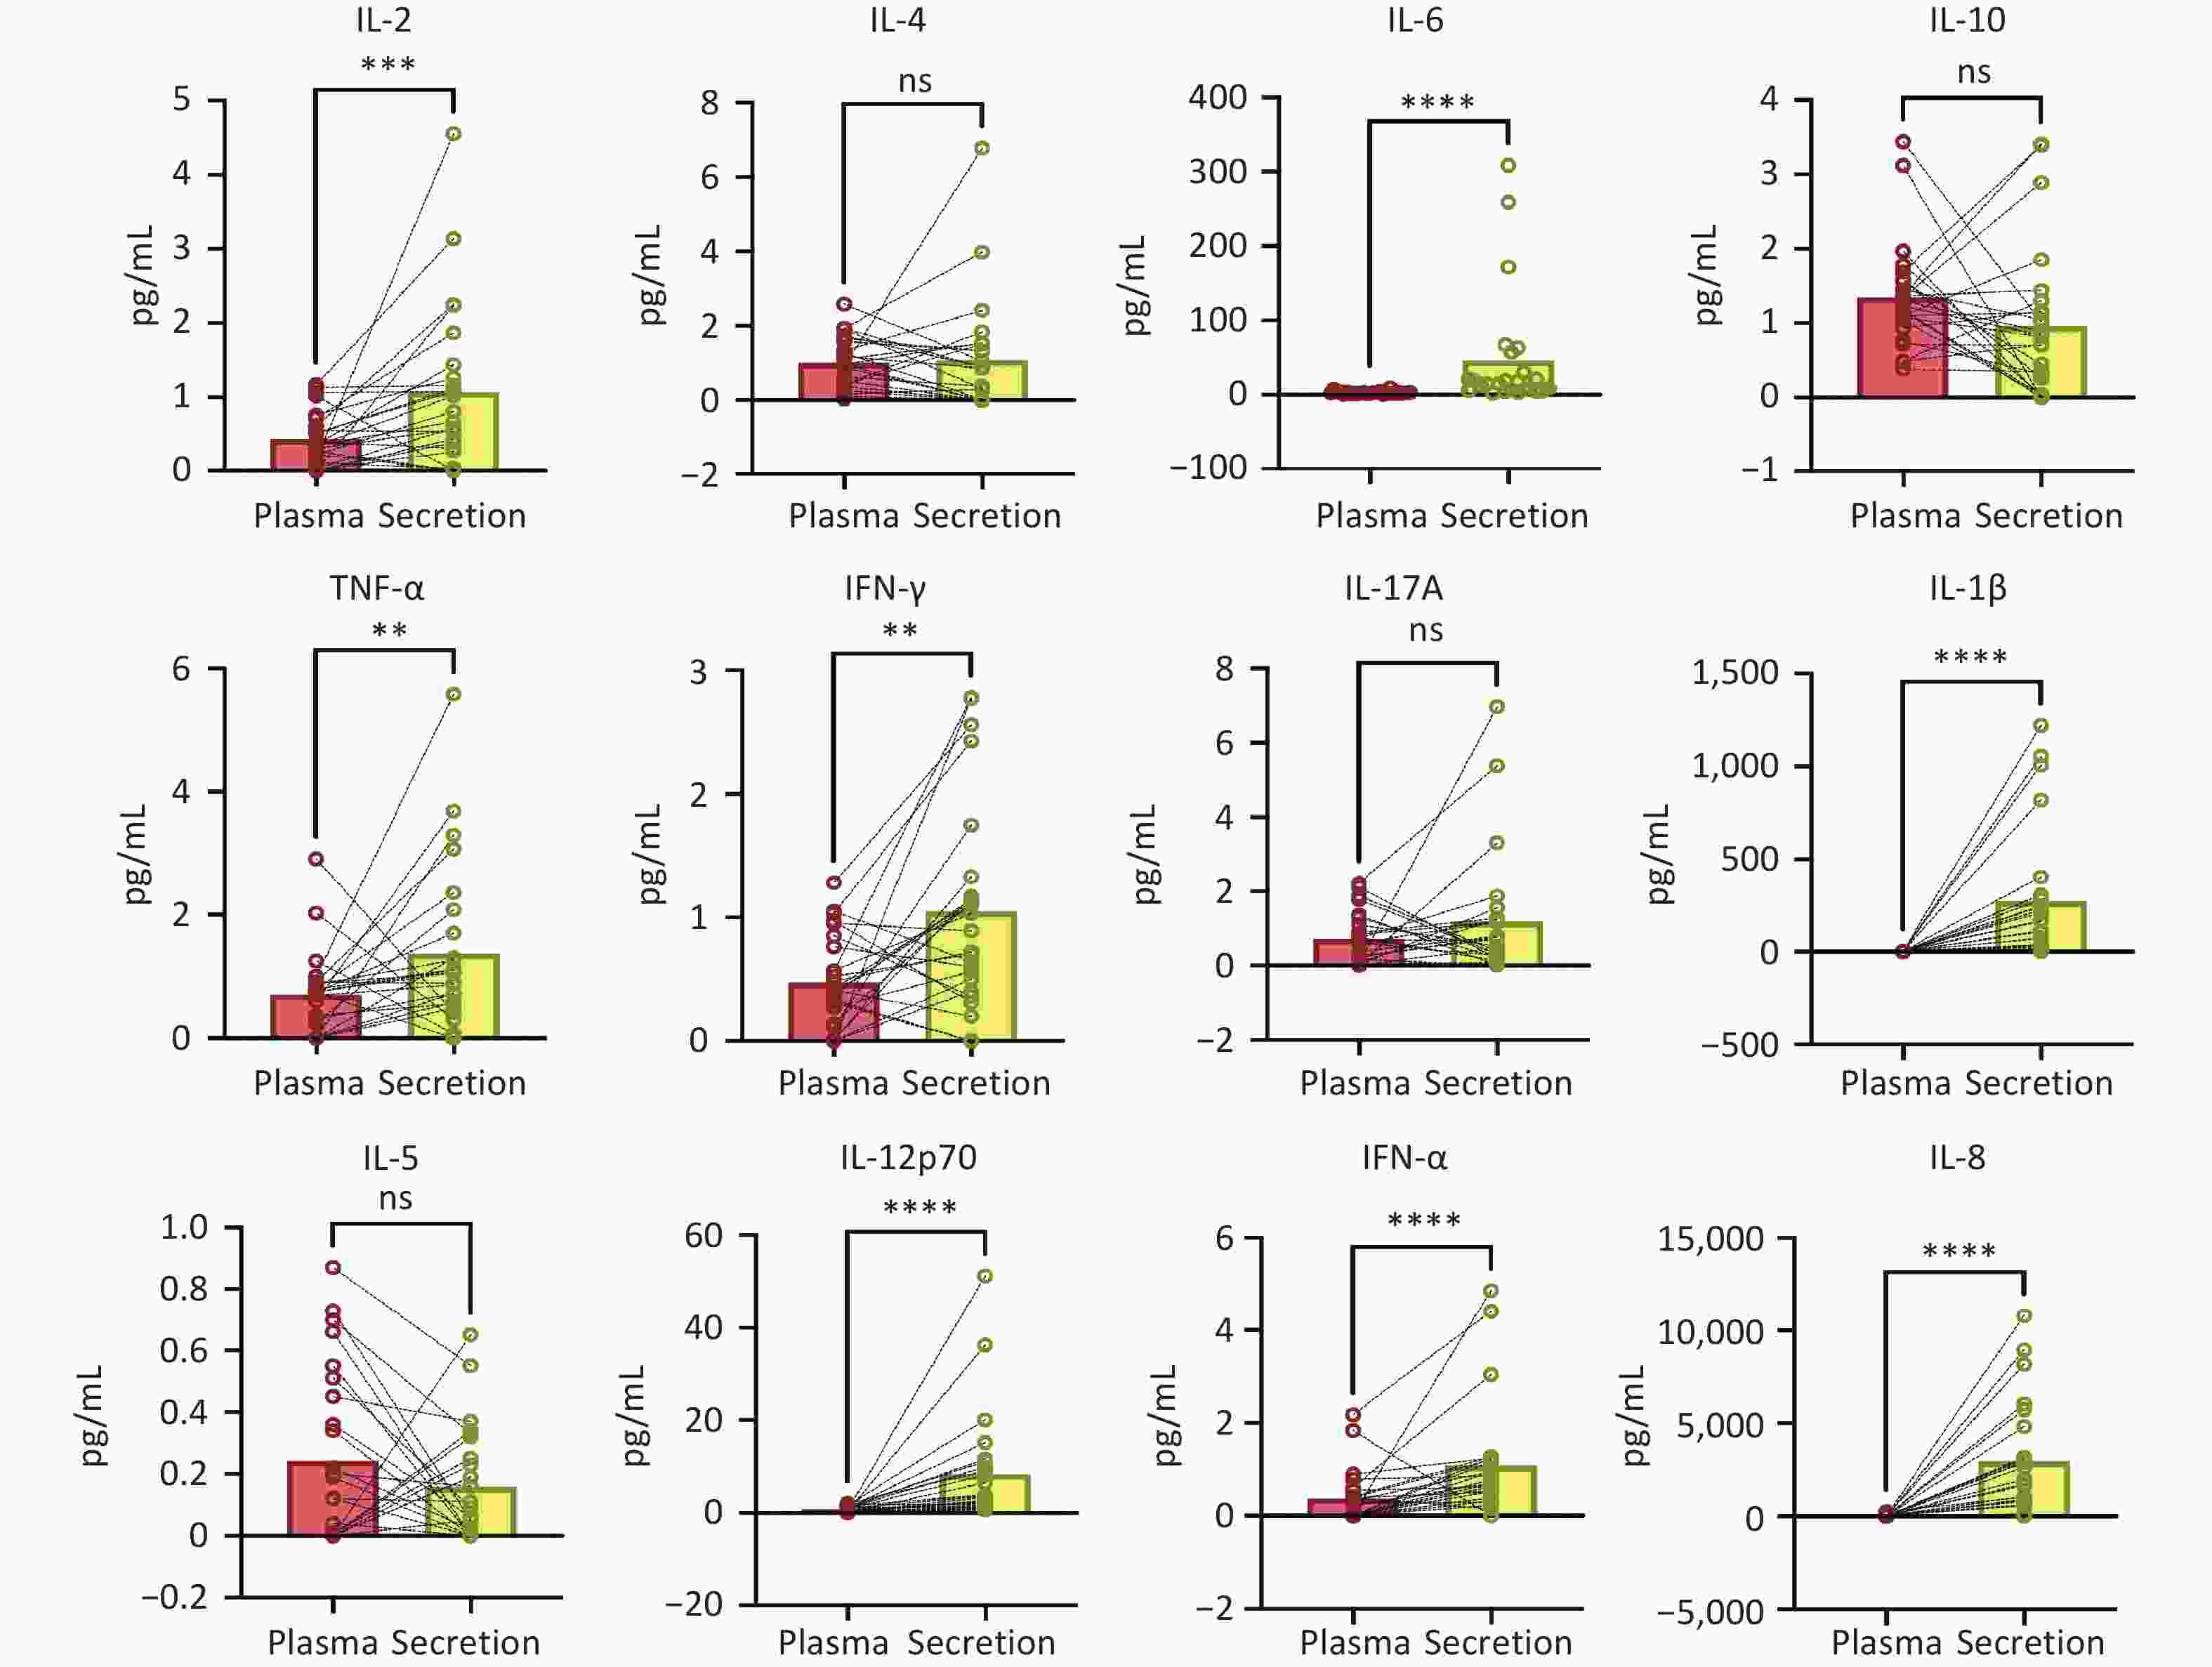
Figure 1. Comparison of results of 12 cytokines in cervical secretion and plasma collected simultaneously (Wilcoxon matched-pairs signed rank test).
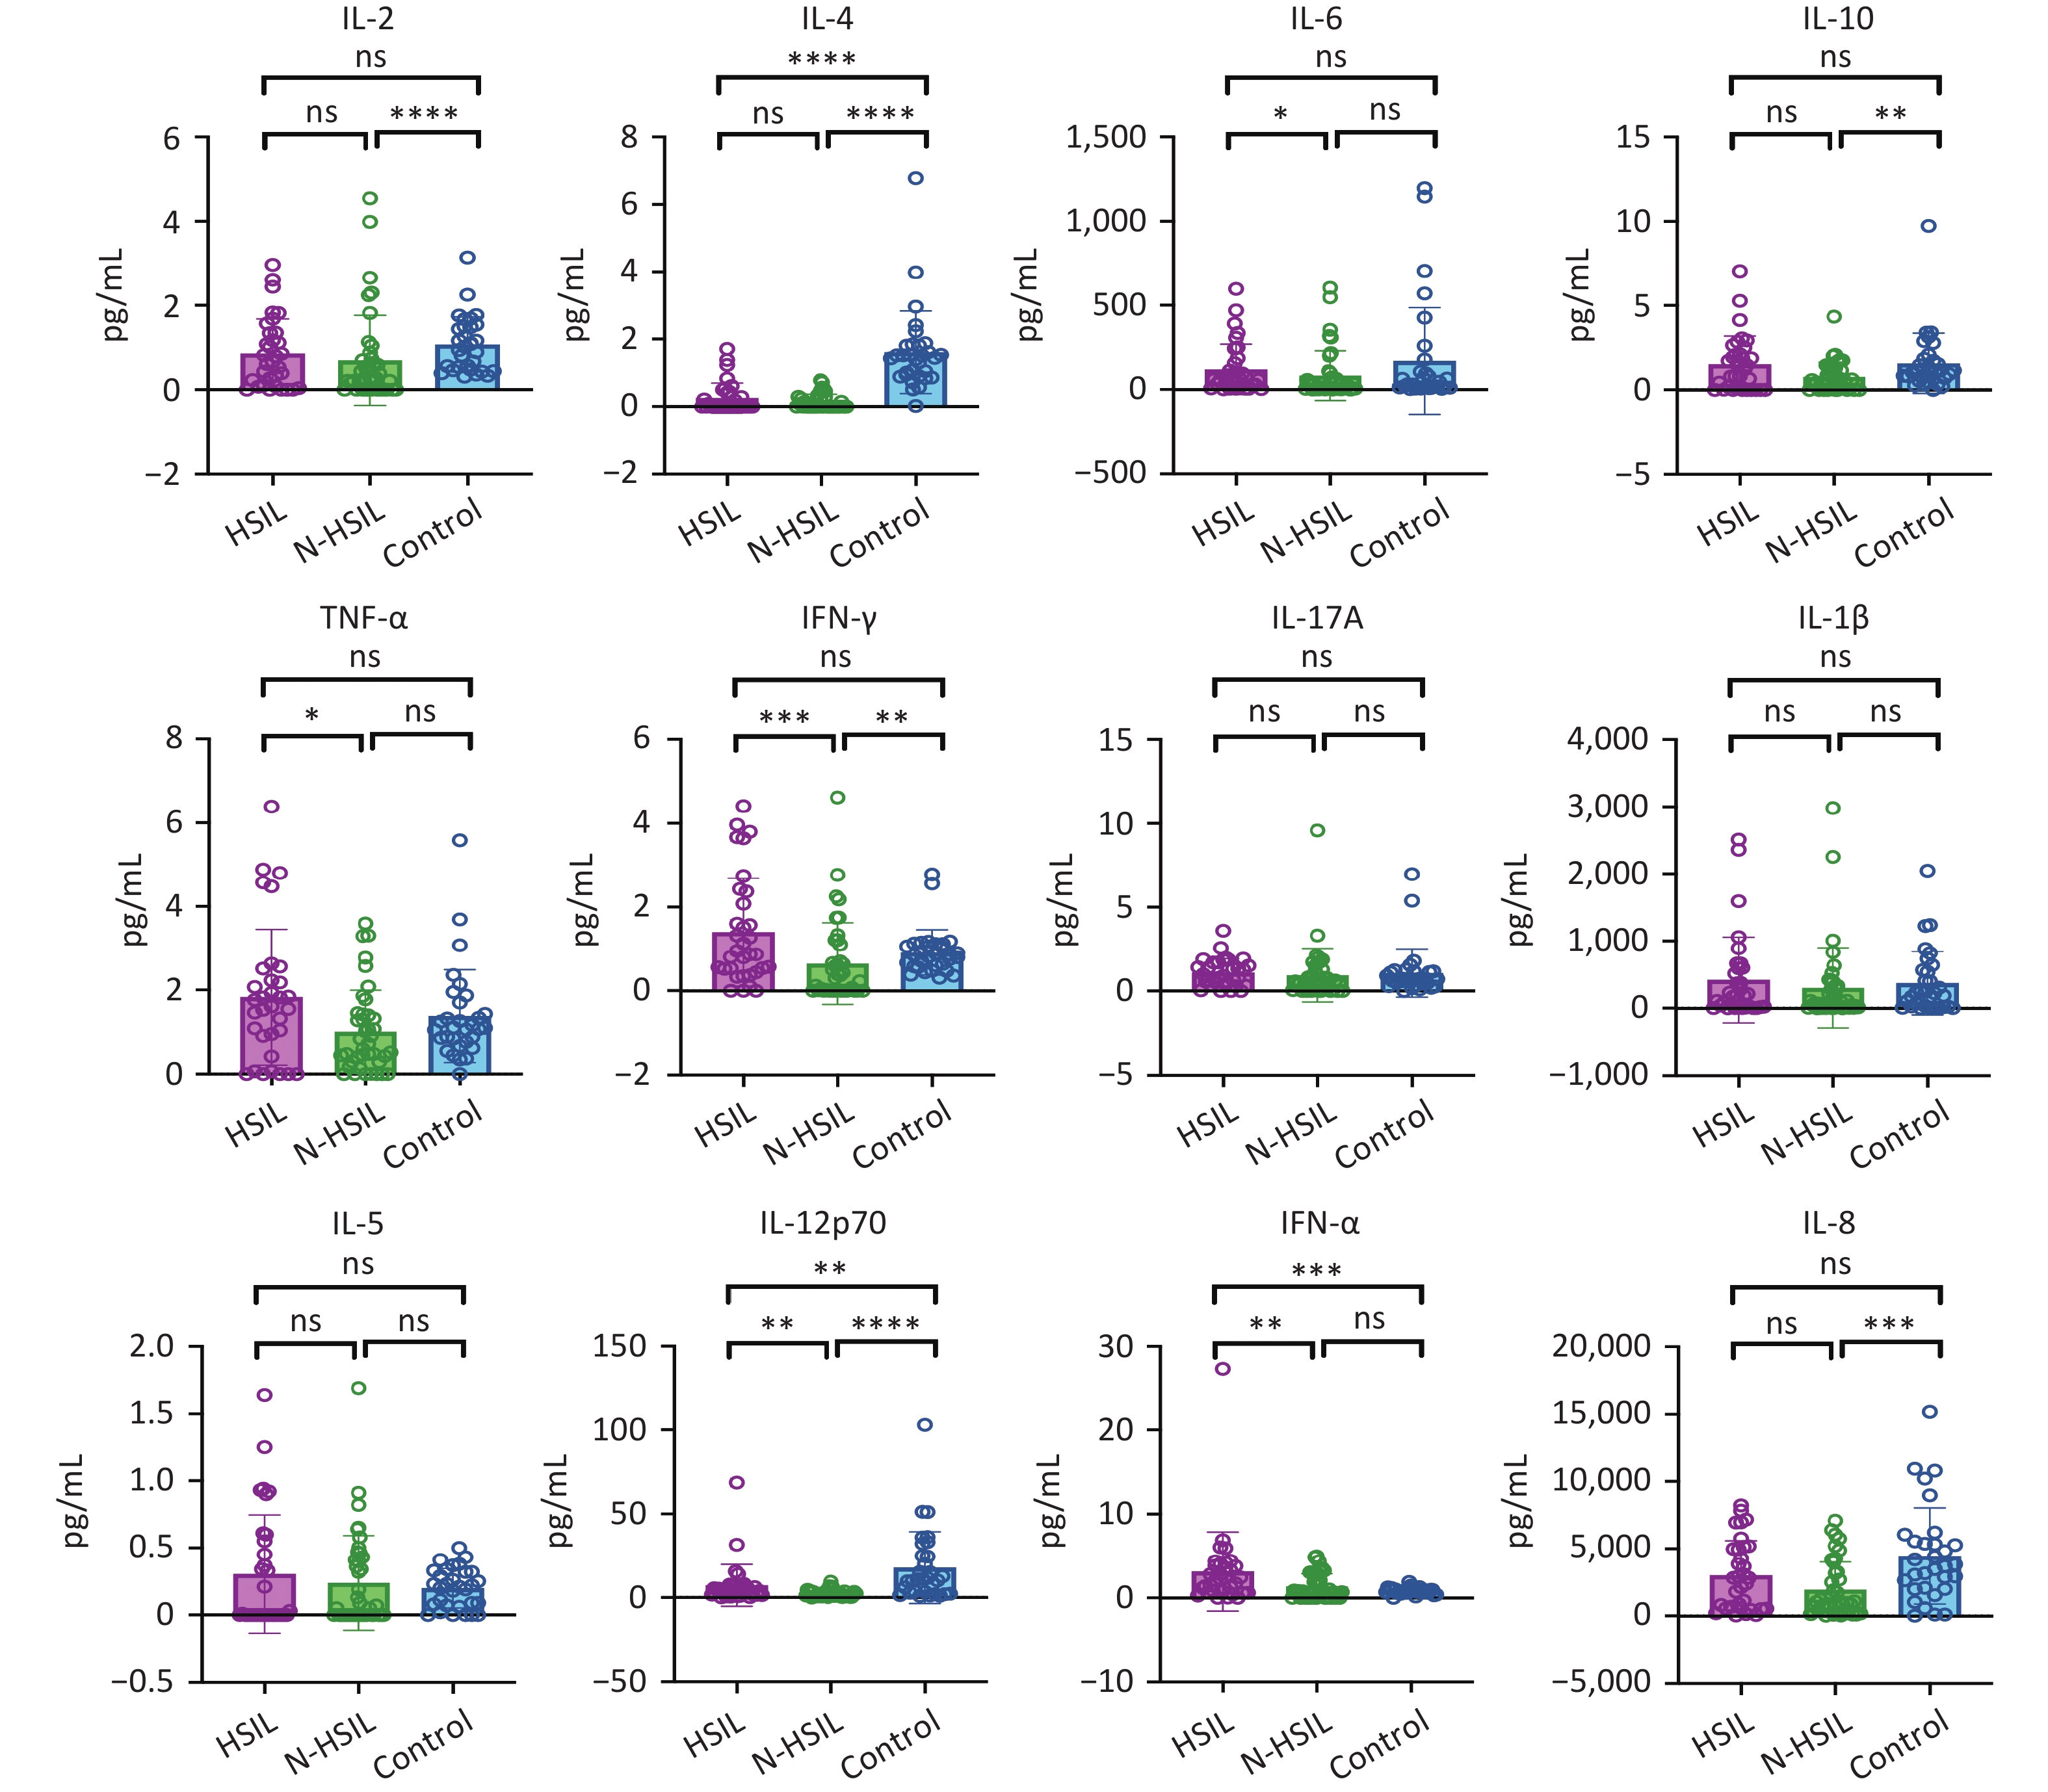
Next, we investigated whether the secreted cytokines could be applied to patients with varying disease severities. Thus, Mann-Whitney tests were used to compare the three groups: patients with cervical HR-HPV infection and HSIL (n = 33), patients with HR-HPV infection and N-HSIL (n = 40), and those without HR-HPV infection (control, n = 31), as shown in Figure 2. There were significant differences in the levels of IL-2, IL-4, IL-10, IFN-γ, IL-12p70, IFN-α, and IL-8 between the control and other two groups. These results indicate significant cytokine profile differences between patients who were negative and positive for HR-HPV, especially with IFN-γ and IFN-α showing lower abundance in patients who were HR-HPV-negative compared to those who were HR-HPV-positive. In addition, there were significant differences in the levels of IL-6, TNF-α, IFN-γ, IL-12p70, and IFN-α between the HSIL and N-HSIL groups. Table 1 shows the differences in statistical data between the two groups.
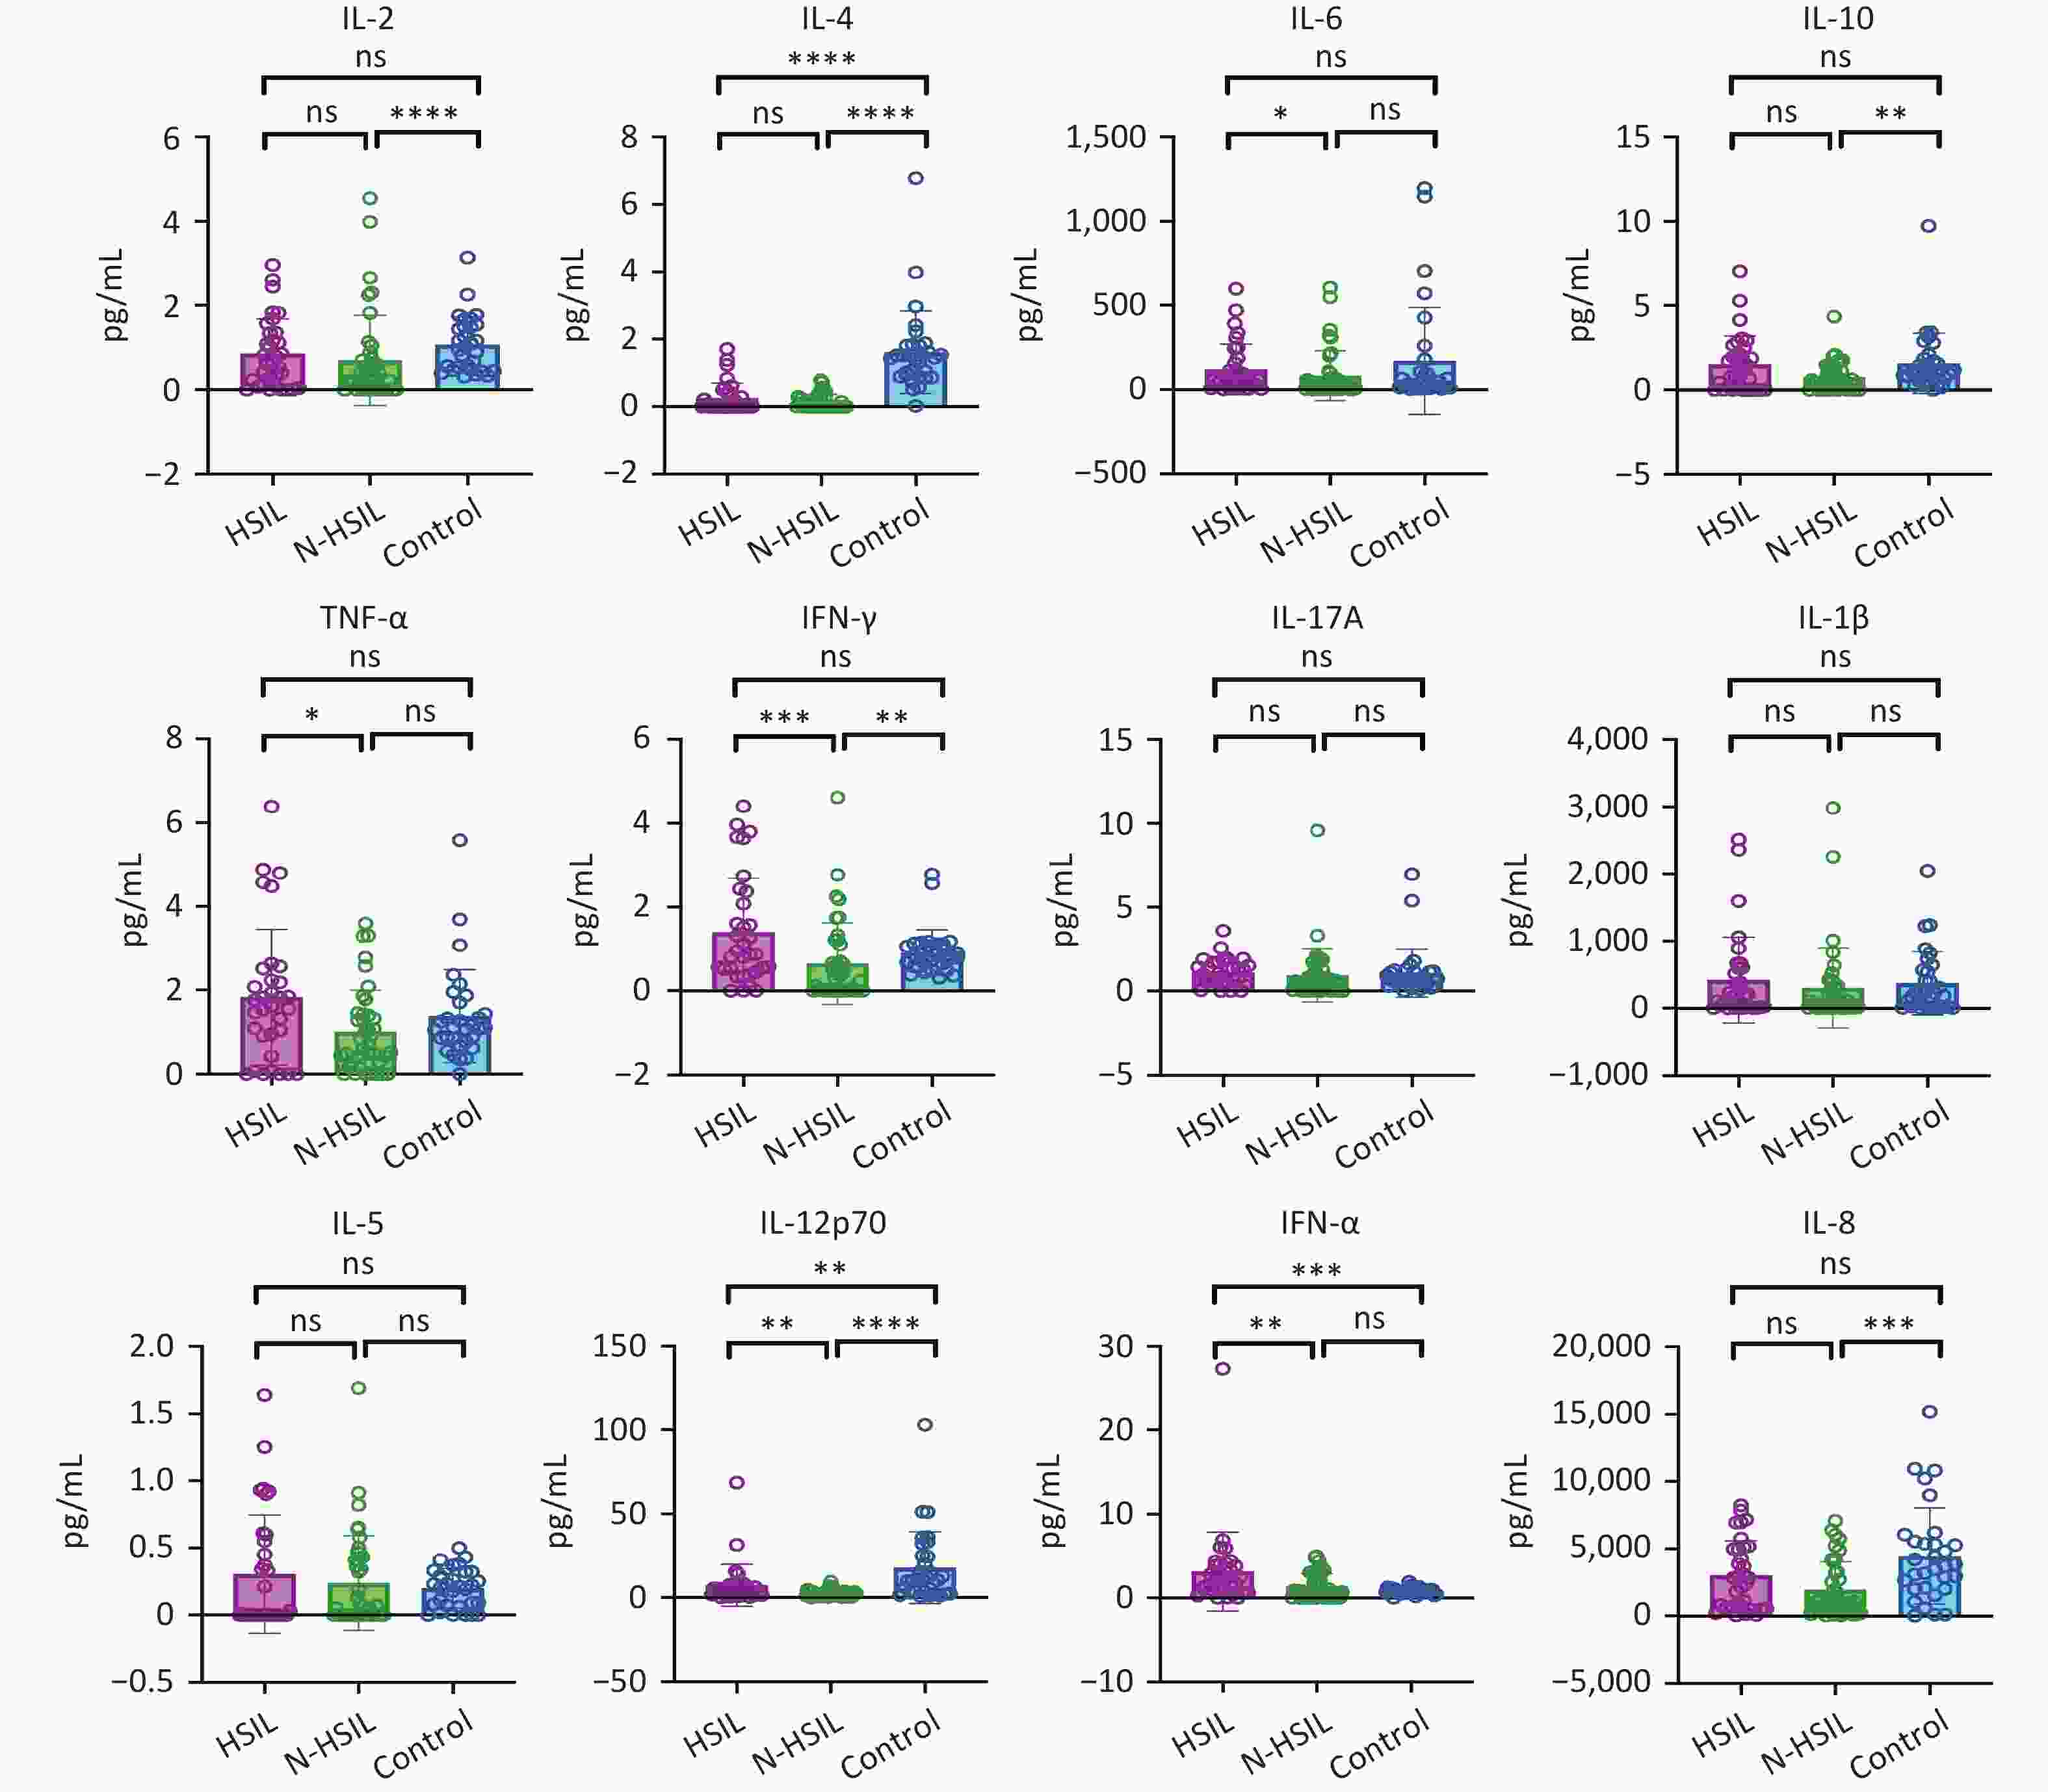
Figure 2. Levels of 12 cytokines in cervical secretions from high- grade squamous intraepithelial lesion (HSIL) and Non-HSIL groups.
Table 1. Differences in statistical data between N-HSIL and HSIL groups
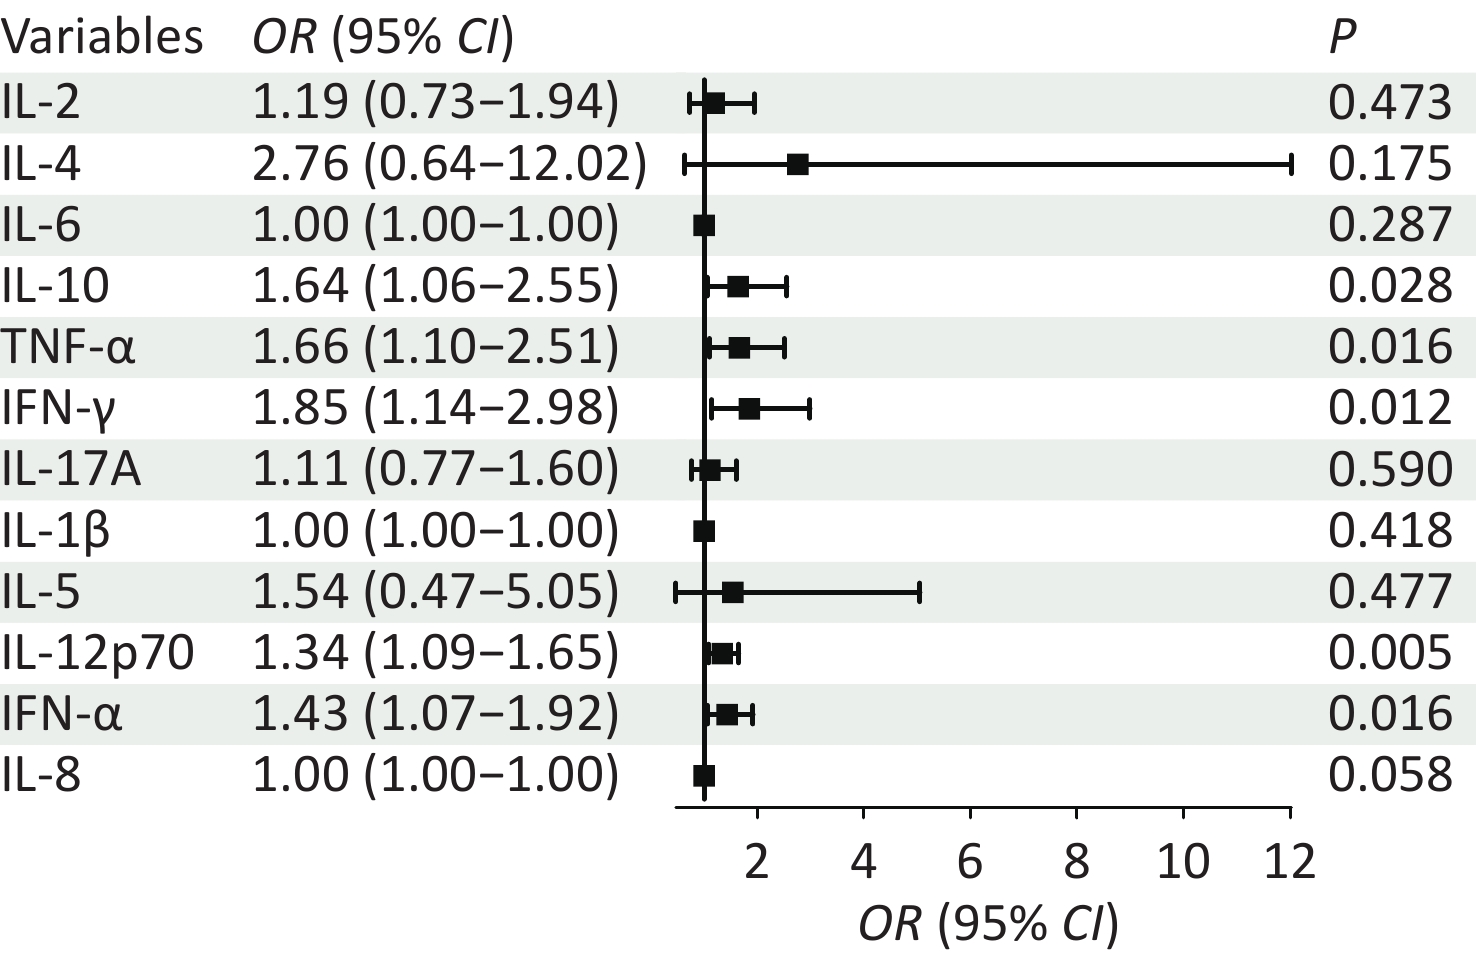
Variables Total (n = 73) N-HSIL (n = 40) HSIL (n = 33) Statistic P IL-2, M (Q1, Q3) 0.43 (0.04, 1.08) 0.27 (0.00, 0.71) 0.67 (0.11, 1.34) Z = −1.70 0.090 IL-4, M (Q1, Q3) 0.00 (0.00, 0.29) 0.00 (0.00, 0.25) 0.00 (0.00, 0.41) Z = −0.51 0.608 IL-6, M (Q1, Q3) 33.32 (6.71, 103.49) 15.67 (3.92, 65.26) 59.71 (15.12, 155.52) Z = −2.29 0.022 IL-10, M (Q1, Q3) 0.70 (0.02, 1.72) 0.55 (0.04, 1.31) 1.22 (0.01, 2.12) Z = −1.75 0.081 TNF-α, M (Q1, Q3) 1.07 (0.41, 1.86) 0.66 (0.30, 1.41) 1.61 (0.91, 2.23) Z = −2.30 0.021 IFN-γ, M (Q1, Q3) 0.56 (0.02, 1.33) 0.27 (0.00, 0.80) 0.87 (0.52, 2.08) Z = −3.13 0.002 IL-17A, M (Q1, Q3) 0.75 (0.28, 1.50) 0.53 (0.06, 1.22) 0.99 (0.52, 1.69) Z = −1.92 0.055 IL-1β, M (Q1, Q3) 107.23 (11.59, 393.35) 70.36 (11.03, 326.55) 187.21 (17.09, 593.98) Z = −0.90 0.366 IL-5, M (Q1, Q3) 0.01 (0.00, 0.45) 0.05 (0.00, 0.42) 0.00 (0.00, 0.55) Z = −0.05 0.963 IL-12p70, M (Q1, Q3) 2.46 (1.02, 5.22) 1.75 (0.82, 3.30) 4.79 (1.80, 7.34) Z = −3.05 0.002 IFN-α, M (Q1, Q3) 1.31 (0.31, 3.04) 0.77 (0.00, 2.77) 2.27 (0.79, 3.85) Z = −2.81 0.005 IL-8, M (Q1, Q3) 1212.81 (547.56, 4182.72) 995.87 (424.29, 3190.16) 2820.31 (590.58, 4976.79) Z = −1.59 0.112 Note. Z: Mann-Whitney test; M: Median, Q1: 1st Quartile, Q3: 3st Quartile Binary logistic regression analysis was performed, with HSIL designated as a positive outcome and N-HSIL as a negative outcome. Twelve cytokine results were used as 12 independent variables in the univariate regression analysis. Five statistically significant variables were screened by univariate regression analysis, which were IL-10, TNF-α, IFN-γ, IL-12p70, and IFN-α, showing that they were associated with the outcome of HSIL (Table 2). The univariate logistic regression forest plots are shown in Figure 3.
Table 2. Univariate logistic regression analysis for HSIL and N-HSIL groups
Variables β S.E Z P OR (95% CI) IL-2 0.18 0.25 0.72 0.473 1.19 (0.73–1.94) IL-4 1.02 0.75 1.36 0.175 2.76 (0.64–12.02) IL-6 0.00 0.00 1.06 0.287 1.00 (1.00–1.00) IL-10 0.50 0.22 2.20 0.028 1.64 (1.06–2.55) TNF-α 0.51 0.21 2.41 0.016 1.66 (1.10–2.51) IFN-γ 0.61 0.24 2.51 0.012 1.85 (1.14–2.98) IL-17A 0.10 0.19 0.54 0.590 1.11 (0.77–1.60) IL-1β 0.00 0.00 0.81 0.418 1.00 (1.00–1.00) IL-5 0.43 0.61 0.71 0.477 1.54 (0.47–5.05) IL-12p70 0.29 0.10 2.80 0.005 1.34 (1.09–1.65) IFN-α 0.36 0.15 2.40 0.016 1.43 (1.07–1.92) IL-8 0.00 0.00 1.90 0.058 1.00 (1.00–1.00) Note. OR: Odds Ratio, CI: Confidence Interval. 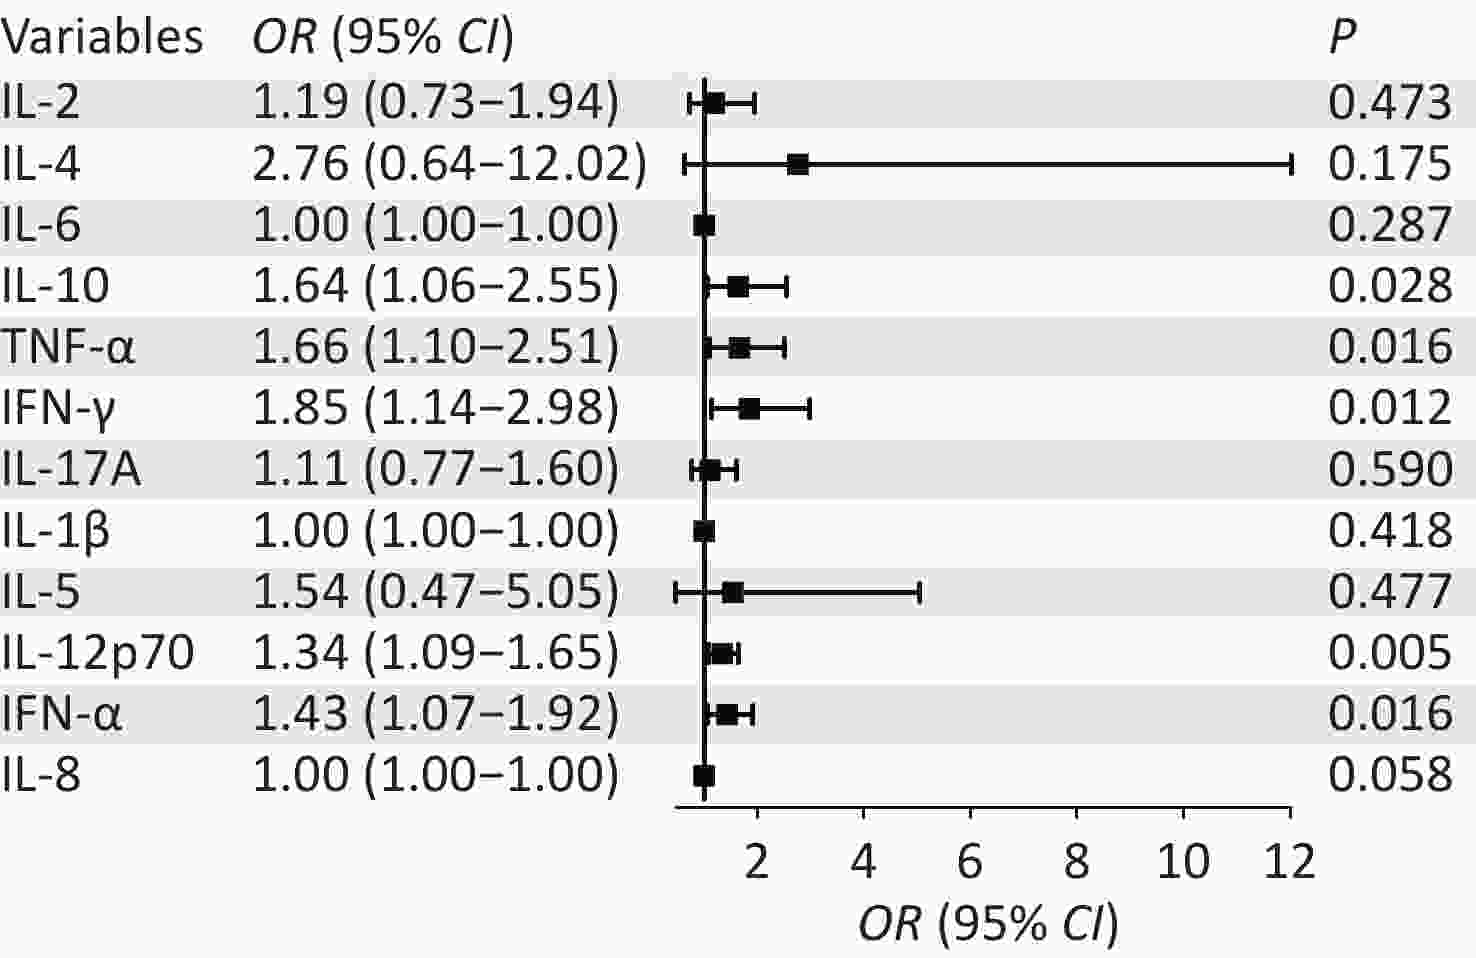
Figure 3. Univariate logistic regression forest plots for high-grade squamous intraepithelial lesion (HSIL) and Non-HSIL groups.
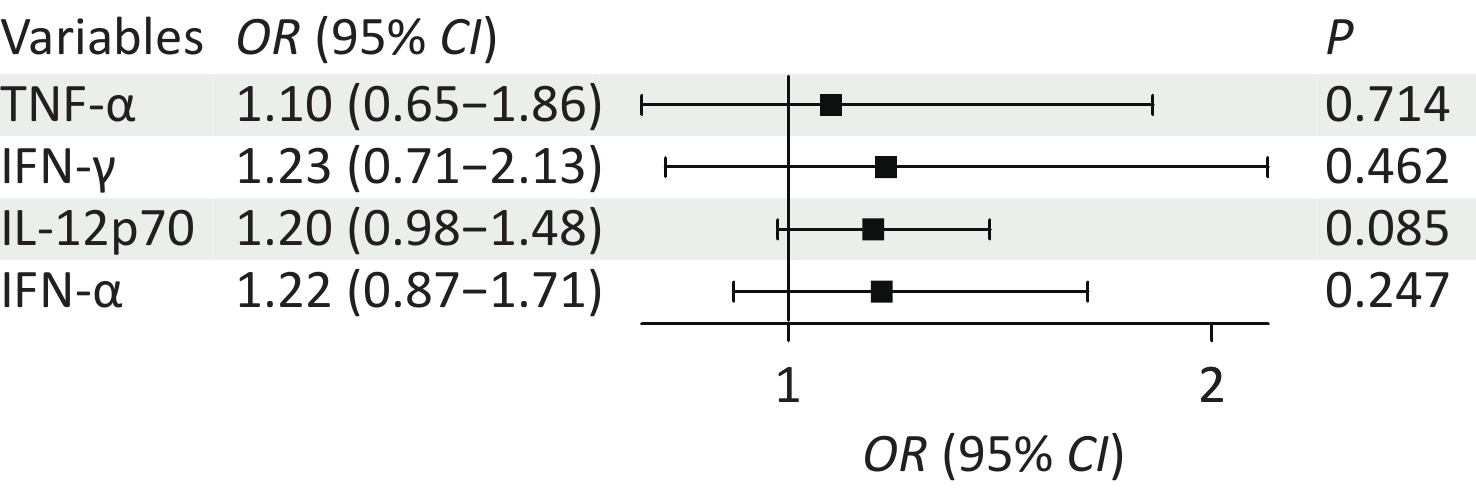
To more effectively screen variables for distinguishing HSIL from N-HSIL and prevent model overfitting caused by excessive factors, we selected four independent variables (TNF-α, IFN-γ, IL-12p70, and IFN-α) commonly identified by both univariate regression analysis and non-parametric tests for multivariate logistic regression analysis (Table 3). The multivariate logistic regression forest plots are shown in Figure 4.
Table 3. Multivariate logistic regression analysis for HSIL and N-HSIL groups
Variables β S.E Z P OR (95% CI) Intercept −1.56 0.48 −3.27 0.001 0.21 (0.08–0.53) TNF-α 0.10 0.27 0.37 0.714 1.10 (0.65–1.86) IFN-γ 0.21 0.28 0.74 0.462 1.23 (0.71–2.13) IL-12p70 0.18 0.11 1.72 0.085 1.20 (0.98–1.48) IFN-α 0.20 0.17 1.16 0.247 1.22 (0.87–1.71) Note. OR: Odds Ratio, CI: Confidence Interval. 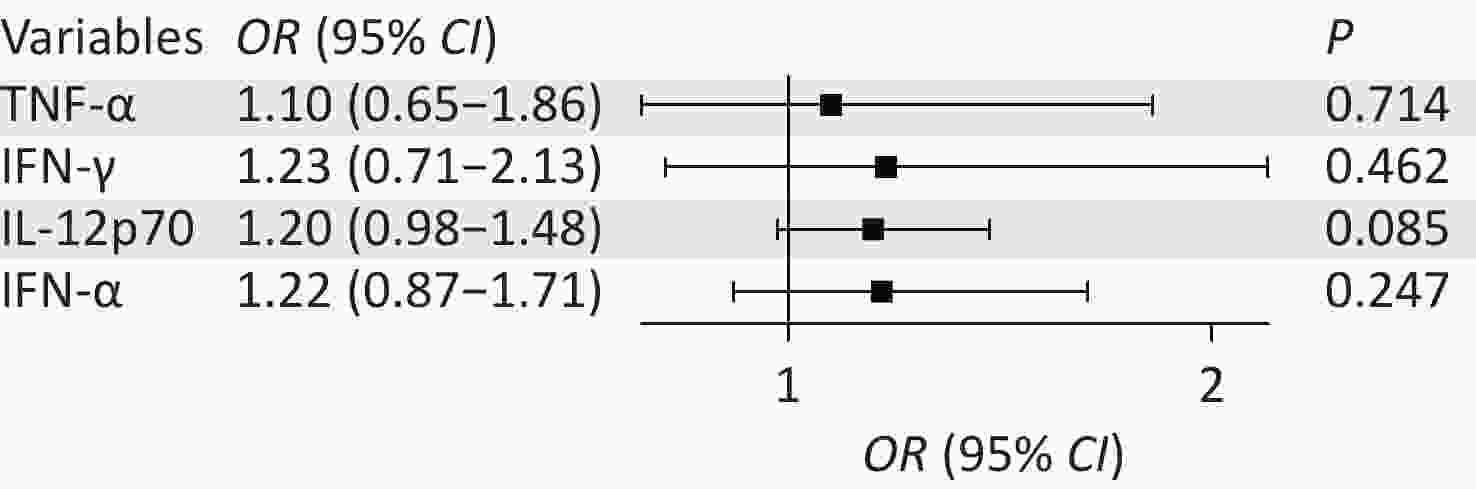
Figure 4. Multivariate logistic regression forest plots for high-grade squamous intraepithelial lesion (HSIL) and Non-HSIL groups.
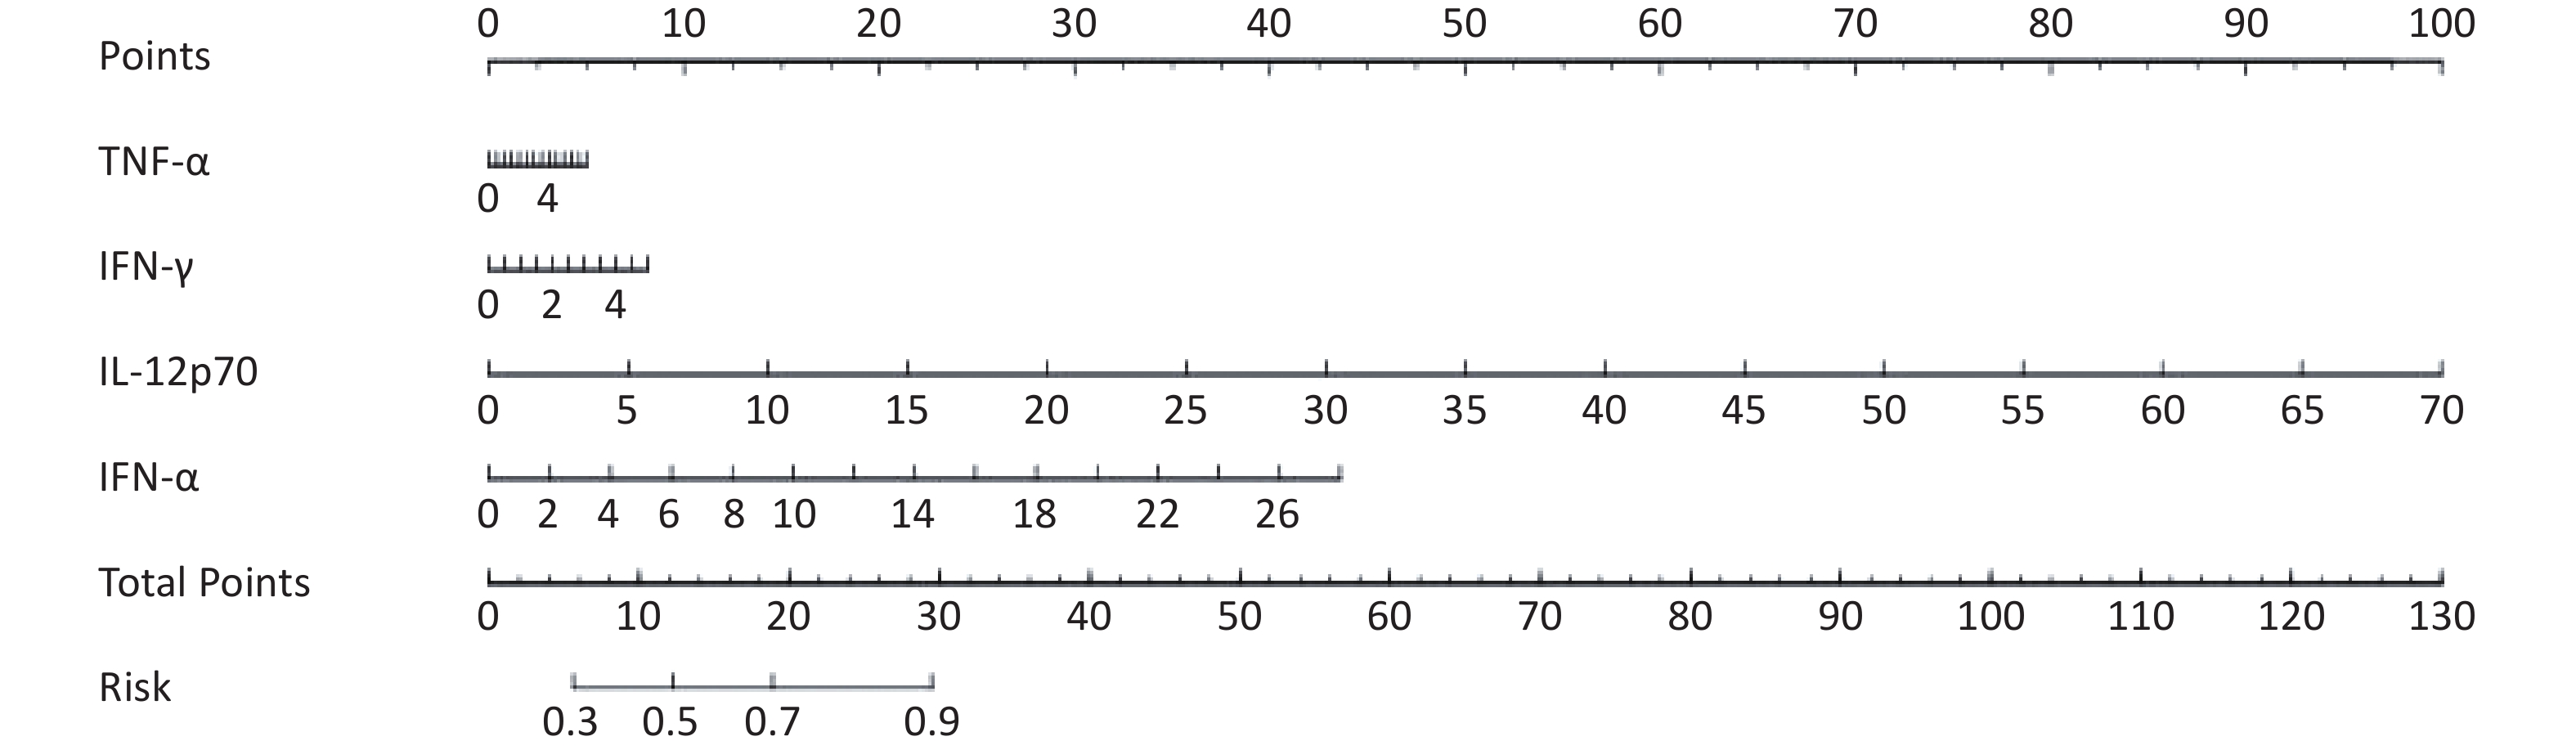
The multivariate regression results were used to establish the diagnostic model of high-grade lesions, that is, the probability of HSIL was PHSIL =1/1+e- (-1.56+0.1* TNF-α+0.21*IFN-γ+0.18* IL-12p70 +0.2* IFN-α). Under the optimal Youden index, the cut-off value of the diagnostic model was 0.401, the area under the curve was 0.76, and the accuracy, sensitivity, and specificity were 0.73, 0.72, and 0.73, respectively. The specific parameters are listed in Table 4. According to the results of the multivariate regression, the influence of the four independent variables on the outcome was analyzed and a nomogram was drawn, as shown in Figure 5.
Table 4. Model parameters under best Youden index
AUC (95% CI) Accuracy (95% CI) Sensitivity (95% CI) Specificity (95% CI) PPV (95% CI) NPV (95% CI) cut off 0.76 (0.65–0.87) 0.73 (0.61–0.82) 0.72 (0.59–0.86) 0.73 (0.58–0.88) 0.76 (0.63–0.90) 0.69 (0.53–0.84) 0.401 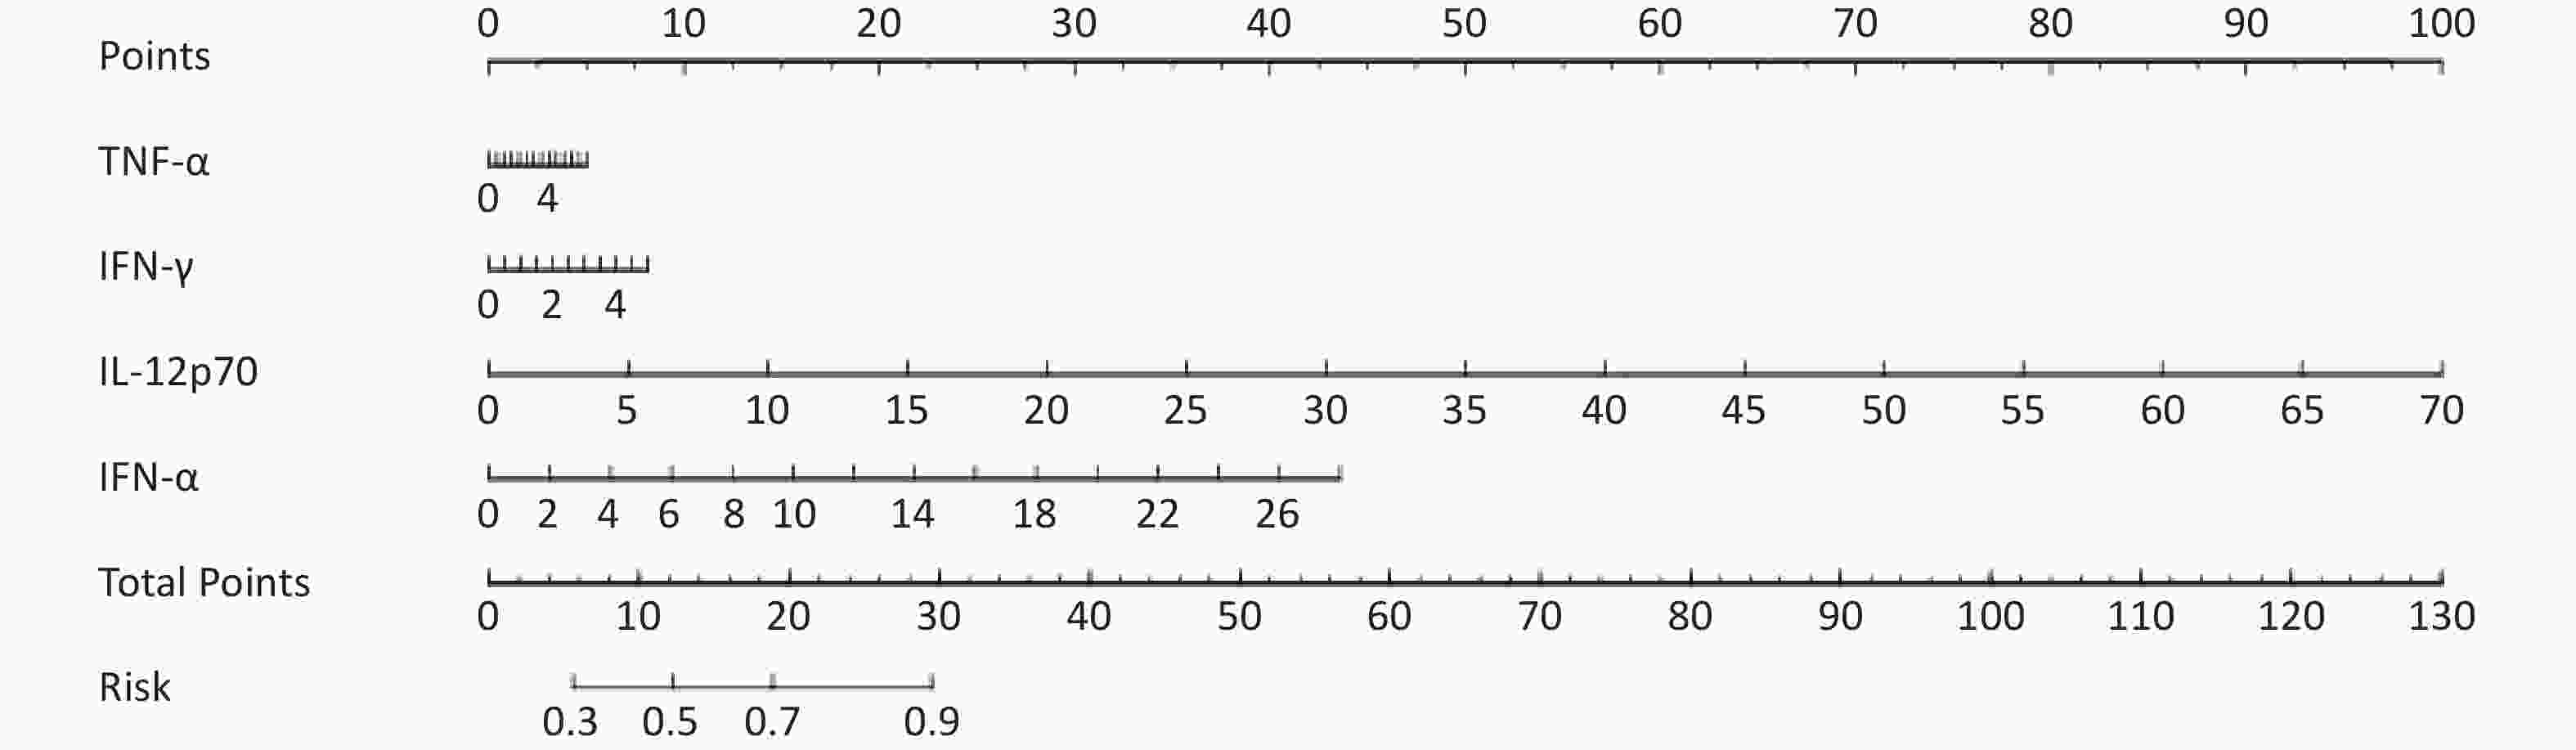
Figure 5. Model Nomogram for predicting high-grade squamous intraepithelial lesion.
-
The immune system plays an important role in cervical HR-HPV infection. During HPV infection, viral particles are phagocytosed by dendritic cells and migrate to local lymphoid tissues, which activate cellular and humoral immunity by expressing inflammatory cytokines such as IL-1α, IL-1β, IL-6, TNF-α, and IL-12 to play a role in HPV clearance[6]. After antigen stimulation, CD4+ T-cell subsets proliferate and differentiate into various effector cells, secrete cytokines, and participate in various stages of the immune response. Notably, increased secretion of the anti-inflammatory cytokine IL-10 in Th2 cellular immune responses has been associated with impaired innate and adaptive immune defenses and progression of cervical lesions[10-12]. In addition, Th2 cells produce cytokines, such as IL-4, IL-6, IL-8, and IL-10, which help B-cells differentiate into plasma cells that produce HPV-specific antibodies that enter into circulation[6]. Th1 cells secrete cytokines such as IL-2, IL-12, and IFN-γ to activate naive CD8+ T lymphocytes to differentiate into cytotoxic T lymphocytes and to become effector T-cells that can kill cervical intraepithelial neoplasia or HPV-infected cells to exert an antiviral immune response[13]. This is the first study to explore the differences in cytokine levels between two patient sample types. The results showed that many cytokines were easier to detect and analyze in cervical secretions; IL-2, IL-6, TNF-α, IFN-γ, IL-1β, IL-12p70, IFN-α, and IL-8 were dominant in the secretion, reflecting that the systemic immune status could not reflect the local immune status. In addition, local humoral and cellular immunity were higher than systemic immunity. Finally, there were no apparent differences in IL-5 and IL-17A levels between the two specimen types.
Many studies[5,11,14] showed that high levels of IL-1β and TNF-α related to the occurrence and development of cervical lesions. Both normal cervical and lesion cells can produce IL-1β and TNF-α[15], and they in turn stimulate lesion cell proliferation and even cancelation. There were significant differences in the levels of IL-2, IL-4, IL-10, IFN-γ, IL-12p70, IFN-α, and IL-8 between patients who were HR-HPV-positive and those were HR-HPV-negative, especially with IFN-γ and IFN-α showing lower abundance in patients who were HR-HPV-negative compared to those who were HR-HPV-positive. Consistent with the results of the comparison of local and systemic immunity, there was no apparent difference in IL-5 and IL-17A levels between patients who were HR-HPV-negative and those who were HR-HPV-positive. IL-5 and IL-17A likely play modest roles in local immunity against HR-HPV infection. The Mann-Whitney test was used to compare the levels of IL-6, TNF-α, IFN-γ, IL-12p70, and IFN-α in cervical secretions in the HSIL and N-HSIL groups. The levels of TNF-α, IFN-γ, IL-12p70, and IFN-α in the local microenvironment of HSIL infected with HR-HPV were higher than those in the N-HSIL group. This suggests that the activation of humoral and antiviral immunity in this group of patients was stronger than in the N-HSIL group. According to the univariate logistic regression forest plots of HSIL and N-HSIL, five statistically significant variables were screened by univariate regression analysis, which were IL-10, TNF-α, IFN-γ, IL-12p70, and IFN-α, showing that they were the risk factors for HSIL. To more effectively screen variables for distinguishing HSIL from N-HSILs and prevent model overfitting caused by excessive factors, we only selected four independent variables for multivariate logistic regression analysis; IL-6 and IL-10 were excluded because they were not stable, which also satisfied the sample size requirement for logistic regression analysis[16]. ROC curve analysis showed that the combined detection of TNF-α, IFN-γ, IL-12p70, and IFN-α had an area under the curve of 0.76, which had good sensitivity and specificity. It had a predictive value for high-grade lesions after HR-HPV infection and is expected to be an important indicator for predicting cervical HR-HPV infection. In summary, this cytokine profile has the potential for routine clinical screening. However, owing to the high cost of measuring all 12 cytokines, this approach may not be cost-effective for patients who are HR-HPV-negative. In patients who are HR-HPV-positive, secreted cytokines can serve as non-invasive biomarkers to predict HSIL. Compared to invasive biopsy, our method uses only four cytokines, offering lower costs, operational simplicity, and patient-friendly features; it is non-invasive, causes no harm, and is easily accepted. Additionally, the four selected factors (notably IFN-γ and IFN-α) showed a unidirectional increase from the control group to the HSIL group across the three groups, distinguishing them from general gynecological inflammation. As in the HR-HPV-negative control group, inflammation typically manifests as elevated levels of IL-4, IL-10, and IL-8 but not for IFN-γ and IFN-α.
Our study has several limitations. We used cotton swabs to collect secretions, which are simpler to perform than vaginal lavage; however, this may result in errors. However, our operation is completely performed by the same doctor, which reduces the greater difference caused by personnel turnover to a certain extent. Therefore, we used an immunofluorescence assay to detect 12 cytokines, which have higher sensitivity and accuracy. The results may be biased due to the small sample size of this study. To minimize bias, we assigned dedicated sampling and testing personnel who were blinded to the specific information of the specimens. Additionally, this was an exploratory study. Independent variables were screened before multivariate regression analysis. The odds ratios and confidence intervals of the results were relatively normal. The goodness-of-fit results indicate that the model was successful. Although the results have certain instabilities, the index characteristics are similar to those of peer studies, suggesting that they are reasonably reliable. However, additional samples will be required to confirm our results.
doi: 10.3967/bes2025.117
Application of Cytokines in Cervical Secretion for High-grade Squamous Intraepithelial Lesion Caused by High-risk Human Papillomavirus Infection
-
Abstract:Conceptualization : Xiaowen Pu, Jing Wu, Yang Zhou, Ji Yang , and Wenhong Zhang ; Investigation: Xiao Wang , Lingyun Ji, Ruixian Jiao, Bowen Xu, Jiaqi Han; Resources: Xiaowen Pu, Jing Wu, Yang Zhou, Ji Yang , and Wenhong Zhang; Supervision: Xiaowen Pu, Jing Wu, Yang Zhou, Ji Yang , and Wenhong Zhang; Data Curation:Xiao Wang, Lingyun Ji, Ruixian Jiao; Formal Analysis: Xiao Wang , Lingyun Ji, Ruixian Jiao, Bowen Xu, Jiaqi Han; Methodology: Xiao Wang , Lingyun Ji, Ruixian Jiao, Bowen Xu, Jiaqi Han; Writing - Original Draft: Xiao Wang , Lingyun Ji, Ruixian Jiao; Funding Acquisition: Jing Wu, Yang Zhou; Writing - Review and Editing: Xiaowen Pu, Jing Wu, Yang Zhou, Ji Yang , and Wenhong Zhang.
Objective The aim of this study was to analyze the correlation between the levels of 12 cytokines in the cervical microenvironment and cervical intraepithelial neoplasia in patients with high-risk human papillomavirus (HR-HPV) infection. Methods Female patients (n = 73) with HR-HPV infection were enrolled and divided into a high-grade squamous intraepithelial lesion (HSIL) group (n = 33) and a non-HSIL (N-HSIL) group (n = 40), which include low-grade squamous intraepithelial lesions and inflammation. Healthy screening subjects (n = 31) with negative HR-HPV results were enrolled as a control group. We examined contemporaneous plasma and secretory cytokines from 25 study subjects to investigate the difference between systemic cytokine profiles and the local microenvironment immunity using the Wilcoxon matched-pairs signed rank test. The 12 cytokines from cervical secretions were compared between the three groups using the Mann-Whitney test, and logistic regression was used to analyze HSIL and N-HSIL. Results There were statistical differences in eight cytokines (IL-2, IL-6, TNF-α, IFN-γ, IL-1β, IL-12p70, IFN-α, and IL-8) between cervical secretion and plasma of the same patient, and seven cytokines were statistically different between the control and other two groups. We selected four independent variables (TNF-α, IFN-γ, IL-12p70, and IFN-α) commonly identified by univariate regression analysis and non-parametric tests for multivariate logistic regression analysis. Based on this model, HSIL could be predicted in patients with HR-HPV infection, with the area under the curve being 0.76. Conclusion The systemic cytokine profile cannot reflect the local microenvironment immunity, and the occurrence of HSIL is related to the cytokine levels in the cervical microenvironment.
We declare that we have no conflicts of interest.
The study adhered to the tenets of the Declaration of Helsinki and was approved by the ethics committee of Shanghai first maternity and infant hospital(No. KS 23359) and Shanghai East Hospital (2024 Research review No. 031) , Informed consent was obtained, the authors are attesting that the participants were aware of the study’s purpose, risks, and benefits.
&These authors contributed equally to this work.
注释:1) Authors’ Contributions: 2) Competing Interests: 3) Ethics: -
Figure 1. Comparison of results of 12 cytokines in cervical secretion and plasma collected simultaneously (Wilcoxon matched-pairs signed rank test).
Figure 2. Levels of 12 cytokines in cervical secretions from high- grade squamous intraepithelial lesion (HSIL) and Non-HSIL groups.
Figure 3. Univariate logistic regression forest plots for high-grade squamous intraepithelial lesion (HSIL) and Non-HSIL groups.
Figure 4. Multivariate logistic regression forest plots for high-grade squamous intraepithelial lesion (HSIL) and Non-HSIL groups.
Table 1. Differences in statistical data between N-HSIL and HSIL groups
Variables Total (n = 73) N-HSIL (n = 40) HSIL (n = 33) Statistic P IL-2, M (Q1, Q3) 0.43 (0.04, 1.08) 0.27 (0.00, 0.71) 0.67 (0.11, 1.34) Z = −1.70 0.090 IL-4, M (Q1, Q3) 0.00 (0.00, 0.29) 0.00 (0.00, 0.25) 0.00 (0.00, 0.41) Z = −0.51 0.608 IL-6, M (Q1, Q3) 33.32 (6.71, 103.49) 15.67 (3.92, 65.26) 59.71 (15.12, 155.52) Z = −2.29 0.022 IL-10, M (Q1, Q3) 0.70 (0.02, 1.72) 0.55 (0.04, 1.31) 1.22 (0.01, 2.12) Z = −1.75 0.081 TNF-α, M (Q1, Q3) 1.07 (0.41, 1.86) 0.66 (0.30, 1.41) 1.61 (0.91, 2.23) Z = −2.30 0.021 IFN-γ, M (Q1, Q3) 0.56 (0.02, 1.33) 0.27 (0.00, 0.80) 0.87 (0.52, 2.08) Z = −3.13 0.002 IL-17A, M (Q1, Q3) 0.75 (0.28, 1.50) 0.53 (0.06, 1.22) 0.99 (0.52, 1.69) Z = −1.92 0.055 IL-1β, M (Q1, Q3) 107.23 (11.59, 393.35) 70.36 (11.03, 326.55) 187.21 (17.09, 593.98) Z = −0.90 0.366 IL-5, M (Q1, Q3) 0.01 (0.00, 0.45) 0.05 (0.00, 0.42) 0.00 (0.00, 0.55) Z = −0.05 0.963 IL-12p70, M (Q1, Q3) 2.46 (1.02, 5.22) 1.75 (0.82, 3.30) 4.79 (1.80, 7.34) Z = −3.05 0.002 IFN-α, M (Q1, Q3) 1.31 (0.31, 3.04) 0.77 (0.00, 2.77) 2.27 (0.79, 3.85) Z = −2.81 0.005 IL-8, M (Q1, Q3) 1212.81 (547.56, 4182.72) 995.87 (424.29, 3190.16) 2820.31 (590.58, 4976.79) Z = −1.59 0.112 Note. Z: Mann-Whitney test; M: Median, Q1: 1st Quartile, Q3: 3st Quartile  下载: 导出CSV
Table 2. Univariate logistic regression analysis for HSIL and N-HSIL groups
Variables β S.E Z P OR (95% CI) IL-2 0.18 0.25 0.72 0.473 1.19 (0.73–1.94) IL-4 1.02 0.75 1.36 0.175 2.76 (0.64–12.02) IL-6 0.00 0.00 1.06 0.287 1.00 (1.00–1.00) IL-10 0.50 0.22 2.20 0.028 1.64 (1.06–2.55) TNF-α 0.51 0.21 2.41 0.016 1.66 (1.10–2.51) IFN-γ 0.61 0.24 2.51 0.012 1.85 (1.14–2.98) IL-17A 0.10 0.19 0.54 0.590 1.11 (0.77–1.60) IL-1β 0.00 0.00 0.81 0.418 1.00 (1.00–1.00) IL-5 0.43 0.61 0.71 0.477 1.54 (0.47–5.05) IL-12p70 0.29 0.10 2.80 0.005 1.34 (1.09–1.65) IFN-α 0.36 0.15 2.40 0.016 1.43 (1.07–1.92) IL-8 0.00 0.00 1.90 0.058 1.00 (1.00–1.00) Note. OR: Odds Ratio, CI: Confidence Interval.
下载: 导出CSV
Table 3. Multivariate logistic regression analysis for HSIL and N-HSIL groups
Variables β S.E Z P OR (95% CI) Intercept −1.56 0.48 −3.27 0.001 0.21 (0.08–0.53) TNF-α 0.10 0.27 0.37 0.714 1.10 (0.65–1.86) IFN-γ 0.21 0.28 0.74 0.462 1.23 (0.71–2.13) IL-12p70 0.18 0.11 1.72 0.085 1.20 (0.98–1.48) IFN-α 0.20 0.17 1.16 0.247 1.22 (0.87–1.71) Note. OR: Odds Ratio, CI: Confidence Interval.
下载: 导出CSV
Table 4. Model parameters under best Youden index
AUC (95% CI) Accuracy (95% CI) Sensitivity (95% CI) Specificity (95% CI) PPV (95% CI) NPV (95% CI) cut off 0.76 (0.65–0.87) 0.73 (0.61–0.82) 0.72 (0.59–0.86) 0.73 (0.58–0.88) 0.76 (0.63–0.90) 0.69 (0.53–0.84) 0.401
下载: 导出CSV
-
[1] Graham SV. The human papillomavirus replication cycle, and its links to cancer progression: a comprehensive review. Clin Sci, 2017; 131, 2201−21. doi: 10.1042/CS20160786 [2] Yang X, Cheng YX, Li CS. The role of TLRs in cervical cancer with HPV infection: a review. Signal Transduct Target Ther, 2017; 2, 17055. doi: 10.1038/sigtrans.2017.55 [3] Espinoza H, Ha KT, Pham TT, et al. Genetic predisposition to persistent human papillomavirus-infection and virus-induced cancers. Microorganisms, 2021; 9, 2092. doi: 10.3390/microorganisms9102092 [4] Torres-Poveda K, Bahena-Román M, Delgado-Romero K, et al. A prospective cohort study to evaluate immunosuppressive cytokines as predictors of viral persistence and progression to pre-malignant lesion in the cervix in women infected with HR-HPV: study protocol. BMC Infect Dis, 2018; 18, 582. doi: 10.1186/s12879-018-3490-1 [5] Long DL, Song HL, Qu PP. Cytokines profiles in cervical mucosa in patients with cervical high-risk human papillomavirus infection. J Infect Dev Ctries, 2021; 15, 719−25. doi: 10.3855/jidc.12147 [6] Ntuli L, Mtshali A, Mzobe G, et al. Role of immunity and vaginal microbiome in clearance and persistence of human papillomavirus infection. Front Cell Infect Microbiol, 2022; 12, 927131. doi: 10.3389/fcimb.2022.927131 [7] Torres-Poveda K, Burguete-García AI, Bahena-Román M, et al. Risk allelic load in Th2 and Th3 cytokines genes as biomarker of susceptibility to HPV-16 positive cervical cancer: a case control study. BMC Cancer, 2016; 16, 330. doi: 10.1186/s12885-016-2364-4 [8] Li BH, Zhang L, Zhao JG, et al. The value of cytokine levels in triage and risk prediction for women with persistent high-risk human papilloma virus infection of the cervix. Infect Agents Cancer, 2019; 14, 16. doi: 10.1186/s13027-019-0231-z [9] Zheng JJ, Miao JR, Wu Q, et al. Correlation between HPV-negative cervical lesions and cervical microenvironment. Taiwan J Obstet Gynecol, 2020; 59, 855−61. doi: 10.1016/j.tjog.2020.08.002 [10] Peghini BC, Abdalla DR, Barcelos ACM, et al. Local cytokine profiles of patients with cervical intraepithelial and invasive neoplasia. Hum Immunol, 2012; 73, 920−6. doi: 10.1016/j.humimm.2012.06.003 [11] Scott ME, Shvetsov YB, Thompson PJ, et al. Cervical cytokines and clearance of incident human papillomavirus infection: Hawaii HPV cohort study. Int J Cancer, 2013; 133, 1187−96. doi: 10.1002/ijc.28119 [12] Lin W, Niu ZY, Zhang HL, et al. Imbalance of Th1/Th2 and Th17/Treg during the development of uterine cervical cancer. Int J Clin Exp Pathol, 2019; 12, 3604−12. [13] Sasagawa T, Takagi H, Makinoda S. Immune responses against human papillomavirus (HPV) infection and evasion of host defense in cervical cancer. J Infect Chemother, 2012; 18, 807−15. doi: 10.1007/s10156-012-0485-5 [14] Daniilidis A, Koutsos J, Oikonomou Z, et al. Cytokines of cervical mucosa and human papilloma virus infection of the cervix: a descriptive study. Acta Cytol, 2016; 60, 58−64. doi: 10.1159/000445161 [15] Fernandes JV, de Medeiros Fernandes TAA, de Azevedo JCV, et al. Link between chronic inflammation and human papillomavirus-induced carcinogenesis (Review). Oncol Lett, 2015; 9, 1015−26. doi: 10.3892/ol.2015.2884 [16] Vittinghoff E, McCulloch CE. Relaxing the rule of ten events per variable in logistic and cox regression. Am J Epidemiol, 2007; 165, 710−8. doi: 10.1093/aje/kwk052 -

 点击查看大图

计量
- 文章访问数: 19
- HTML全文浏览量: 7
- PDF下载量: 0
- 被引次数: 0

 Quick Links