

 下载:
下载:

-
Human rhinovirus (HRV) is one of the leading causes of respiratory tract infections[1]. Using monkey kidney cells, Pelon et al.[2] first isolated the virus in 1,956 from the nasopharyngeal fluids of a patient with an acute respiratory tract infection (ARTI). HRV is a member of the Enteroviurs genus of Picornaviridae family and includes three species, namely HRV-A, HRV-B, and HRV-C, with more than 169 genotypes identified[3,4]. HRV infection is usually a mild and self-limiting disease, and its most common manifestations include cough, fever, and sore throat[5]; however, HRV can also cause severe illness in infants, elderly people, and immunocompromised individuals[6]. Recurrent HRV infection among children in their early life is strongly associated with refractory wheezing and asthma at school age. Coinfection of HRV with other respiratory pathogens correlates with severe community-acquired pneumonia. Given the high prevalence and the resulting heavy disease burden, concerns over HRV infection have been increasing.
Multiple studies have shown that infections with different HRV species exhibit distinct clinical characteristics. HRV-A is more commonly identified in patients with bronchiolitis and pneumonia; HRV-C is associated with acute wheezing, bronchiolitis, asthma exacerbation, and structural lung disease; and HRV-B is associated with cardiovascular disease, mild respiratory disease, or asymptomatic manifestations[7-11]. Lower respiratory tract infections (LRTI) in adults are frequently related to HRV-A[12], while LRTIs in children are mainly attributed to HRV-C[13]. Therefore, exploring the molecular epidemiological characteristics and clarifying the associations between HRV genotypes and illness severity are critical for HRV infection prevention and control.
According to a surveillance study in the United States, many HRV genotypes co-circulate and genetic mutations occur frequently, and 16 variants contribute to the burden of influenza-like illness (ILI) in the community[14]. Another surveillance study in South Korea has shown that the COVID-19 pandemic resulted in an extremely low detection rate of enveloped viruses, whereas HRV, a nonenveloped virus, had a higher detection rate due to its resistance to environmental conditions and the longer virus shedding time in patients[15].
Hitherto, there has been no comprehensive nationwide HRV surveillance network in China. However, the HRV epidemics and clinical characteristics of children with HRV infection in some areas in China, such as Shanghai, Fujian province, and Macao, have been reported[16-18]; yet, these studies were mostly based on one or several pediatric hospitals instead of on a surveillance network consisting of many representative sentinel hospitals, which weakened their ability to comprehensively reflect HRV epidemical characteristics. Besides children, HRV infections also commonly affect adults; thus, HRV epidemics should also be further investigated in the adult population.
This study, utilizing the Beijing Respiratory Pathogen Surveillance System (RPSS) consisting of 35 sentinel hospitals in Beijing, recruited adult and child patients with ARTI presenting to any sentinel hospitals between 2018 and 2022. The aim was to provide insight into the epidemiological patterns, genetic divergence, and clinical characteristics of HRV infection in Beijing.
-
The Ethics Committee of the Beijing Center for Disease Prevention and Control granted the approval for this research. All participants or their legal guardians were informed about the objective, process, underlying risks, and potential health implications of this study, and their written informed consent was obtained.
-
Individuals were included if they presented to any of the sentinel hospitals for clinical manifestations consistent with acute upper respiratory tract infection (URTI) or community-acquired pneumonia (CAP) between January 1, 2018, and December 31, 2022.
In this study, URTI was defined if the patient simultaneously presented acute infection manifestations (e.g., fever, neutrophilic leukocytosis or neutropenia) and respiratory symptoms (e.g., cough, sputum production, and sore throat). CAP was defined in accordance with the guidelines for adult CAP diagnosis in China for adult patients and the guidelines for pediatric CAP management for children[19,20]. CAP was further identified as severe CAP (SCAP) and non-severe CAP (NSCAP) in line with the abovementioned guidelines.
Patients were excluded if they were recently hospitalized (less than 28 days for those with a competent immune system, and less than 90 days for the immunocompromised), or enrolled in this study within the last 28 days, or had a definite alternative respiratory diagnosis.
-
After enrollment, the participants were interviewed by their physicians using a standardized questionnaire to systematically collect demographic characteristics, epidemiological history, clinical symptoms, radiographic results, and laboratory findings. The medical records of the participants were also reviewed.
At least one of the following respiratory specimens was collected upon presentation for outpatients or within 72 h after hospitalization for inpatients: pharyngeal swab, nasopharyngeal aspirate, sputum sample, pleural fluid, tracheal aspirate, or bronchoalveolar lavage fluid.
All questionnaires and respiratory samples were transferred to the Beijing Center for Disease Prevention and Control for data analysis and laboratory testing.
-
Nucleic acids were extracted from the collected samples using Thermo ScientificTM KingFisherTM Flex Magnetic Particle Processors (Thermo Fisher, USA). Detection for 11 respiratory pathogens, including influenza virus (Flu) (AH1N1, AH3N2, BV, and BY), parainfluenza virus (PIV) (1–4), respiratory syncytial virus (RSV), human rhinovirus (RV), human adenovirus (AdV), human bocavirus (BoV), human metapneumovirus (HMPV), human coronavirus (CoV) (NL63, OC43, 229E, and HKU1), enterovirus (EV), Mycoplasma pneummoniae (MP), and Chlamydia pneumoniae (CP), was performed using a real-time reverse-transcription PCR (RT-PCR) diagnostic kit (Jiangsu Uninovo Biological Technology Co. Ltd., China).
-
The VP4/VP2 genomic region was amplified by nest RT-PCR[21]. The first-round RT-PCR amplification was performed using the one-step RT-PCR kit (Qiagen, Hilden, Germany) on a thermocycler (ABI 9902, Thermo Fisher, MA, USA) at 50 °C for 30 min, then 95 °C for 15 min, followed by 35 cycles of 95 °C for 30 s, 55 °C for 30 s, and 72 °C for 1 min, with an end extension at 72 °C for 10 min.
Two microliters of the first-round RT-PCR amplicons were used for the second-round PCR amplification with an AmpliTaq GoldTM 360 Master Mix kit (Thermo Fisher Scientific Co., Ltd., MA, USA). Thermocycling parameters for the second-round PCR were as follows: 95 °C for 10 min, followed by 35 cycles of 95 °C for 30 s, 55 °C for 30 s, and 72 °C for 1 min, ending with an extension at 72 °C for 10 min.
For the samples with failed VP4/VP2 amplification, the 5′UTR regions were amplified as an alternative method[22].
RT-PCR results were visualized on a 2% agarose gel stained with SYBR Safe (Invitrogen). The PCR products underwent purification using Biological magnetic beads (Sangon Biotech, Beijing, China) and were sequenced on the ABI Prism 3730xl DNA Analyzer at Sangon Biotech Co., Ltd. (Beijing, China).
Genotypes were determined through phylogenetic analyses, using MEGA 11 software with the neighbor-joining method and a bootstrap test of 1,000 iterations. Reference strains for different HRV genotypes were obtained from the GenBank database.
-
Continuous variables were presented as the median and interquartile range (IQR). Comparisons between different groups were conducted using the Kruskal-Wallis test. Categorical variables were presented as counts and percentages. Comparisons between different groups were performed employing the χ2 test or Fisher’s exact test if applicable. α value less than 0.05 was considered statistically significant.
Data were entered independently by two technicians utilizing EpiData 3.1 (Odense, Denmark). All statistical analyses were performed in SPSS, version 26.0 (SPSS Inc., Chicago, IL, USA).
-
A total of 7,151 cases were finally included in the study. Their age ranged from 1 month to 103 years, with a median age of 51 years (IQR: 20–72 years; in 121 cases, age information was missing). The males accounted for 57.3% (4,096/7,151), and 45 cases lacked gender information. The outpatients accounted for 36.6% (2,615/7,151). Among all included patients, 2,043 (28.6%) were diagnosed with URTI, 4,079 (57.0%) presented with NSCAP, 730 (10.2%) were identified as SCAP cases, and 168 (2.3%) had alternative diagnosis (131 cases had missing diagnostic information).
HRV was identified in 462 cases (6.5%, 462/7,151) among all included patients, with 9.2% (140/1,541) in child patients and 5.8% (321/5,516) in adult patients.
HRV genotyping succeeded in 359 (359/462, 77.7%) HRV-positive cases, with 247 (68.8%) HRV-A, 42 (11.7%) HRV-B, and 70 (19.5%) HRV-C.
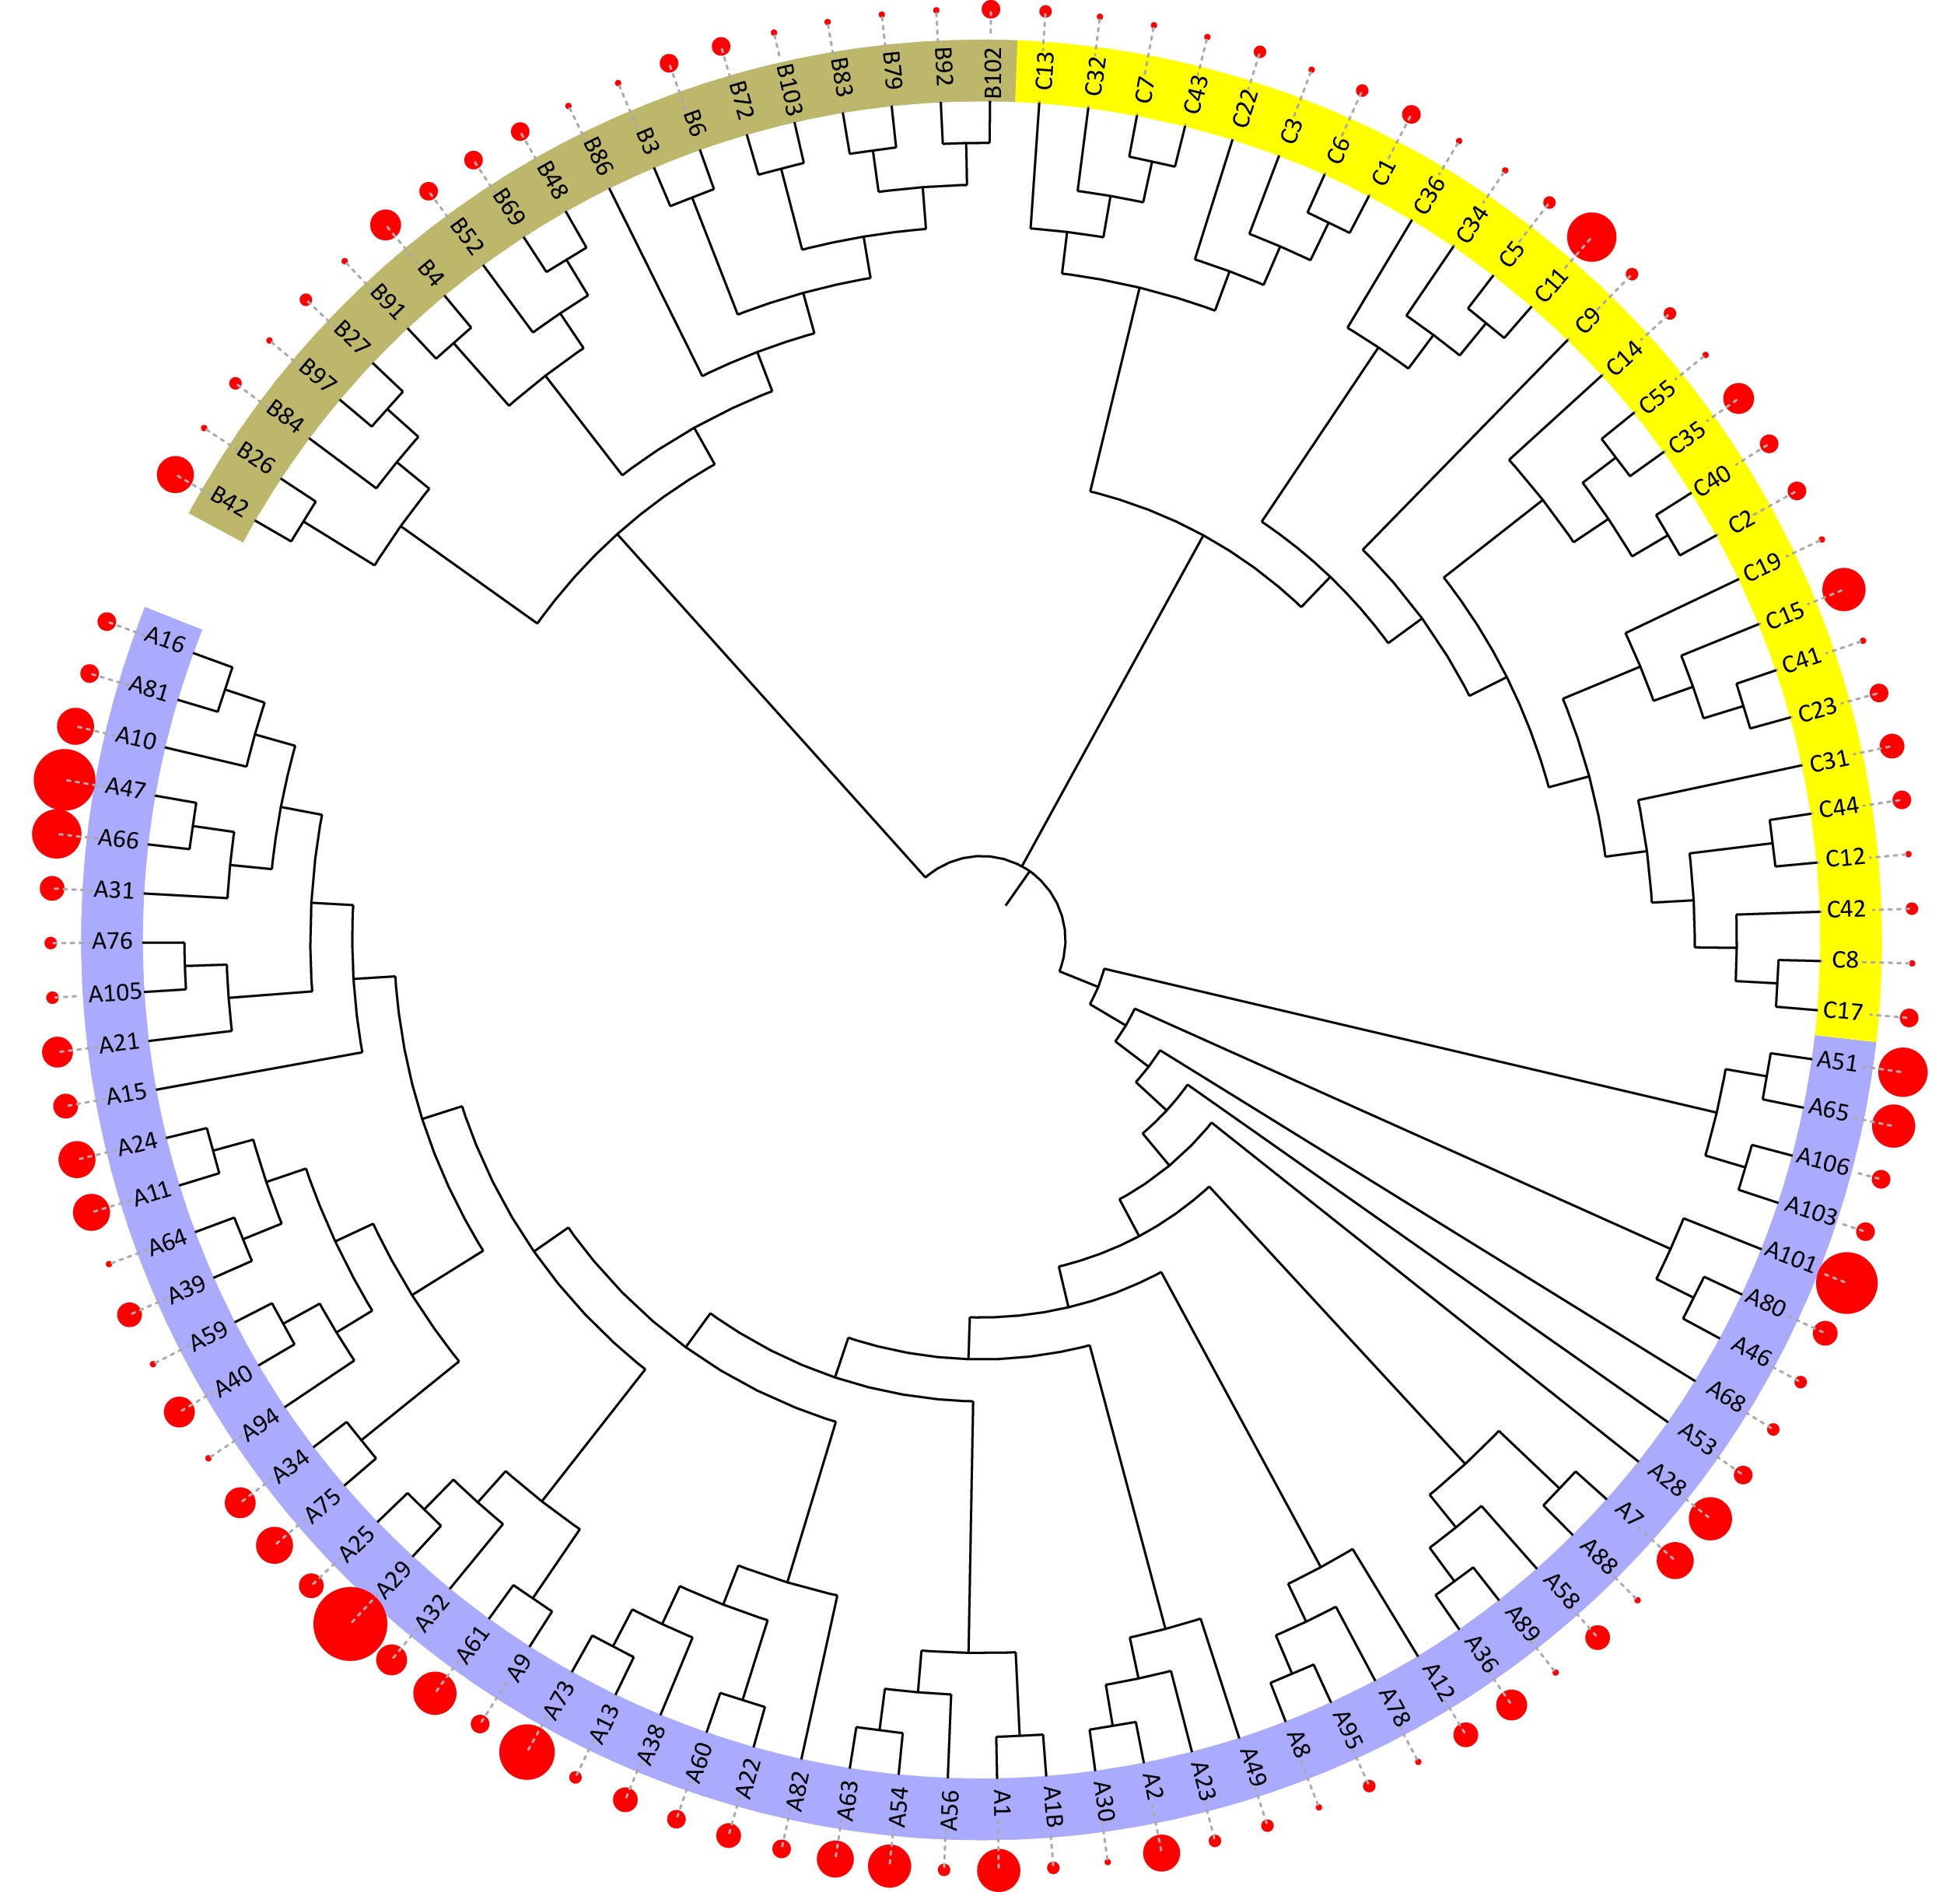
A total of 105 (62.1%) genotypes of 169 known HRV genotypes were identified in this study, including 58 HRV-A genotypes, 19 HRV-B genotypes, and 28 HRV-C genotypes. The most common genotype identified was A29 (2.6%, 12/462), followed by A101 and A47 (both 2.2%, 10/462) (Figure 1).
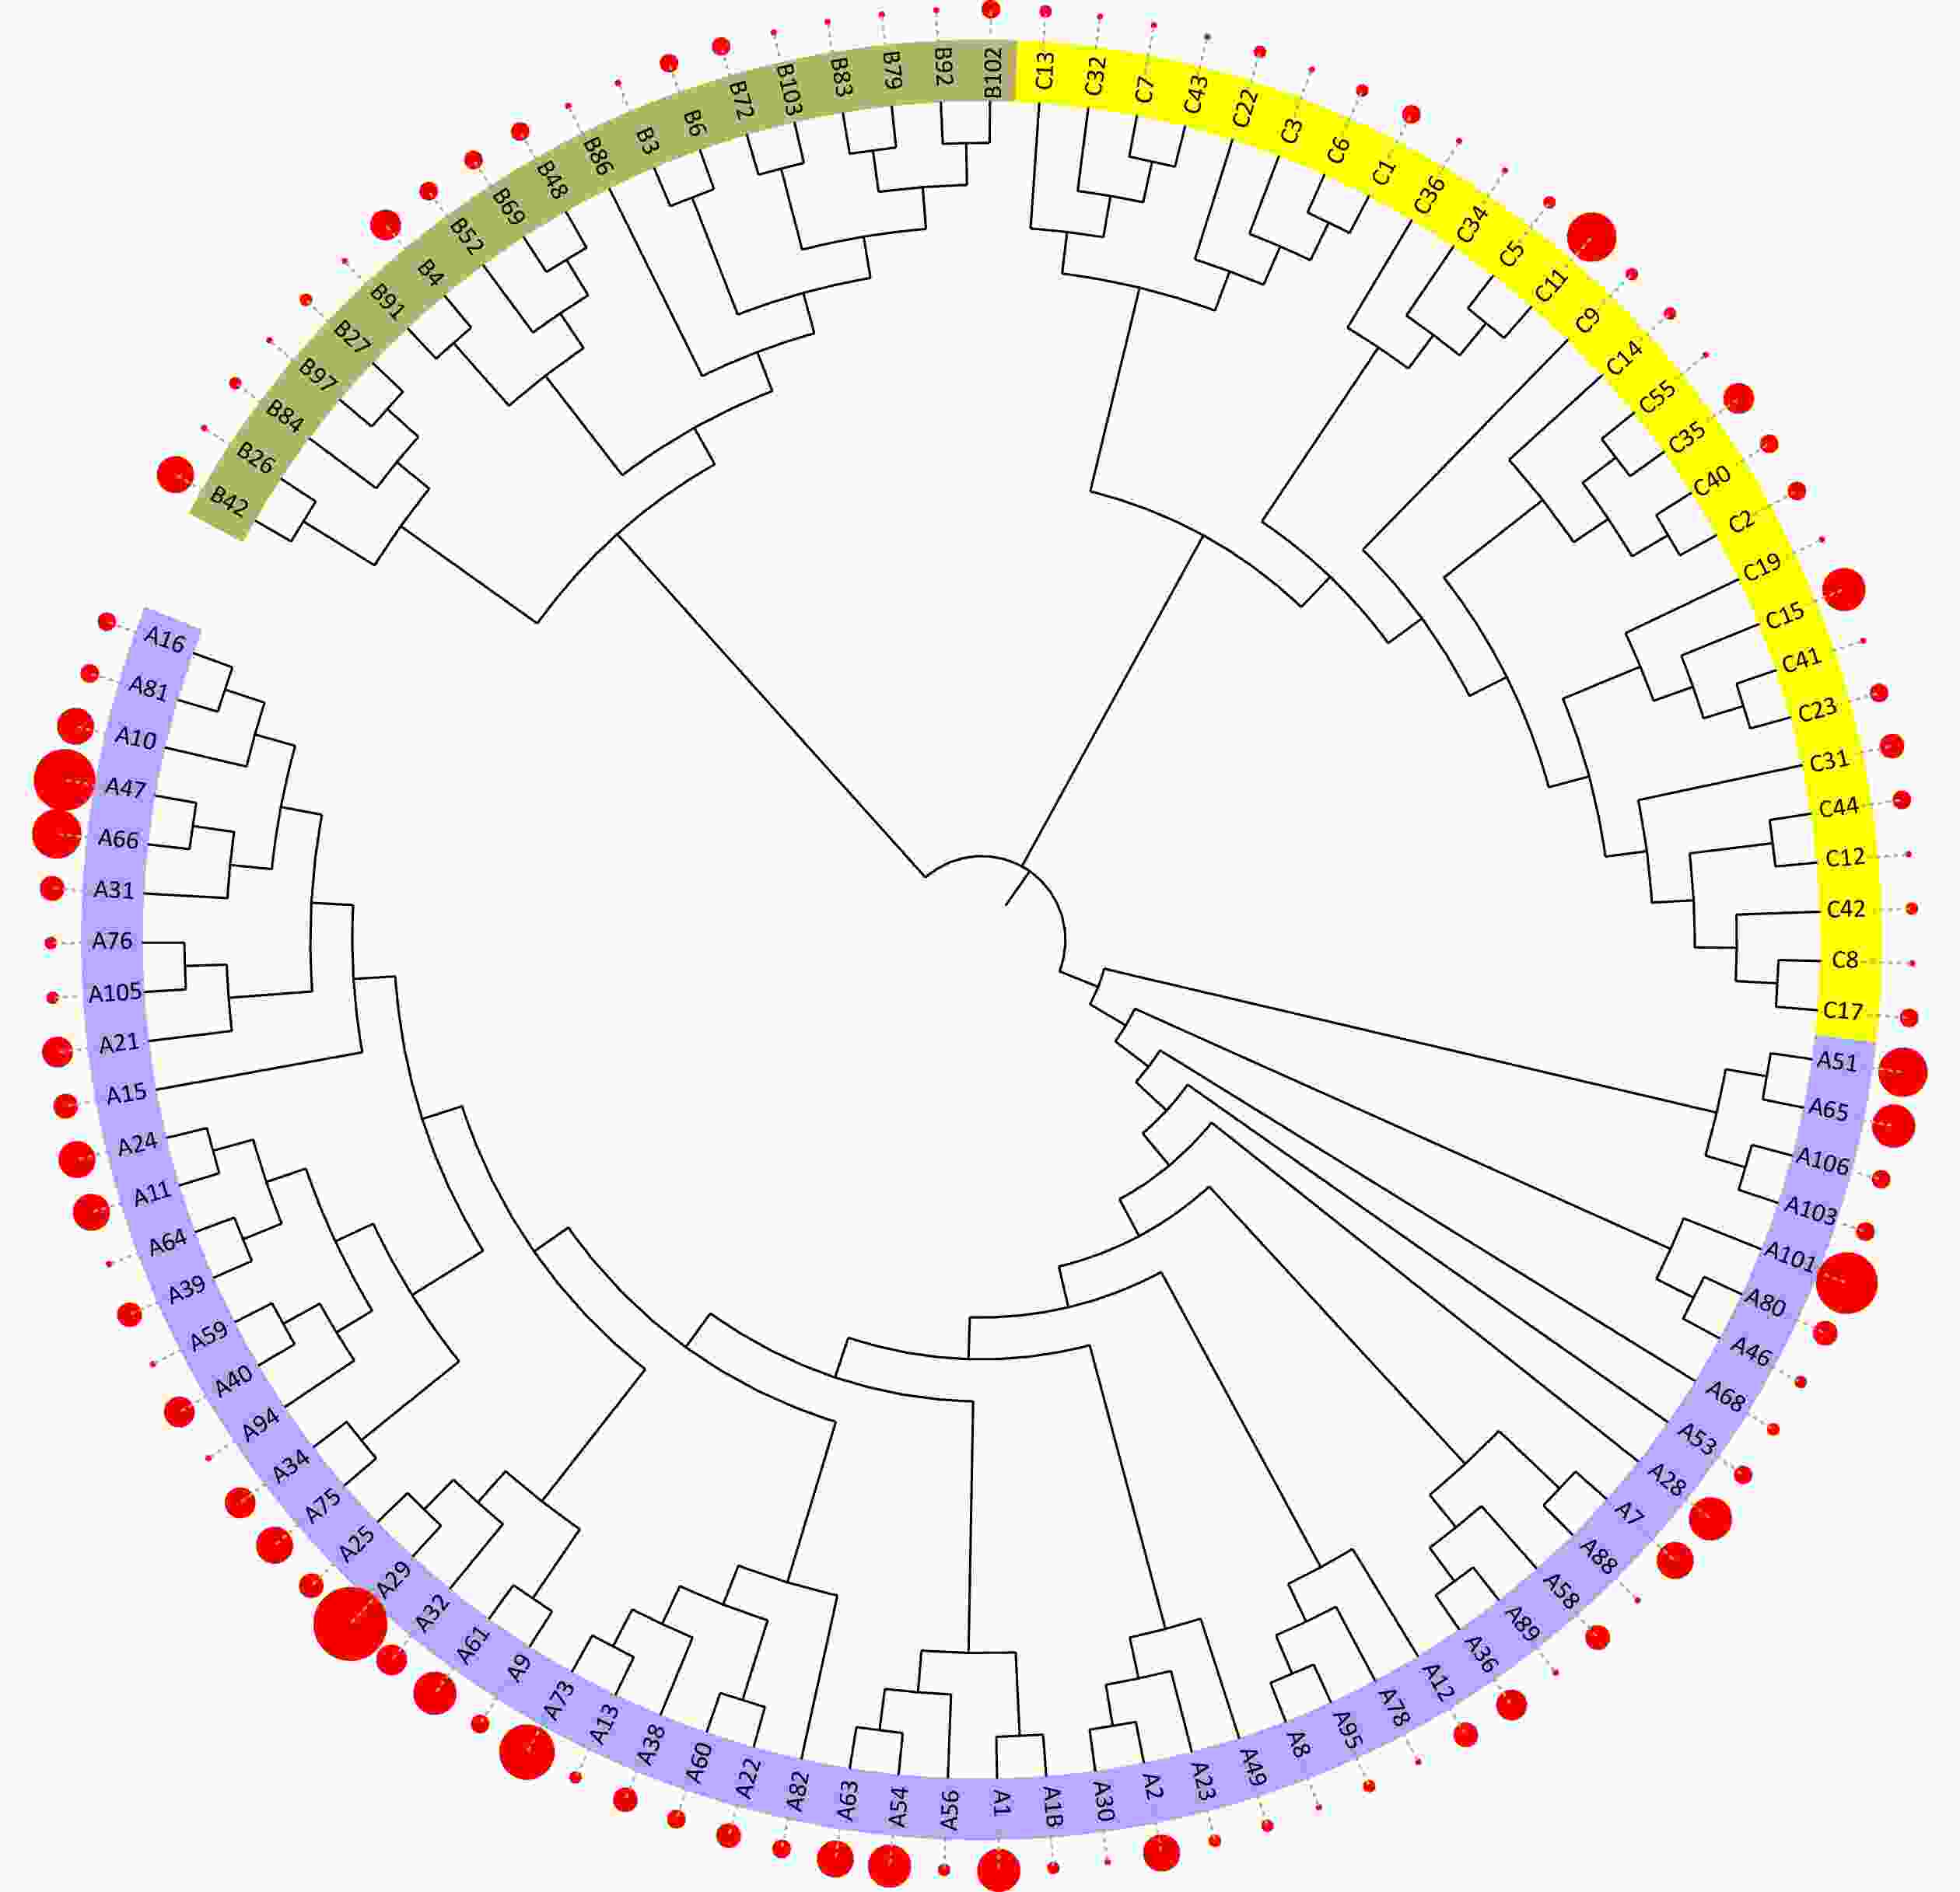
Figure 1. Phylogenetic analysis of human rhinovirus (HRV) identified in acute respiratory infection cases.
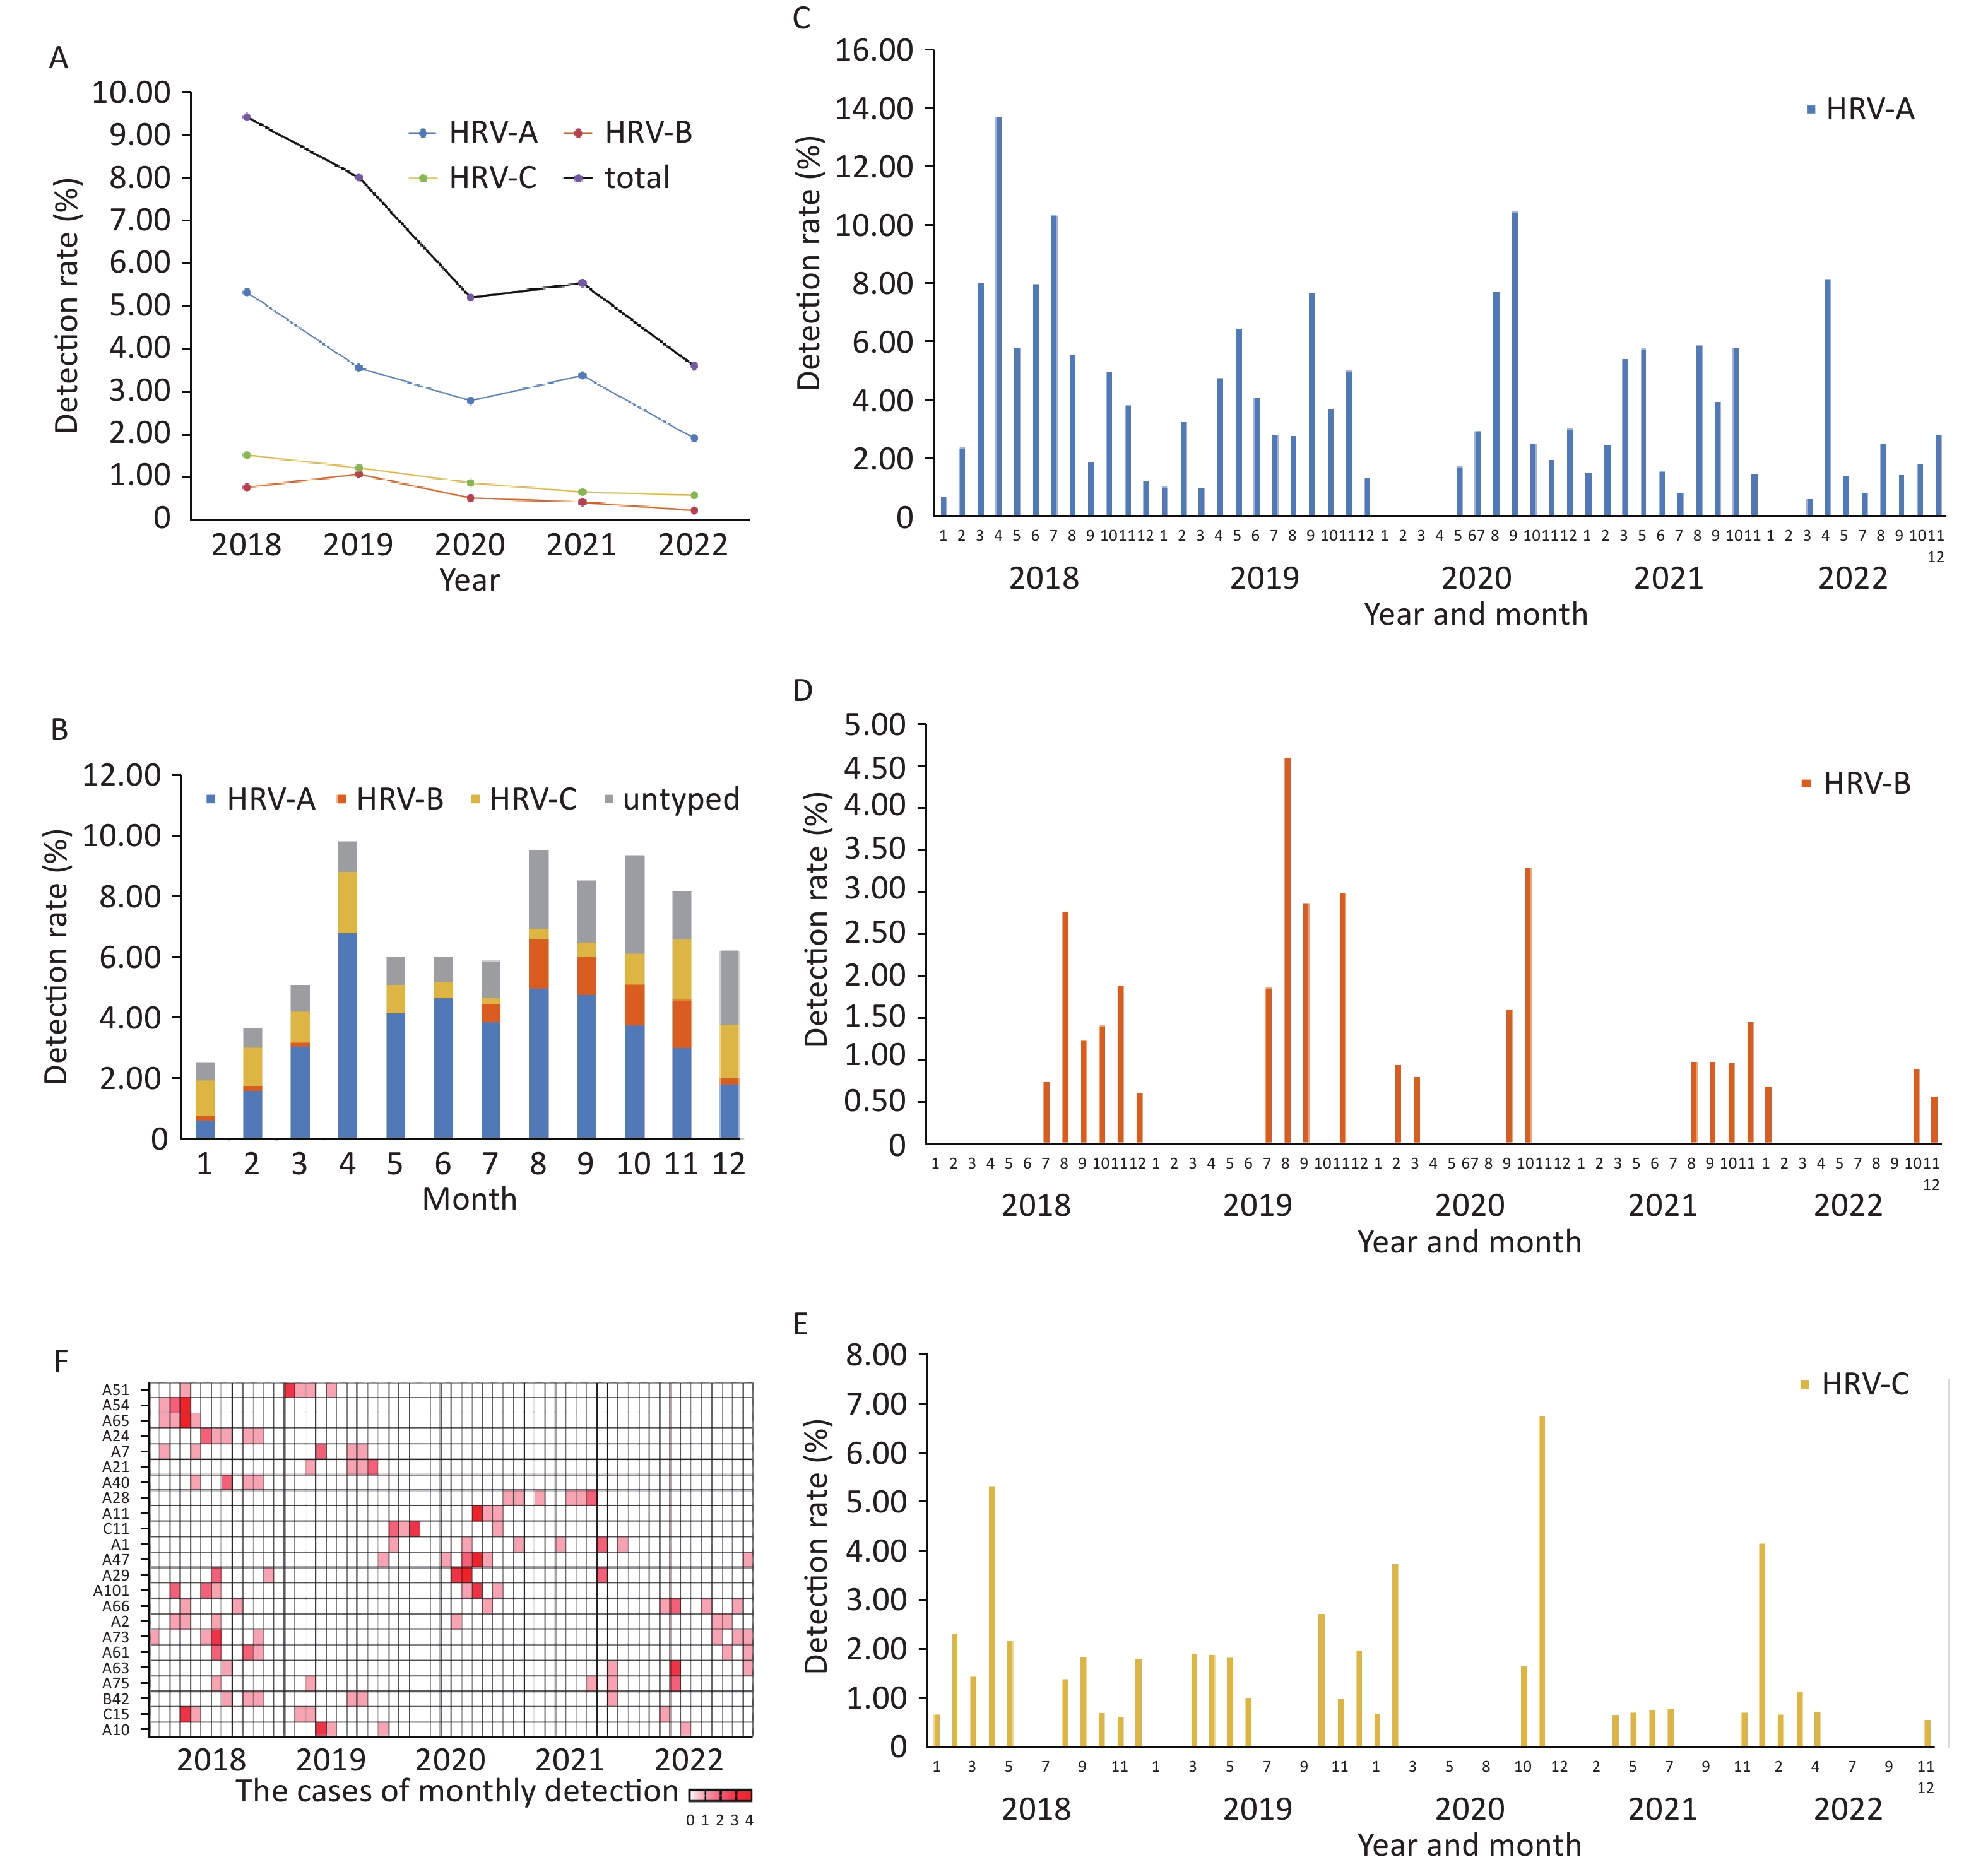
In general, the annual HRV detection rate declined from 2018 to 2022 (Figure 2A). HRV epidemic was prevalent year-round and presented two peaks each year with HRV-A as dominant species: a minor peak in spring and a major peak in Autumn (Figure 2B). HRV-A and HRV-C were detected throughout the year (Figure 2C, 2E), while HRV-B was identified almost exclusively in the second half of the year (Figure 2D). Seven HRV genotypes were not identified after the COVID-19 pandemic outbroke, and all belonged to HRV-A species (A51, A54, A65, A24, A7, A21, and A40). Five HRV genotypes were only detected after the COVID-19 epidemics emerged (A11, A47, C11, A28, and A1) (Figure 2F).
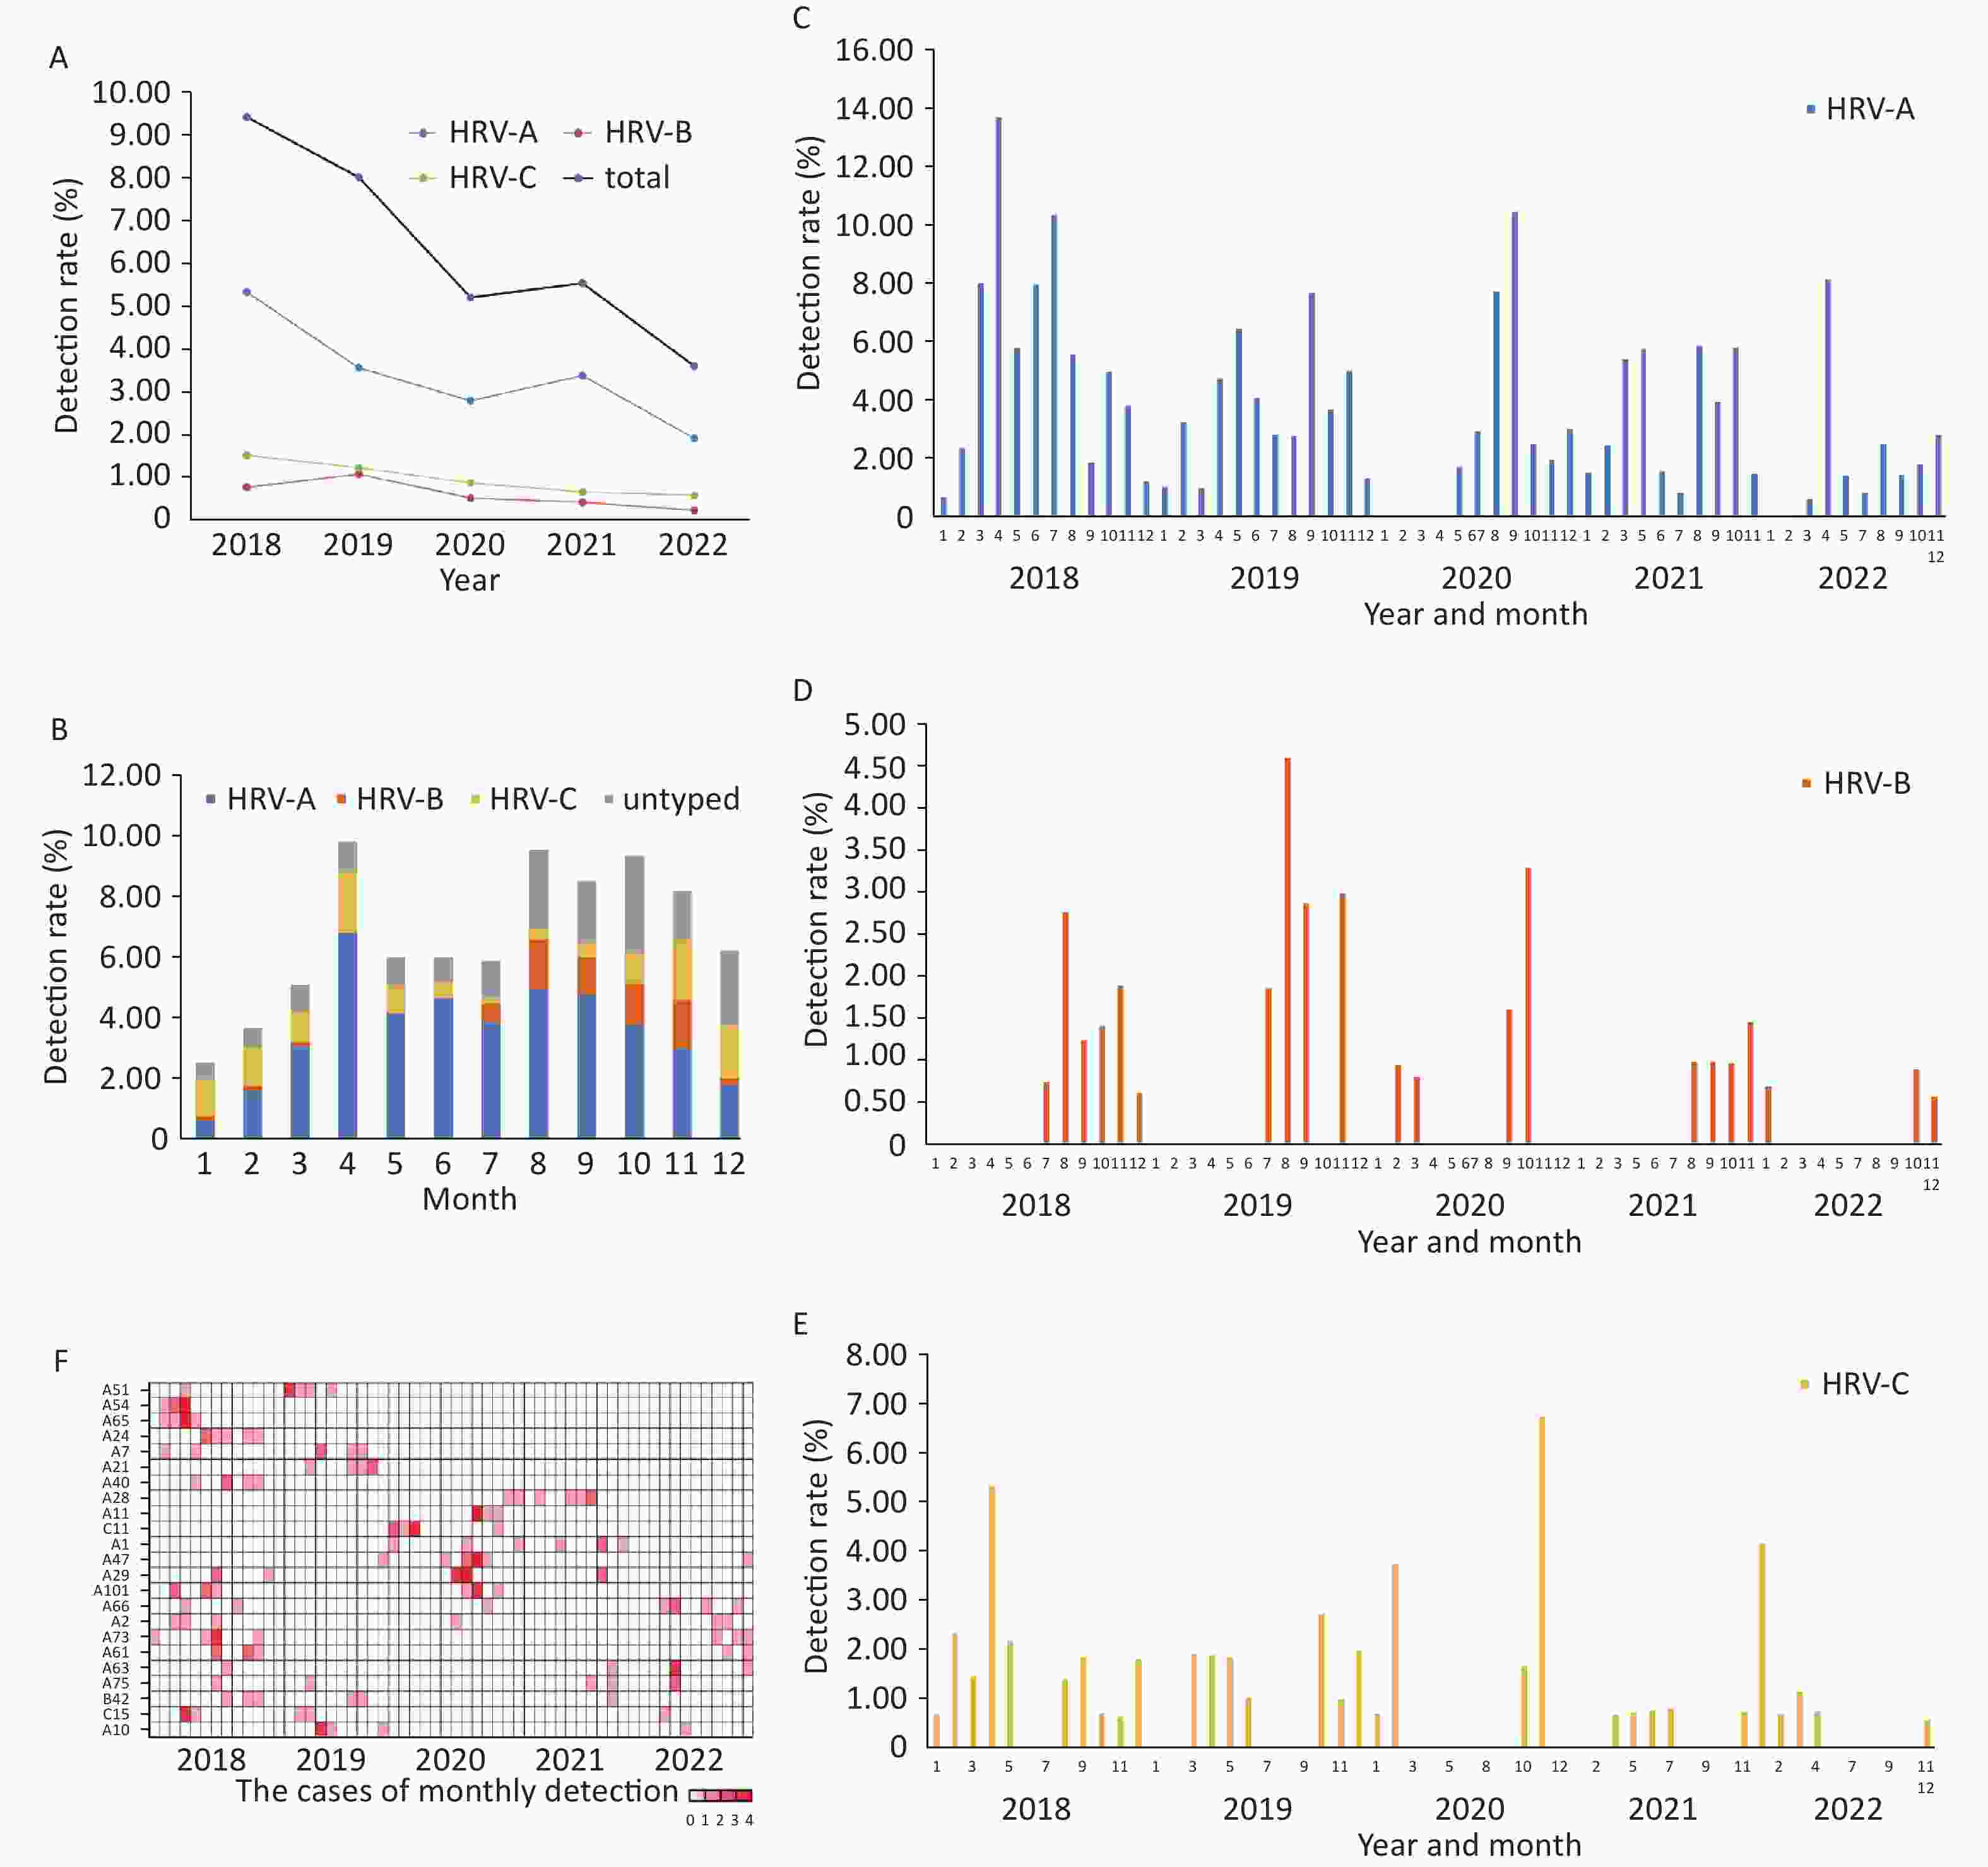
Figure 2. Human rhinovirus (HRV) seasonality in Beijing from 2018 to 2022.
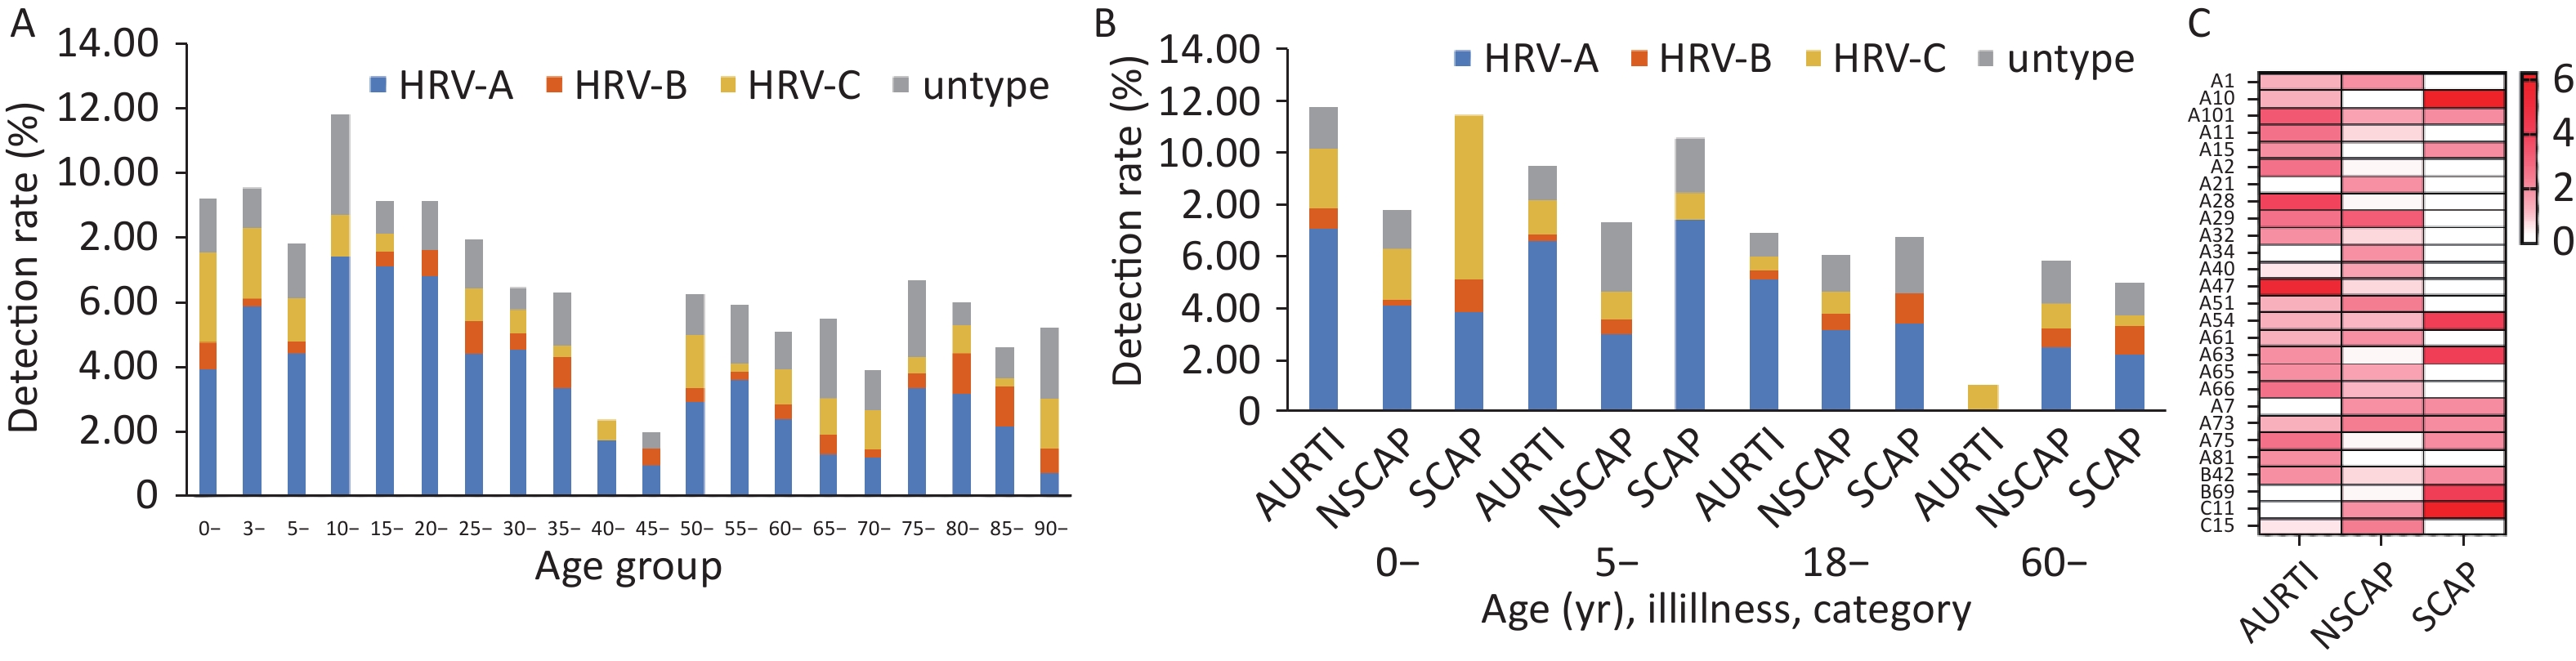
HRV was detected in all age groups with HRV-A remaining the predominant species. The detection rate declined gradually with age in general. (Figure 3A).
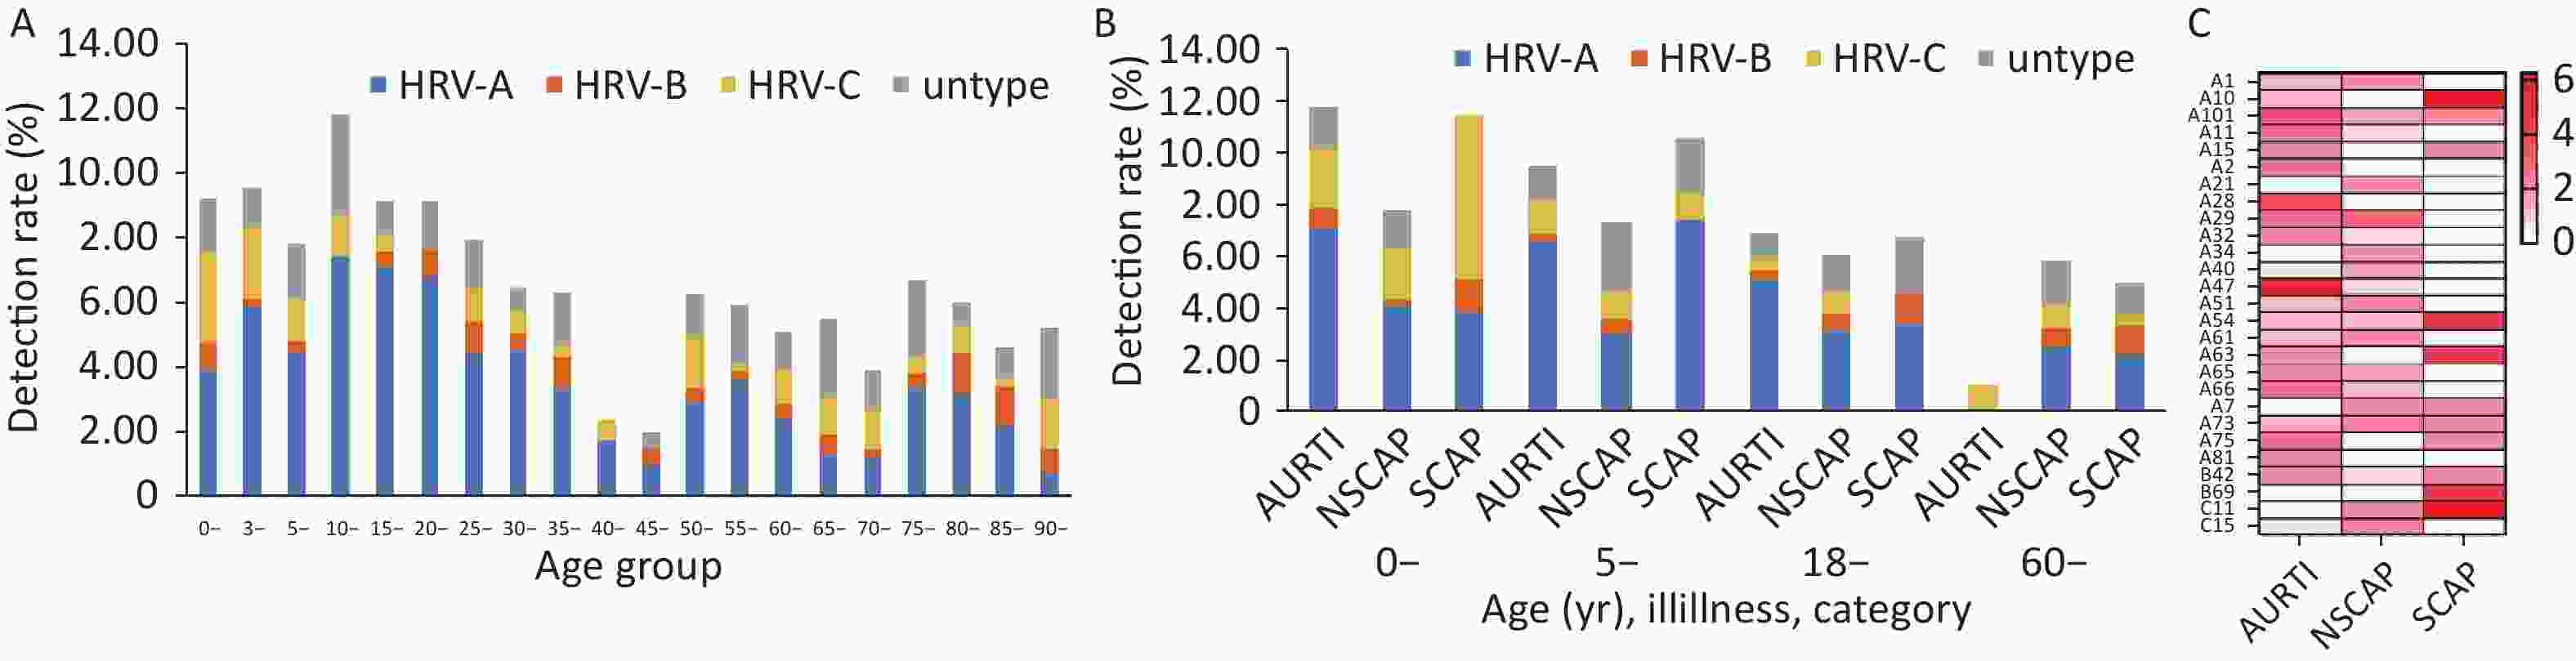
Figure 3. The distribution of the detection rates of human rhinovirus (HRV) by age group, Beijing, 2018–2022.
Among three categories of infections (URTI, NSCAP, and SCAP) in four age groups (0–4, 5–17, 18–59, older than 60 years), HRV-A was more frequently detected than HRV-B and HRV-C overall, but HRV-C accounted for the largest proportion among children aged less than 5 years with SCAP (Figure 3B).
Five genotypes (A10, C11, A54, A63, B69) were more commonly detected among the patients with SCAP (Figure 3C).
Out of the 462 HRV-infected patients, medical data were successfully collected in only 439 patients, and HRV genotypes of 344 patients were finally determined.
The children with HRV-C infection more commonly presented with fever, cough, and abnormal neutrophil and lymphocyte counts and had higher rates of hospitalization and complications. However, there were no deaths in hospital among the HRV-infected children. There was no difference in hospital length of stay among the hospitalized children infected with HRV-A and HRV-C (Table 1).
Table 1. Demographical and clinical characteristics of 344 patients with HRV infection
Clinical characteristics Children Adults HRV-A HRV-B HRV-C P HRV-A HRV-B HRV-C P Cases included 82 7 29 153 33 40 Male 47 (57.3) 3 (42.9) 11 (37.9) 0.186 87 (56.9) 18 (54.5) 22 (55) 0.938 Age, years 4.6 (3.1–9.9) 5.5 (1.2–11.3) 3.6 (1.7–5.1) 0.183 52.4 (28.1–73.9) 65.3 (32.7–84.1) 67 (51.1–75.1) 0.008 Inpatient 35 (42.7) 3 (42.9) 16 (55.2) 0.478 65 (42.5) 25 (75.8) 25 (62.5) 0.010 Time from illness onset to hospital admission, days 2 (1–5) 6 (1–6) 4 (1–6) 0.295 1 (0–3) 3 (1–6) 2 (1–7) 0.002 Comorbidity 2 (2.4) 0 3 (10.3) 0.175 46 (30.1) 19 (57.6) 20 (50) 0.003 Symptoms and signs Fever (temperature 37.3) 38/71 (53.5) 1/6 (16.7) 16/23 (69.6) 0.061 87/143 (60.8) 13/32 (40.6) 14/36 (38.9) 0.016 Temperature, °C < 37.3 33/71 (40.2) 5/6 (71.4) 7/23 (24.1) 56/143 (36.6) 19/32 (57.6) 22/36 (55) 37.3–37.9 15/71 (18.3) 0/6 7/23 (24.1) 22/143 (14.4) 3/32 (9.1) 7/36 (17.5) 38.0–38.9 16/71 (19.5) 0/6 8/23 (27.6) 56/143 (36.6) 10/32 (30.3) 6/36 (15) ≥ 39.0 7/71 (8.5) 1/6 (14.3) 1/23 (3.4) 9/143 (5.9) 0/32 1/36 (2.5) Sore throat 30 (36.6) 2 (28.6) 5 (17.2) 0.134 71 (46.4) 9 (27.3) 14 (35) 0.084 Cough 64 (78) 4 (57.1) 25 (86.2) 0.203 123 (80.4) 29 (87.9) 36 (90) 0.259 Sputum production 30 (36.6) 3 (42.9) 14 (48.3) 0.496 109 (71.2) 27 (81.8) 30 (75) 0.446 Hemoptysis 0 0 0 3 (2) 0 0 1.000 Chest pain 1 (1.2) 0 0 1.000 8 (5.2) 5 (15.2) 1 (2.5) 0.072 Dyspnea 5 (6.1) 0 2 (6.9) 1.000 42 (27.5) 12 (36.4) 16 (40) 0.239 Nasal congestion 24 (29.2) 2 (28.6) 9 (31) 1.000 30 (19.6) 7 (21.2) 6 (15) 0.757 Rhinorrhea 35 (42.7) 2 (28.6) 13 (44.8) 0.853 49 (32) 8 (24.2) 8 (20) 0.269 Headache 4 (4.9) 0 1 (3.4) 1.000 18 (11.8) 5 (15.2) 2 (5) 0.344 Fatigue 4 (4.9) 0 0 0.665 30 (19.6) 5 (15.2) 3 (7.5) 0.183 Myalgia 2 (2.4) 0 0 1.000 16 (10.5) 1 (3.0) 0 0.041 Diarrhea 3 (3.7) 0 0 0.639 6 (3.9) 1 (3.0) 0 0.619 Abdominal pain 1 (1.2) 0 2 (6.9) 0.307 1 (0.7) 1 (3.0) 0 0.302 Nausea or vomiting 1 (1.2) 0 0 1.000 2 (1.3) 0 1 (2.5) 0.692 Oliguria 0 0 0 1 (0.7) 0 0 1.000 Disturbance of consciousness 0 0 0 9 (5.9) 2 (6.1) 0 0.288 Abnormal respiratory rate, beats/min 51/66 (77.3) 3/5 (60.0) 23/24 (95.8) 0.047 55/150 (36.7) 11/31 (35.5) 16/36 (44.4) 0.829 White blood cell count, ×109/L 10.6 (7.9–13.3) 8.4 (7.3–15.6) 10.2 (7.6–15.6) 0.538 7.6 (7.2–12.5) 9.4 (5.9–12.2) 9.3 (6.2–12.0) 0.497 < 4 2/75 (2.7) 0/6 1/26 (3.8) 1.000 2/142 (1.4) 2/31 (6.5) 3/38 (7.9) 0.054 4–10 31/75 (41.3) 5/6 (83.3) 12/26 (46.2) 75/142 (52.8) 16/31 (51.6) 19/38 (50) ≥ 10 42/75 (56) 1/6 (16.7) 13/26 (50) 65/142 (45.8) 13/31 (41.9) 16/38 (42.1) Lymphocyte count, ×109/L 22.8 (17.1–37.3) 29.1 (23.2–35.7) 25.2 (15.3–50.3) 0.742 12.9 (9.3–19.2) 14.7 (6.6–22.9) 12.4 (8.8–22.5) 0.652 < 20 26/71 (36.6) 0/6 12/26 (46.2) 0.109 101/133 (75.9) 18/31 (58.1) 25/37 (67.6) 0.115 20–40 29/71 (40.8) 5/6 (83.3) 5/26 (19.2) 30/133 (22.6) 11/31 (35.5) 9/37 (24.3) > 40 16/71 (22.5) 1/6 (16.7) 9/26 (34.6) 2/133 (1.5) 2/31 (6.5) 3/37 (8.1) Neutrophil proportion, % 67.3 (51.0–74.4) 61.0 (54.0–66.9) 67.7 (40.6–77.9) 0.768 78.9 (70.0–84.3) 75.1 (65.4–87.3) 80.0 (66.83–85) 0.683 < 50 17/72 (23.6) 1/6 (16.7) 9/26 (34.6) 0.535 4/135 (3.0) 2/31 (6.5) 3/38 (7.9) 0.219 50–69 23/72 (31.9) 4/6 (66.7) 4/26 (15.4) 29/135 (21.5) 8/31 (25.8) 10/38 (26.3) ≥ 70 32/72 (44.4) 1/6 (16.7) 13/26 (50.0) 102/135 (75.6) 21/31 (67.7) 25/38 (65.8) Platelet count, ×109/L 278 (232–342) 285 (175–412) 260 (200–307) 0.387 209 (176–253) 207 (160–265) 226 (171–283) 0.686 < 100 0/67 0/4 0/23 3/131 (2.3) 1/28 (3.6) 1/35 (2.9) 0.811 Creatinine, µmol/L 24.6 (22.0–31.5) – 27.0 (23.0–37.1) 0.482 68.7 (60.0–93.0) 72.0 (55.0–130.5) 65.7 (59.5–105) 0.814 > 133 0/25 0/2 0/14 5/64 (7.8) 6/24 (25.0) 1/23 (4.3) 0.061 Blood urea nitrogen, mmol/L 3.2 (2.3–4.2) – 2.6 (2.3–4.2) 0.839 5.8 (4.4–8.3) 6.8 (4.9–14.5) 5.7 (3.4–8.8) 0.271 ≥ 7.14 2/26 (7.7) 0/2 1/15 (6.7) 1.000 18/61 (29.5) 11/25 (44.0) 9/22 (40.9) 0.362 Alanine aminotransferase, U/L 22.0 (14.0–31.2) – 14.0 (12.0–20.0) 0.13 15.0 (10.0–24.5) 14.0 (9.0–24.0) 17.0 (11.0–29.0) 0.504 > 40 4/26 (15.4) 0/2 1/15 (6.7) 0.713 6/61 (9.7) 3/25 (12) 0/25 0.188 Aspartate aminotransferase, U/L 26.5 (20.8–46.0) – 29.0 (26.0–46.0) 0.413 19.0 (15.0–28.0) 20.0 (13.0–25.0) 21.0 (14.3–28.0) 0.959 > 40 8/26 (30.8) 0/2 4/15 (26.7) 1.000 5/61 (8.2) 5/25 (20) 1/24 (4.2) 0.212 Creatine kinase, U/L 81.0 (59.5–136.5) – 63.0 (51.0–87.0) 0.119 69.0 (42.3–147.5) 79.0 (32.0–109.5) 53 (36.5–148.5) 0.712 > 200 5/25 (20) 0/2 1/15 (6.7) 0.547 6/56 (10.7) 2/25 (8) 3/21 (14.3) 0.830 Creatine kinase MB fraction, U/L 18.0 (12.0–28.0) – 18.0 (16.0–25.0) 0.965 11.0 (7.0–15.0) 7.0 (4.3–14.3) 11.5 (5.5–19.5) 0.326 > 25 9/25 (36) 0/2 2/15 (13.3) 0.203 7/55 (12.7) 2/24 (8.3) 3/20 (15.0) 0.843 The arterial partial pressure of oxygen 94.0 (49.0–108.0) – – 81.0 (63.5–95.8) 70.5 (62.8–90) 70.0 (66.3–87.5) 0.404 Saturation of arterial blood oxygen, % 96.0 (87.3–99.0) – – 95.3 (92.2–98) 95.0 (91.2–97.0) 95.0 (92.0–97.0) 0.626 < 90 2/7 (28.6) – – 5/54 (9.3) 1/21 (4.8) 0/22 0.400 Oxygen therapy 9 (11) 1 (14.3) 5 (17.2) 0.557 51 (33.3) 20 (60.1) 21 (52.5) 0.004 Mechanical ventilation 4 2 2 0.090 12 (7.8) 7 (21.2) 1 (2.5) 0.019 Noninvasive 4 (4.9) 1 (14.3) 1 (3.4) 0.214 5 (3.3) 3 (9.1) 1 (2.5) 0.807 Invasive 0 1 (14.3) 1 (3.4) 7 (4.6) 4 (12.1) 0 Extracorporeal Membrane Oxygenation, ECMO 0 0 0 1 (0.7) 0 0 1.000 Complications 0 0 4 (13.8) 0.005 15 (9.8) 9 (27.3) 8 (20) 0.017 ICU admission 0 1 (14.3) 1 (3.4) 0.032 8 (5.2) 7 (21.2) 5 (12.5) 0.009 Discharge from hospital 82/82 (100) 7/7 (100) 29/29 (100) 153/153 (100) 29/33 (87.9) 40/40 (100) <0.001 Death in hospital 0 0 0 0 4 (12.1) 0 Hospital length of stay (days) 7.0 (5–8) – 7.0 (5.5–14) 0.667 10.0 (8.0–16.0) 10.5 (8.5–16.8) 14 (10–17) 0.316 Time from illness onset to discharge (days) 11.0 (7.8–16.3) – 11.
0(7.5–16.5)0.804 15.0 (11.0–24.0) 16.0
(13.0–22.0)20.5 (15.8–38) 0.108 Time from illness onset to death (days) – – – – 18.5 (6.8–42.3) – Note. Data were represented as n, n (%), mean (range). The adults with HRV-B had higher rates of hospitalization, intensive care unit admission, and complications compared to those with HRV-A and HRV-C. Four adult patients with HRV infection died in this study, and all were proven to be infected with HRV-B (B69, B52, B4, B48). They were all elderly men (aged 66–89 years), and three of them were co-infected with HRV and other respiratory pathogens (Table 1).
-
Of the 461 cases, 34 children and 55 adults were co-infected with HRV and other respiratory viruses, MP, and CP. Co-infection rates in children and adults were 26.5% (39/147) and 18.2% (57/314), respectively (Table 2).
Table 2. Co-infection with other respiratory virus or Mycoplasma pneumoniae among HRV-infected 461 patients
Pathogen Children A = 82 B = 7 C = 29 Untype = 29 Total 147 Adult A = 165 B = 35 C = 41 Untype = 73 Total 314 Case with co-infection 14 1 8 11 34 16 7 18 14 55 Flu 0 0 0 0 0 2 0 4 2 8 CoV 1 0 1 0 2 3 1 1 3 8 PIV 3 0 1 4 8 5 0 1 1 7 RSV 0 0 1 0 1 0 0 0 1 1 AdV 1 0 1 1 3 0 0 0 0 0 MP 3 1 2 1 7 1 5 0 2 8 CP 0 0 0 1 1 0 0 0 0 0 HMPV 1 0 0 0 1 1 0 0 2 3 EV 5 0 6 3 14 4 1 13 3 21 BoV 1 0 0 1 2 1 0 0 0 1 Total 15 1 12 11 39 17 7 19 14 57 The rate of co-infection (%) 18.2 14.3 41.4 37.9 26.5 10.3 20.0 46.3 19.2 18.2 Note. Flu, influenza virus; PIV, parainfluenza virus; RSV, respiratorysyncytial virus; RV, human rhinovirus; AdV, humanadenovirus; BoV, human bocavirus; HMPV, humanmetapneumovirus; CoV, human coronavirus; EV, enterovirus; MP, Mycoplasma pneummoniae; CP, Chlamydia pneumoniae. The most three common co-infecting pathogens were EV (11 cases), MP (6 cases) and PIV (5 cases) for child, and were EV (18 cases), Flu (7 cases),MP (6 cases) and PIV (6 cases) for adults. Only one HRV-positive child was confirmed to be co-infected by RSV. Both children and adults infected with HRV-C had higher co-infection rates than those infected with HRV-A or HRV-B (Table 2).
The co-infection proportion among CAPs with HRV infection (22.3%, 67/300) was significantly higher than that among URTIs due to HRV (12.6%, 19/151) (χ2= 6.18, P = 0.013) (Table 2).
-
This study provides a comprehensive overview of the epidemic characteristics of HRV circulating in Beijing between 2018 and 2022. Zhao et al.[23] showed that the HRV detection rate among children with asthma or ARTI in Beijing between 2013 and 2015 was 15.4%, which is higher than what we reported in the present study (9.2%). Li et al.[24] reported that the HRV positive rate was about 16.7% among ARTIs in China’s mainland between 2009 and 2019, which is also much higher than the 6.5% reported in this study. The inconsistency may be attributed to the difference in the included populations.
One of the most notable findings is the high genetic diversity observed within HRV. Among a total of 462 HRV-infected patients from more than 7,000 recruited patients with ARTI, we identified 105 genotypes, out of the 169 known HRV genotypes. Notably, even the most prevalent genotype was found in only 12 cases, indicating the absence of a predominant genotype during this period in Beijing’s HRV epidemics. This distinguishes HRV from other respiratory viruses like RSV, EV and Flu. In contrast, RSV circulating in Beijing exhibited clustering in dominant genotypes such as RSV-A ON1 and RSV-B BA9, which collectively constituted more than 95% of RSV isolates[25]. Similarly, EV, belonging to the Enterovirus genus, demonstrated a diverse range of genotypes, with over 100 genotypes identified. However, the predominant genotypes driving EV epidemics in Beijing were coxsackievirus A6 (CVA6), EV-D68, CVA4, CVA2, CVA10, CVA5, and CVA12, which collectively represented 71.45% of identified EV infections[26]. Influenza epidemics in Beijing, akin to other areas in China, were consistently attributed to influenza virus AH3N2, H1N1 and influenza virus B Victoria lineage.
Jacobs et al.[6] reported there is no distinct cross-neutralization among multiple HRV genotypes. Muller et al.[27] observed that children can experience recurrent infections with different HRV genotypes in a cohort study, which supported Jacobs’ findings. The absence of cross-neutralization between different genotypes makes it challenging to establish robust population immunity. This, coupled with the high genetic diversity, likely accounts for the high prevalence and attenuated seasonality of HRV epidemics observed in our study. Tran et al.[28] also reported that there were many HRV genotypes co-circulating without a typical predominant genotype in Vietnam and considered that it was the high genetic diversity that probably contributed to the high prevalence of HRV.
Another notable finding of this study is on HRV-B. HRV-B has been considered to cause milder illness compared to HRV-A and HRV-C, and comprehensive study on HRV-B epidemics has been limited. However, our study found that HRV-B exhibited relatively obvious seasonality and was predominantly prevalent in the second half of the year during the five consecutive years. Furthermore, the adults infected with HRV-B also had higher rates of hospitalization, intensive care unit admission, and complications. Four adult patients with HRV infection died in this study, and all were confirmed to be infected with HRV-B (B69, B52, B4, B48). These findings underscore the necessity for further research on HRV-B to gain a comprehensive understanding of its epidemiological and clinical characteristics.
In addition, we discovered that HRV-C was more prevalent than HRV-A and HRV-B among children under 5 years old with SCAP, while HRV-A maintained its absolute predominance in other age/illness groups. We observed a gradual decline in HRV prevalence with age, unlike RSV, which does not exhibit a resurgence among older individuals. Furthermore, we identified a higher incidence of co-infection between HRV and other respiratory viruses among patients with CAP compared to those with URTI, regardless of age. These findings are consistent with numerous other studies[8,10]. Multiple studies have reported that infections with some specific genotypes of HRV, such as A45, A89, B91, and C43, are more likely to develop into severe illness[29-31]. However, in this study, these HRV genotypes were not identified in the cases of SCAP and were mainly replaced by A10, C11, A54, A63, and B69.
Readers should consider several limitations in this study. Firstly, the RPSS system primarily focuses on monitoring pneumonia, potentially skewing the pneumonia-to-URTI ratio. Secondly, co-infection of HRV and bacteria is common but not analyzed in this study. Thirdly, HRV has been identified in some healthy individuals, suggesting that the presence of detected HRV may not necessarily indicate the cause of illness[32]. These limitations possibly led an overestimation of HRV infection burden and should be addressed in further studies.
In summary, our study found that HRV circulating in Beijing exhibited high diversity in genotype by a long-term surveillance, which made it difficult to establish effective population immunity and could explain why HRV exhibited relatively high prevalence and attenuated seasonality. HRV-C was more common among children aged less than 5 years with SCAP, whereas HRV-B showed higher pathogenicity among adults, which warrants further research.
doi: 10.3967/bes2024.126
High Diversity in Genotypes of Human Rhinovirus Contributes to High Prevalence in Beijing, 2018–2022: A Retrospective Multiple-Center Epidemiological Study
-
Abstract:
Objective To comprehensively examine the molecular epidemiological characteristics of human rhinovirus (HRV) in Beijing. Methods A total of 7,151 children and adults with acute respiratory tract infections (ARTIs) were recruited from 35 sentinel hospitals in Beijing between 2018 and 2022. Their respiratory samples were obtained, and epidemiological and clinical data were collected. Nucleic acid testing for 11 respiratory pathogens, including HRV, was performed on the specimens. We sequenced VP4/VP2 or 5’UTR of HRV isolates to identify their genotypes using phylogenetic analyses. Results HRV was detected in 462 (6.5%) cases. A total of 105 HRV genotypes were successfully identified in 359 (77.7%) specimens, comprising 247 (68.8%) with HRV-A, 42 (11.7%) with HRV-B, and 70 (19.5%) with HRV-C. No predominant genotype was observed. HRV was prevalent year-round with two weak peaks in spring and autumn. HRV detection declined gradually between 2018 and 2022, with seven genotypes disappearing and five genotypes emerging. HRV detection rate decreased by age without resurge among old people. HRV-C was more common among children aged less than 5 years with severe community-acquired pneumonia compared to HRV-A and HRV-B. Adults infected with HRV-B had higher rates of hospitalization, intensive care unit admission, and complications than those infected with HRV-A and HRV-C. Conclusion HRV epidemics in Beijing were highly dispersed in genotypes, which probably resulted in a high prevalence of HRV infection, attenuated its seasonality, and made it more difficult to establish effective population immunity. -
Key words:
- Human rhinovirus /
- Genotype /
- Epidemical characteristics /
- Respiratory infection /
- Community-acquired pneumonia
All authors declare no competing interests.
注释:1) AUTHOR CONTRIBUTIONS: 2) COMPETING INTEREST: -
Figure 1. Phylogenetic analysis of human rhinovirus (HRV) identified in acute respiratory infection cases.
The sequences of HRV VP4/VP2 were aligned and clustered by MEGA version 11 using neighbor-joining method with bootstrap of 1,000 replicates. To make the phylogenetic tree much clearer, the clades of reference strains were hidden. The red dots represent the case numbers of the identified genotypes, the more cases, the larger dot.
Figure 2. Human rhinovirus (HRV) seasonality in Beijing from 2018 to 2022.
(A) The annual detection rates for HRV-A (blue line), HRV-B (orange line), HRV-C (yellow line) and overall HRV (black line). (B) The average of monthly detection rates for HRV-A (blue), HRV-B (orange), HRV-C (yellow) and untyped HRV (gray). (C), (D), and (E) The monthly detection rate for HRV-A, HRV-B and HRV-C respectively. (F) the mosaic graph represents the monthly detection rate for each genotype of the identified HRV.
Figure 3. The distribution of the detection rates of human rhinovirus (HRV) by age group, Beijing, 2018–2022.
(A) The bar charts represent the detection rate of HRV-A (blue), HRV-B (orange), HRV-C (yellow) and untyped HRV (gray), the line chart represents the overall detection rate of HRV. (B) The distribution of the detection rates of HRV by age group and illness severity classification. The bar charts represent the detection rates of HRV-A (blue), HRV-B (orange), HRV-C (yellow) and untyped HRV (gray). (C) the heatmap represents the detection rate of each type of the identified HRV. The larger color scale indicates the higher detection rate.
Table 1. Demographical and clinical characteristics of 344 patients with HRV infection
Clinical characteristics Children Adults HRV-A HRV-B HRV-C P HRV-A HRV-B HRV-C P Cases included 82 7 29 153 33 40 Male 47 (57.3) 3 (42.9) 11 (37.9) 0.186 87 (56.9) 18 (54.5) 22 (55) 0.938 Age, years 4.6 (3.1–9.9) 5.5 (1.2–11.3) 3.6 (1.7–5.1) 0.183 52.4 (28.1–73.9) 65.3 (32.7–84.1) 67 (51.1–75.1) 0.008 Inpatient 35 (42.7) 3 (42.9) 16 (55.2) 0.478 65 (42.5) 25 (75.8) 25 (62.5) 0.010 Time from illness onset to hospital admission, days 2 (1–5) 6 (1–6) 4 (1–6) 0.295 1 (0–3) 3 (1–6) 2 (1–7) 0.002 Comorbidity 2 (2.4) 0 3 (10.3) 0.175 46 (30.1) 19 (57.6) 20 (50) 0.003 Symptoms and signs Fever (temperature 37.3) 38/71 (53.5) 1/6 (16.7) 16/23 (69.6) 0.061 87/143 (60.8) 13/32 (40.6) 14/36 (38.9) 0.016 Temperature, °C < 37.3 33/71 (40.2) 5/6 (71.4) 7/23 (24.1) 56/143 (36.6) 19/32 (57.6) 22/36 (55) 37.3–37.9 15/71 (18.3) 0/6 7/23 (24.1) 22/143 (14.4) 3/32 (9.1) 7/36 (17.5) 38.0–38.9 16/71 (19.5) 0/6 8/23 (27.6) 56/143 (36.6) 10/32 (30.3) 6/36 (15) ≥ 39.0 7/71 (8.5) 1/6 (14.3) 1/23 (3.4) 9/143 (5.9) 0/32 1/36 (2.5) Sore throat 30 (36.6) 2 (28.6) 5 (17.2) 0.134 71 (46.4) 9 (27.3) 14 (35) 0.084 Cough 64 (78) 4 (57.1) 25 (86.2) 0.203 123 (80.4) 29 (87.9) 36 (90) 0.259 Sputum production 30 (36.6) 3 (42.9) 14 (48.3) 0.496 109 (71.2) 27 (81.8) 30 (75) 0.446 Hemoptysis 0 0 0 3 (2) 0 0 1.000 Chest pain 1 (1.2) 0 0 1.000 8 (5.2) 5 (15.2) 1 (2.5) 0.072 Dyspnea 5 (6.1) 0 2 (6.9) 1.000 42 (27.5) 12 (36.4) 16 (40) 0.239 Nasal congestion 24 (29.2) 2 (28.6) 9 (31) 1.000 30 (19.6) 7 (21.2) 6 (15) 0.757 Rhinorrhea 35 (42.7) 2 (28.6) 13 (44.8) 0.853 49 (32) 8 (24.2) 8 (20) 0.269 Headache 4 (4.9) 0 1 (3.4) 1.000 18 (11.8) 5 (15.2) 2 (5) 0.344 Fatigue 4 (4.9) 0 0 0.665 30 (19.6) 5 (15.2) 3 (7.5) 0.183 Myalgia 2 (2.4) 0 0 1.000 16 (10.5) 1 (3.0) 0 0.041 Diarrhea 3 (3.7) 0 0 0.639 6 (3.9) 1 (3.0) 0 0.619 Abdominal pain 1 (1.2) 0 2 (6.9) 0.307 1 (0.7) 1 (3.0) 0 0.302 Nausea or vomiting 1 (1.2) 0 0 1.000 2 (1.3) 0 1 (2.5) 0.692 Oliguria 0 0 0 1 (0.7) 0 0 1.000 Disturbance of consciousness 0 0 0 9 (5.9) 2 (6.1) 0 0.288 Abnormal respiratory rate, beats/min 51/66 (77.3) 3/5 (60.0) 23/24 (95.8) 0.047 55/150 (36.7) 11/31 (35.5) 16/36 (44.4) 0.829 White blood cell count, ×109/L 10.6 (7.9–13.3) 8.4 (7.3–15.6) 10.2 (7.6–15.6) 0.538 7.6 (7.2–12.5) 9.4 (5.9–12.2) 9.3 (6.2–12.0) 0.497 < 4 2/75 (2.7) 0/6 1/26 (3.8) 1.000 2/142 (1.4) 2/31 (6.5) 3/38 (7.9) 0.054 4–10 31/75 (41.3) 5/6 (83.3) 12/26 (46.2) 75/142 (52.8) 16/31 (51.6) 19/38 (50) ≥ 10 42/75 (56) 1/6 (16.7) 13/26 (50) 65/142 (45.8) 13/31 (41.9) 16/38 (42.1) Lymphocyte count, ×109/L 22.8 (17.1–37.3) 29.1 (23.2–35.7) 25.2 (15.3–50.3) 0.742 12.9 (9.3–19.2) 14.7 (6.6–22.9) 12.4 (8.8–22.5) 0.652 < 20 26/71 (36.6) 0/6 12/26 (46.2) 0.109 101/133 (75.9) 18/31 (58.1) 25/37 (67.6) 0.115 20–40 29/71 (40.8) 5/6 (83.3) 5/26 (19.2) 30/133 (22.6) 11/31 (35.5) 9/37 (24.3) > 40 16/71 (22.5) 1/6 (16.7) 9/26 (34.6) 2/133 (1.5) 2/31 (6.5) 3/37 (8.1) Neutrophil proportion, % 67.3 (51.0–74.4) 61.0 (54.0–66.9) 67.7 (40.6–77.9) 0.768 78.9 (70.0–84.3) 75.1 (65.4–87.3) 80.0 (66.83–85) 0.683 < 50 17/72 (23.6) 1/6 (16.7) 9/26 (34.6) 0.535 4/135 (3.0) 2/31 (6.5) 3/38 (7.9) 0.219 50–69 23/72 (31.9) 4/6 (66.7) 4/26 (15.4) 29/135 (21.5) 8/31 (25.8) 10/38 (26.3) ≥ 70 32/72 (44.4) 1/6 (16.7) 13/26 (50.0) 102/135 (75.6) 21/31 (67.7) 25/38 (65.8) Platelet count, ×109/L 278 (232–342) 285 (175–412) 260 (200–307) 0.387 209 (176–253) 207 (160–265) 226 (171–283) 0.686 < 100 0/67 0/4 0/23 3/131 (2.3) 1/28 (3.6) 1/35 (2.9) 0.811 Creatinine, µmol/L 24.6 (22.0–31.5) – 27.0 (23.0–37.1) 0.482 68.7 (60.0–93.0) 72.0 (55.0–130.5) 65.7 (59.5–105) 0.814 > 133 0/25 0/2 0/14 5/64 (7.8) 6/24 (25.0) 1/23 (4.3) 0.061 Blood urea nitrogen, mmol/L 3.2 (2.3–4.2) – 2.6 (2.3–4.2) 0.839 5.8 (4.4–8.3) 6.8 (4.9–14.5) 5.7 (3.4–8.8) 0.271 ≥ 7.14 2/26 (7.7) 0/2 1/15 (6.7) 1.000 18/61 (29.5) 11/25 (44.0) 9/22 (40.9) 0.362 Alanine aminotransferase, U/L 22.0 (14.0–31.2) – 14.0 (12.0–20.0) 0.13 15.0 (10.0–24.5) 14.0 (9.0–24.0) 17.0 (11.0–29.0) 0.504 > 40 4/26 (15.4) 0/2 1/15 (6.7) 0.713 6/61 (9.7) 3/25 (12) 0/25 0.188 Aspartate aminotransferase, U/L 26.5 (20.8–46.0) – 29.0 (26.0–46.0) 0.413 19.0 (15.0–28.0) 20.0 (13.0–25.0) 21.0 (14.3–28.0) 0.959 > 40 8/26 (30.8) 0/2 4/15 (26.7) 1.000 5/61 (8.2) 5/25 (20) 1/24 (4.2) 0.212 Creatine kinase, U/L 81.0 (59.5–136.5) – 63.0 (51.0–87.0) 0.119 69.0 (42.3–147.5) 79.0 (32.0–109.5) 53 (36.5–148.5) 0.712 > 200 5/25 (20) 0/2 1/15 (6.7) 0.547 6/56 (10.7) 2/25 (8) 3/21 (14.3) 0.830 Creatine kinase MB fraction, U/L 18.0 (12.0–28.0) – 18.0 (16.0–25.0) 0.965 11.0 (7.0–15.0) 7.0 (4.3–14.3) 11.5 (5.5–19.5) 0.326 > 25 9/25 (36) 0/2 2/15 (13.3) 0.203 7/55 (12.7) 2/24 (8.3) 3/20 (15.0) 0.843 The arterial partial pressure of oxygen 94.0 (49.0–108.0) – – 81.0 (63.5–95.8) 70.5 (62.8–90) 70.0 (66.3–87.5) 0.404 Saturation of arterial blood oxygen, % 96.0 (87.3–99.0) – – 95.3 (92.2–98) 95.0 (91.2–97.0) 95.0 (92.0–97.0) 0.626 < 90 2/7 (28.6) – – 5/54 (9.3) 1/21 (4.8) 0/22 0.400 Oxygen therapy 9 (11) 1 (14.3) 5 (17.2) 0.557 51 (33.3) 20 (60.1) 21 (52.5) 0.004 Mechanical ventilation 4 2 2 0.090 12 (7.8) 7 (21.2) 1 (2.5) 0.019 Noninvasive 4 (4.9) 1 (14.3) 1 (3.4) 0.214 5 (3.3) 3 (9.1) 1 (2.5) 0.807 Invasive 0 1 (14.3) 1 (3.4) 7 (4.6) 4 (12.1) 0 Extracorporeal Membrane Oxygenation, ECMO 0 0 0 1 (0.7) 0 0 1.000 Complications 0 0 4 (13.8) 0.005 15 (9.8) 9 (27.3) 8 (20) 0.017 ICU admission 0 1 (14.3) 1 (3.4) 0.032 8 (5.2) 7 (21.2) 5 (12.5) 0.009 Discharge from hospital 82/82 (100) 7/7 (100) 29/29 (100) 153/153 (100) 29/33 (87.9) 40/40 (100) <0.001 Death in hospital 0 0 0 0 4 (12.1) 0 Hospital length of stay (days) 7.0 (5–8) – 7.0 (5.5–14) 0.667 10.0 (8.0–16.0) 10.5 (8.5–16.8) 14 (10–17) 0.316 Time from illness onset to discharge (days) 11.0 (7.8–16.3) – 11.
0(7.5–16.5)0.804 15.0 (11.0–24.0) 16.0
(13.0–22.0)20.5 (15.8–38) 0.108 Time from illness onset to death (days) – – – – 18.5 (6.8–42.3) – Note. Data were represented as n, n (%), mean (range).  下载: 导出CSV
Table 2. Co-infection with other respiratory virus or Mycoplasma pneumoniae among HRV-infected 461 patients
Pathogen Children A = 82 B = 7 C = 29 Untype = 29 Total 147 Adult A = 165 B = 35 C = 41 Untype = 73 Total 314 Case with co-infection 14 1 8 11 34 16 7 18 14 55 Flu 0 0 0 0 0 2 0 4 2 8 CoV 1 0 1 0 2 3 1 1 3 8 PIV 3 0 1 4 8 5 0 1 1 7 RSV 0 0 1 0 1 0 0 0 1 1 AdV 1 0 1 1 3 0 0 0 0 0 MP 3 1 2 1 7 1 5 0 2 8 CP 0 0 0 1 1 0 0 0 0 0 HMPV 1 0 0 0 1 1 0 0 2 3 EV 5 0 6 3 14 4 1 13 3 21 BoV 1 0 0 1 2 1 0 0 0 1 Total 15 1 12 11 39 17 7 19 14 57 The rate of co-infection (%) 18.2 14.3 41.4 37.9 26.5 10.3 20.0 46.3 19.2 18.2 Note. Flu, influenza virus; PIV, parainfluenza virus; RSV, respiratorysyncytial virus; RV, human rhinovirus; AdV, humanadenovirus; BoV, human bocavirus; HMPV, humanmetapneumovirus; CoV, human coronavirus; EV, enterovirus; MP, Mycoplasma pneummoniae; CP, Chlamydia pneumoniae.
下载: 导出CSV
-
[1] Heinonen S, Jartti T, Garcia C, et al. Rhinovirus detection in symptomatic and asymptomatic children: value of host transcriptome analysis. Am J Respir Crit Care Med, 2016; 193, 772−82. doi: 10.1164/rccm.201504-0749OC [2] Price WH. The isolation of a new virus associated with respiratory clinical disease in humans. Proc Natl Acad Sci USA, 1956; 42, 892−6. doi: 10.1073/pnas.42.12.892 [3] Esneau C, Duff AC, Bartlett NW. Understanding rhinovirus circulation and impact on illness. Viruses, 2022; 14, 141. doi: 10.3390/v14010141 [4] Palmenberg AC, Spiro D, Kuzmickas R, et al. Sequencing and analyses of all known human rhinovirus genomes reveal structure and evolution. Science, 2009; 324, 55−9. doi: 10.1126/science.1165557 [5] Castañeda-Ribeyro A, Martins-Luna J, Verne E, et al. High prevalence and clinical characteristics of respiratory infection by human rhinovirus in children from Lima-Peru during years 2009-2010. PLoS One, 2022; 17, e0271044. doi: 10.1371/journal.pone.0271044 [6] Jacobs SE, Lamson DM, St. George K, et al. Human rhinoviruses. Clin Microbiol Rev, 2013; 26, 135−62. doi: 10.1128/CMR.00077-12 [7] Hung HM, Yang SL, Chen CJ, et al. Molecular epidemiology and clinical features of rhinovirus infections among hospitalized patients in a medical center in Taiwan. J Microbiol Immunol Infect, 2019; 52, 233−41. doi: 10.1016/j.jmii.2018.08.009 [8] Su YT, Lin YT, Yang CC, et al. High correlation between human rhinovirus type C and children with asthma exacerbations in Taiwan. J Microbiol Immunol Infect, 2020; 53, 561−8. doi: 10.1016/j.jmii.2018.12.001 [9] Howard LM, Johnson M, Gil AI, et al. Molecular epidemiology of rhinovirus detections in young children. Open Forum Infect Dis, 2016; 3, ofw001. doi: 10.1093/ofid/ofw001 [10] Fawkner-Corbett DW, Khoo SK, Duarte CM, et al. Rhinovirus-C detection in children presenting with acute respiratory infection to hospital in Brazil. J Med Virol, 2016; 88, 58−63. doi: 10.1002/jmv.24300 [11] Golke P, Hönemann M, Bergs S, et al. Human rhinoviruses in adult patients in a tertiary care hospital in Germany: molecular epidemiology and clinical significance. Viruses, 2021; 13, 2027. doi: 10.3390/v13102027 [12] Zlateva KT, van Rijn AL, Simmonds P, et al. Molecular epidemiology and clinical impact of rhinovirus infections in adults during three epidemic seasons in 11 European countries (2007-2010). Thorax, 2020; 75, 882−90. doi: 10.1136/thoraxjnl-2019-214317 [13] Martin EK, Kuypers J, Chu HY, et al. Molecular epidemiology of human rhinovirus infections in the pediatric emergency department. J Clin Virol, 2015; 62, 25−31. doi: 10.1016/j.jcv.2014.11.006 [14] Faleye TOC, Elyaderani A, Skidmore P, et al. Surveillance of rhinovirus diversity among a university community identifies multiple types from all three species including an unassigned rhinovirus A genotype. Influenza Other Respir Viruses, 2023; 17, e13057. doi: 10.1111/irv.13057 [15] Kim HM, Lee EJ, Lee NJ, et al. Impact of coronavirus disease 2019 on respiratory surveillance and explanation of high detection rate of human rhinovirus during the pandemic in the Republic of Korea. Influenza Other Respir Viruses, 2021; 15, 721−31. doi: 10.1111/irv.12894 [16] Huang HH, Chen SQ, Zhang XY, et al. Detection and clinical characteristics analysis of respiratory viruses in hospitalized children with acute respiratory tract infections by a GeXP-based multiplex-PCR assay. J Clin Lab Anal, 2020; 34, e23127. doi: 10.1002/jcla.23127 [17] Lei C, Yang LS, Lou CT, et al. Viral etiology and epidemiology of pediatric patients hospitalized for acute respiratory tract infections in Macao: a retrospective study from 2014 to 2017. BMC Infect Dis, 2021; 21, 306. doi: 10.1186/s12879-021-05996-x [18] Zhao YJ, Shen J, Wu BJ, et al. Genotypic diversity and epidemiology of human rhinovirus among children with severe acute respiratory tract infection in Shanghai, 2013-2015. Front Microbiol, 2018; 9, 1836. doi: 10.3389/fmicb.2018.01836 [19] Respiratory Group of Pediatric Branch of Chinese Medical Association, Editorial Committee of Chinese Journal of Pediatrics. Guidelines for management of community acquired pneumonia in children(the revised edition of 2013) (II). Chin J Pediat, 2013; 51, 856-62. (In Chinese) [20] Cao B, Huang Y, She DY, et al. Diagnosis and treatment of community-acquired pneumonia in adults: 2016 clinical practice guidelines by the Chinese Thoracic Society, Chinese Medical Association. Clin Respir J, 2018; 12, 1320−60. doi: 10.1111/crj.12674 [21] Wisdom A, Leitch ECW, Gaunt E, et al. Screening respiratory samples for detection of human rhinoviruses (HRVs) and enteroviruses: comprehensive VP4-VP2 typing reveals high incidence and genetic diversity of HRV species C. J Clin Microbiol, 2009; 47, 3958−67. doi: 10.1128/JCM.00993-09 [22] Bochkov YA, Grindle K, Vang F, et al. Improved molecular typing assay for rhinovirus species A, B, and C. J Clin Microbiol, 2014; 52, 2461−71. doi: 10.1128/JCM.00075-14 [23] Zhao M, Zhu WJ, Qian Y, et al. Association of different human rhinovirus species with asthma in children: a preliminary study. Chin Med J (Engl), 2016; 129, 1513−8. doi: 10.4103/0366-6999.184463 [24] Li ZJ, Zhang HY, Ren LL, et al. Etiological and epidemiological features of acute respiratory infections in China. Nat Commun, 2021; 12, 5026. doi: 10.1038/s41467-021-25120-6 [25] Luo Q, Li MZ, Li AH, et al. Genetic diversity and epidemiological features of respiratory syncytial virus, Beijing, 2015-2019: a multicenter and all-age groups study. J Infect, 2022; 85, 75−85. doi: 10.1016/j.jinf.2022.04.046 [26] Shen LY, Gong C, Xiang ZC, et al. Upsurge of enterovirus D68 and circulation of the new subclade D3 and subclade B3 in Beijing, China, 2016. Sci Rep, 2019; 9, 6073. doi: 10.1038/s41598-019-42651-7 [27] Müller L, Mack I, Tapparel C, et al. Human rhinovirus types and association with respiratory symptoms during the first year of life. Pediatr Infect Dis J, 2015; 34, 907−9. doi: 10.1097/INF.0000000000000758 [28] Tran DN, Trinh QD, Pham NTK, et al. Human rhinovirus infections in hospitalized children: clinical, epidemiological and virological features. Epidemiol Infect, 2016; 144, 346−54. doi: 10.1017/S0950268815000953 [29] Liu J, Zhao HW, Feng ZH, et al. A severe case of human rhinovirus A45 with central nervous system involvement and viral sepsis. Virol J, 2022; 19, 72. doi: 10.1186/s12985-022-01799-x [30] Giardina FAM, Piralla A, Ferrari G, et al. Molecular epidemiology of rhinovirus/enterovirus and their role on cause severe and prolonged infection in hospitalized patients. Microorganisms, 2022; 10, 755. doi: 10.3390/microorganisms10040755 [31] Yan FG, Xiao Y, Li MK, et al. Metagenomic analysis identified human rhinovirus B91 infection in an adult suffering from severe pneumonia. Am J Respir Crit Care Med, 2017; 195, 1535−6. doi: 10.1164/rccm.201609-1908LE [32] Jain S, Self WH, Wunderink RG, et al. Community-acquired pneumonia requiring hospitalization among U. S. adults. N Engl J Med, 2015; 373, 415−27. doi: 10.1056/NEJMoa1500245 -

 点击查看大图
计量
- 文章访问数: 1255
- HTML全文浏览量: 563
- PDF下载量: 89
- 被引次数: 0

 Quick Links