

 下载:
下载:

-
Obesity is a complex multifactorial disease that poses a significant and growing threat to global health. The prevalence of obesity continues to increase worldwide, making it a critical public health concern[1]. Atherosclerotic cardiovascular disease is the leading cause of mortality and morbidity and imposes a heavy economic and social burden worldwide[2]. Substantial clinical and epidemiological evidence has demonstrated a strong correlation between obesity and increased risk of cardiovascular disease (CVD) incidence and mortality[3,4].
The association between obesity and CVD Involves multifaceted pathophysiological mechanisms. Obesity increases the cardiac workload and releases pro-inflammatory cytokines and adipokines, contributing to endothelial dysfunction. Chronic obesity also induces metabolic disturbances, including insulin resistance, dyslipidemia, and hyperglycemia—all established CVD risk factors[5,6].
The interplay among obesity, hyperlipidemia, and insulin resistance activates systemic inflammation and induces endothelial dysfunction, which accelerates the progression of atherosclerotic plaque formation. These pathophysiological changes significantly increase the prevalence and mortality risk of CVD[7].
The hyperinsulinemic-euglycemic clamp test is recognized as the laboratory gold standard method for diagnosing insulin resistance. However, owing to the simplicity, accessibility, non-invasive nature, and low cost of the triglyceride-glucose (TyG) index, it is frequently utilized as a surrogate marker for insulin resistance in large-scale studies. Evidence from relevant research has demonstrated that the TyG index possesses high sensitivity and specificity, further supporting its application in epidemiological investigations[8,9]. Additionally, free fatty acids (FFAs) directly reflect lipid mobilization driven by adipose tissue and disturbances in glucose metabolism, providing a complementary perspective on metabolic disorders[10,11].
To date, the combined predictive value of FFA and the TyG index for adverse outcomes in coronary artery disease (CAD) patients, particularly in the context of obesity, remains unexplored. This study addresses this gap by assessing independent and synergistic contributions to major adverse cardiovascular and cerebrovascular events (MACCE) risk stratification.
-
This study utilized data from the pRospective Observational Multicenter cohort for Ischemic and hEmorrhage risk in CAD patients (the PROMISE cohort), which enrolled 18,701 hospitalized patients across nine centers in China between January 2015 and May 2019. Inclusion criteria included patients aged ≥ 18 years with a confirmed diagnosis of CAD and an indication for at least one antiplatelet drug. The exclusion criteria were life expectancy of less than 6 months and current participation in another interventional clinical trial.
The treatment strategy followed contemporary guidelines, and decisions were jointly made by clinicians and patients. The choice between percutaneous coronary intervention (PCI) and coronary artery bypass grafting (CABG) was determined by a multidisciplinary heart team, including experienced cardiologists and surgeons, while considering patient preferences. Coronary angiography and other interventional procedures were performed by experienced interventional cardiologists. Secondary prevention medications were prescribed in accordance with the guideline recommendations, except in cases of contraindications.
The PROMISE cohort adhered to the principles of the Declaration of Helsinki and was approved by the Ethics Committee of Fuwai Hospital (Protocol codes: 2013-449, approved on September 4, 2013, and No. 2017-860, approved on January 10, 2017). Written informed consent was obtained from all the participants.
-
Clinical data were extracted from the hospitalization records and included diagnoses, clinical features, laboratory test results, medications, and details of coronary revascularization.
Demographic data included sex, age, smoking history, comorbidities, and other relevant factors. Hypertension was defined as a resting systolic blood pressure ≥ 140 mmHg or diastolic blood pressure ≥ 90 mmHg on different days, use of antihypertensive medications, or a self-reported history of hypertension. Diabetes mellitus (DM) was defined by fasting blood glucose (FBG) ≥ 7.0 mmol/L, 2-hour postprandial plasma glucose ≥ 11.1 mmol/L, glycosylated hemoglobin (HbA1c) ≥ 6.5%, or any use of glucose-lowering medications, or self-reported diabetes history.
Blood samples were collected after 8–12 hours of fasting. FBG levels were measured using the hexokinase/glucose-6-phosphate dehydrogenase method, and HbA1c was analyzed with an automated glycosylated hemoglobin analyzer (Tosoh HLC-723G8, Tokyo, Japan). Lipid profiles, including FFA and triglycerides, were determined using an automated biochemical analyzer (Hitachi 7150, Tokyo, Japan).
-
Insulin resistance was evaluated using the TyG index, calculated as Ln [fasting triglyceride (mg/dL) × FBG (mg/dL) ÷ 2][12]. Obesity was assessed using body mass index (BMI), calculated as weight (kg) divided by height squared (m2). Obesity was defined as BMI ≥ 25 kg/m2, according to the World Health Organization (WHO) Asian criteria[13].
-
The primary endpoint was MACCE, a composite of all-cause death, nonfatal myocardial infarction (MI), any revascularization, and stroke. The secondary endpoints included each MACCE component. MI was diagnosed according to the Fourth Universal Definition of Myocardial Infarction[14]. Any revascularization included PCI or CABG driven by ischemic symptoms or events. Stroke included ischemic and hemorrhagic strokes according to the World Health Organization classification of diseases[15].
Follow-up was conducted through in-person clinic visits or telephone interviews, with a median follow-up time of 2 years, to document MACCE occurrence. All endpoints were centrally adjudicated by two independent cardiologists, and any disagreements were resolved by consensus.
-
Continuous variables were summarized as mean ± standard deviation for normally distributed data or as median (interquartile range) for skewed data. Categorical variables were presented as frequency and percentage. Baseline differences in continuous variables were compared using analysis of variance or the Kruskal–Wallis test, while categorical variables were analyzed using the chi-squared test or Fisher’s exact test, as appropriate.
To assess the potential nonlinear relationships between FFA, TyG index, and MACCE, we fitted a restricted cubic spline (RCS) model with four knots placed at the 5th, 35th, 65th, and 95th percentiles of its distribution. Additionally, a causal mediation analysis based on the Cox proportional hazards regression model was conducted to explore whether insulin resistance mediates the relationship between FFA and cardiovascular events. In this analysis, FFA (continuous) was treated as the exposure, TyG (continuous) as the mediator, and MACCE as the outcome variable.
The optimal cutoff values for the TyG index (9.05) and FFA level (0.81 mmol/L) were determined using receiver operating characteristic curve analysis based on the maximum Youden index for MACCE. The patients were then stratified into four groups according to these thresholds (Low-/High-FFA and Low-/High-TyG). Kaplan–Meier survival curves were generated for each group and compared using the log-rank test.
Cox proportional hazards models were constructed to evaluate the independent associations of FFA and TyG index with clinical endpoints, as well as their interaction effects, while adjusting for key covariates. Hazard ratios (HRs) and 95% confidence intervals (cIs) were calculated. Stratified analyses were conducted across the TyG index tertiles in patients with or without hyper-FFA. A post hoc power analysis was performed using G*Power software (version 3.1) for the omnibus test of differences among the four groups across secondary endpoints. The analysis was based on the observed effect size (Cohe’'s f), a significance level of α = 0.05, and the total sample size (N = 5,887).
All statistical analyses and visualizations were performed using R software version 4.3.2 (R Foundation for Statistical Computing, Vienna, Austria) and SPSS version 26.0 (IBM Corp., Armonk, NY, USA). A two-tailed P-value < 0.05 was considered statistically significant.
-
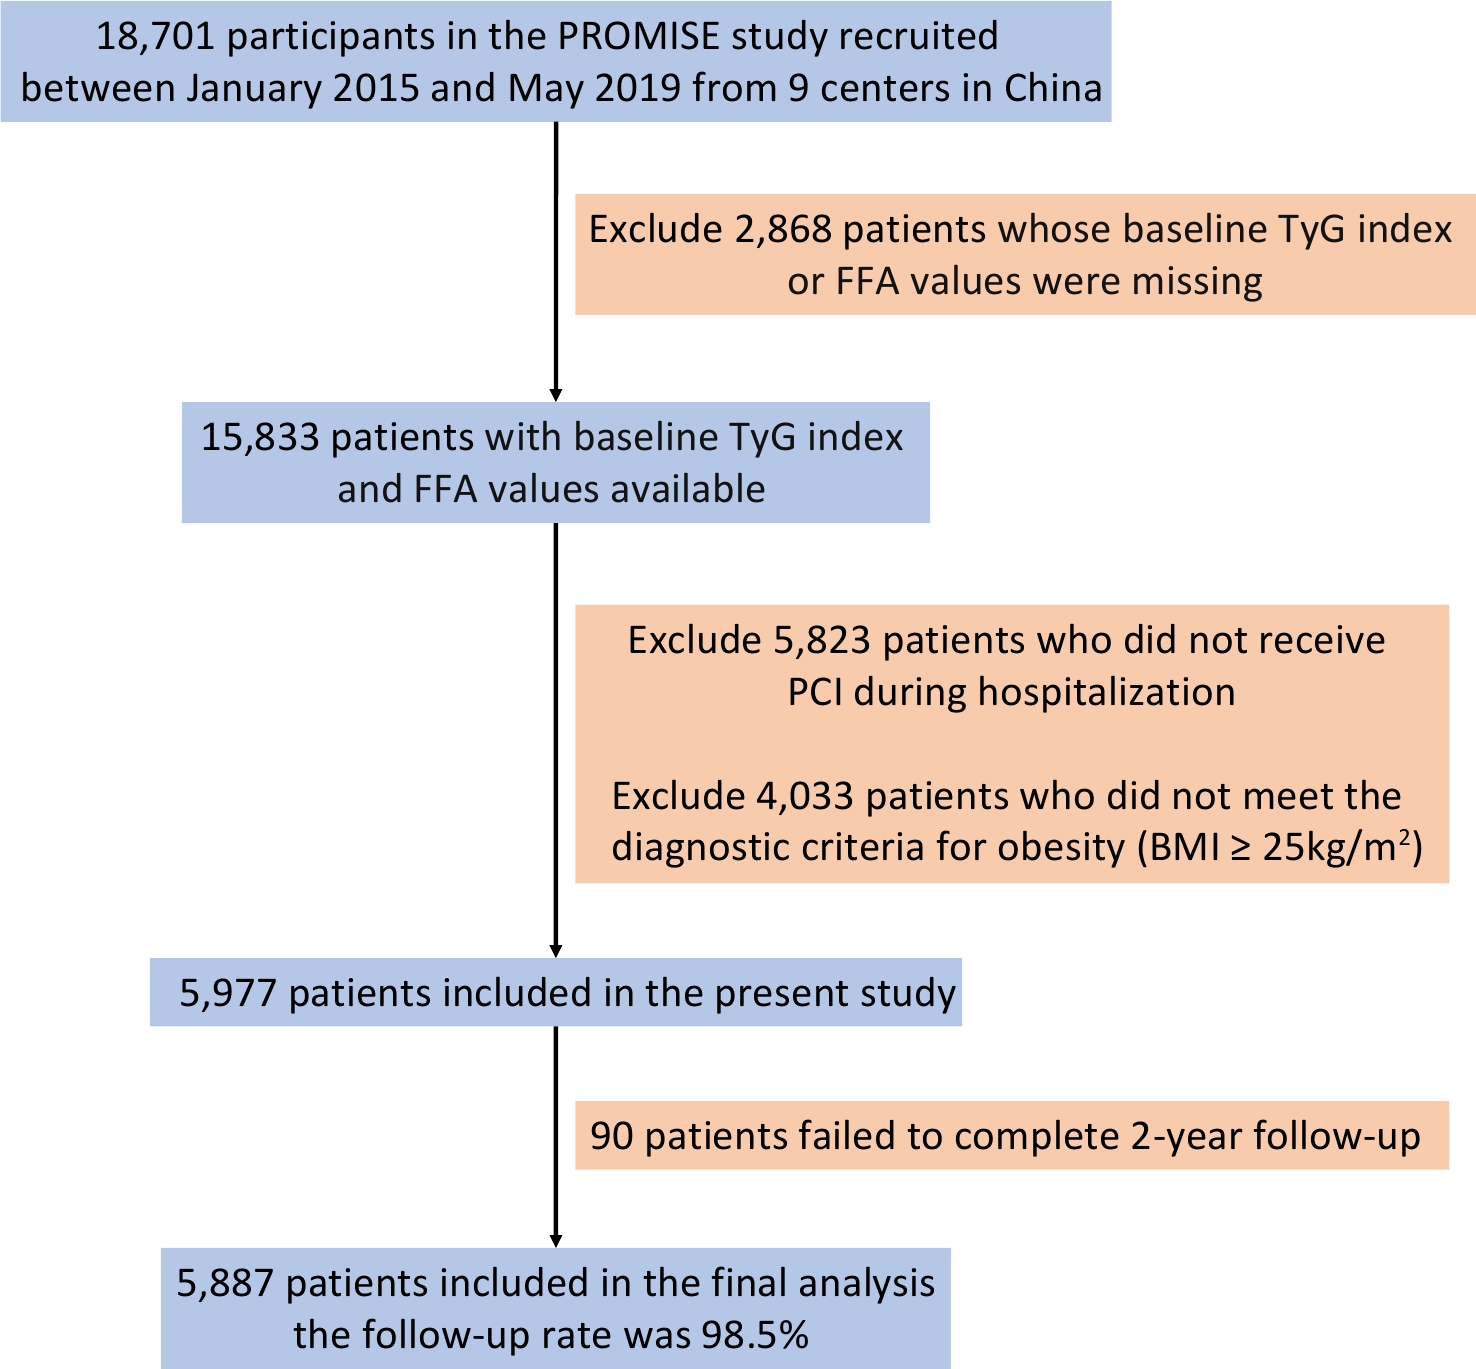
A total of 5,887 patients met the inclusion criteria and comprised the final study population (Figure 1). Baseline characteristics categorized as Low-/High-FFA and Low-/High-TyG are presented in Table 1. Overweight or obese patients with outcome events were older, had more comorbidities, exhibited greater glucose and lipid metabolism disorders, and were more frequently diagnosed with acute coronary syndrome, heart failure with reduced ejection fraction, and complex coronary lesions as indicated by higher SYNTAX scores.
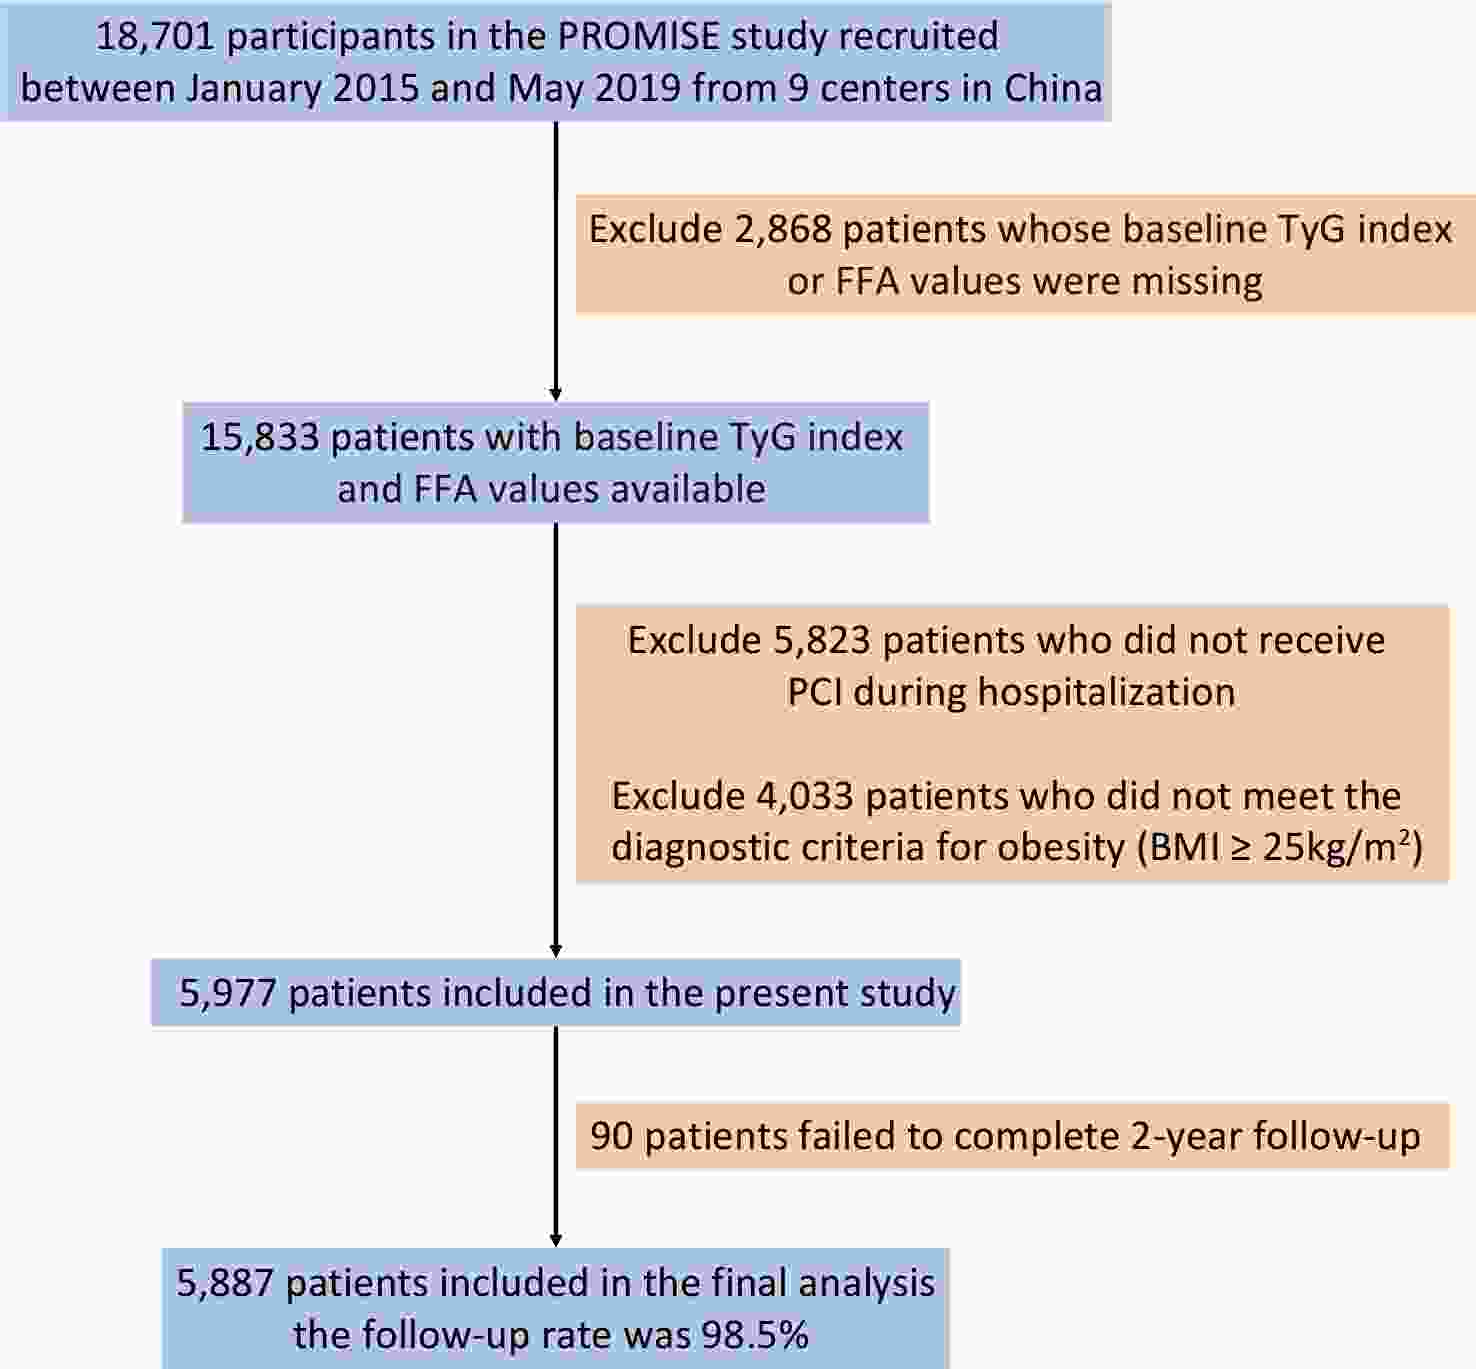
Figure 1. Study Flowchart.
Table 1. Baseline Characteristics of patients
Variables Total
n = 5,887L-FFA/L-TyG
n = 2,847L-FFA/H-TyG
n = 586H-FFA/L-TyG
n = 1,806H-FFA/H-TyG
n = 648P value Age, y 58.6 ± 10.5 59.2±10.4 60.1 ± 11.1 57.7 ± 10.0 57.3 ± 11.4 < 0.001 Male 4,706 (79.9%) 2,327 (81.7%) 449 (76.6%) 1,455 (80.6%) 475 (73.3%) < 0.001 Acute Coronary Syndrome 2,697 (45.8%) 1,003 (35.2%) 434 (74.1%) 755 (41.8%) 505 (77.9%) < 0.001 Prior Myocardial Infartion 954 (16.2%) 474 (16.6%) 68 (11.6%) 322 (17.8%) 90 (13.9%) 0.001 Three-vessel Disease 2,565 (43.6%) 1,162 (40.8%) 240 (41.0%) 862 (47.7%) 301 (46.5%) < 0.001 Hypertension 4,046 (68.7%) 1,954 (68.6%) 415 (70.8%) 1,220 (67.6%) 457 (70.5%) 0.342 Diabetes Mellitus 2,774 (47.1%) 1,020 (35.8%) 198 (33.8%) 1,133 (62.7%) 423 (65.3%) < 0.001 Chronic Kidney Disease 101 (1.7%) 39 (1.4%) 15 (2.6%) 39 (2.2%) 8 (1.2%) 0.058 Cerebrovascular Diseases 858 (14.6%) 420 (14.8%) 91 (15.5%) 237 (13.1%) 110 (17.0%) 0.087 PVD 284 (4.8%) 144 (5.1%) 28 (4.8%) 82 (4.5%) 30 (4.6%) 0.870 Prior PCI 1,383 (23.5%) 686 (24.1%) 117 (20.0%) 459 (25.4%) 121 (18.7%) 0.001 Prior CABG 97 (1.6%) 42 (1.5%) 8 (1.4%) 42 (2.3%) 5 (0.8%) 0.029 Smoking history 3,616 (61.4%) 1,738 (61.0%) 344 (58.7%) 1,139 (63.1%) 395 (61.0%) 0.249 HFrEF 158 (2.7%) 61 (2.1%) 22 (3.8%) 42 (2.3%) 33 (5.1%) < 0.001 Successful PCI 5,795 (98.4%) 2,802 (98.4%) 580 (99.0%) 1,773 (98.2%) 640 (98.8%) 0.273 Baseline SYNTAX score 12.0 (7.0,18.0) 11.0 (7.0,17.5) 12.0 (8.0,18.5) 12.0 (7.0,18.5) 13.8 (8.5,20.5) < 0.001 Residual SYNTAX score 3.0 (0,7.0) 2.0 (0,7.0) 2.8 (0,7.0) 3.0 (0,7.5) 3.0 (0,8.0) < 0.001 TyG index 9.0 ± 0.6 8.6 ± 0.3 8.6 ± 0.4 9.5 ± 0.4 9.7 ± 0.5 < 0.001 FFA, mmol/L 0.5 (0.4,0.7) 0.5 (0.3,0,6) 1.0 (0.9,1.4) 0.5 (0.4,0.6) 1.1 (0.9,1.5) < 0.001 LDL-C, mmol/L 2.5 ± 0.9 2.3 ± 0.8 2.7 ± 0.9 2.6 ± 0.9 3.0 ± 0.9 < 0.001 Lpa, mg/dL 17.7 (7.9,40.5) 19.8 (8.7,46.6) 18.0 (9.2,38.6) 15.8 (6.8,36.2) 15.9 (7.3,35.2) < 0.001 Medications Aspirin 5,740 (97.5%) 2,769 (97.3%) 570 (97.3%) 1,768 (97.9%) 633 (97.7%) 0.403 Clopidogrel 4,610 (78.3%) 2,340 (82.2%) 402 (68.6%) 1,434 (79.4%) 434 (67.0%) < 0.001 Ticagrelor 1,470 (25.0%) 576 (20.2%) 218 (37.2%) 448 (24.8%) 228 (35.2%) < 0.001 CCB 2,543 (43.2%) 1,345 (47.2%) 201 (34.3%) 797 (44.1%) 200 (30.9%) < 0.001 ACEI/ARB 3,471 (59.0%) 1,586 (55.7%) 401 (68.4%) 1,038 (57.5%) 446 (68.8%) < 0.001 Statins 5,672 (96.3%) 2,756 (96.8%) 559 (95.4%) 1,738 (96.2%) 619 (95.5%) 0.207 Note. PVD: Peripheral Vascular Disease; PCI: Percutaneous Coronary Intervention; CABG: Coronary Artery Bypass Graft; HFrEF: Heart Failure with reduced Ejection Fraction; SYNTAX score: the Synergy Between Percutaneous Coronary Intervention with Taxus and Cardiac Surgery score; TyG: Triglyceride-Glucose index; FFA: Free Fatty Acid; LDL-C: Low Density Lipoprotein C; Lpa: Lipoprotein a; CCB: Calcium Channel Blocker; ACEI/ARB: Angiotensin-Converting Enzyme Inhibitor/ Angiotensin Receptor Blocker. -
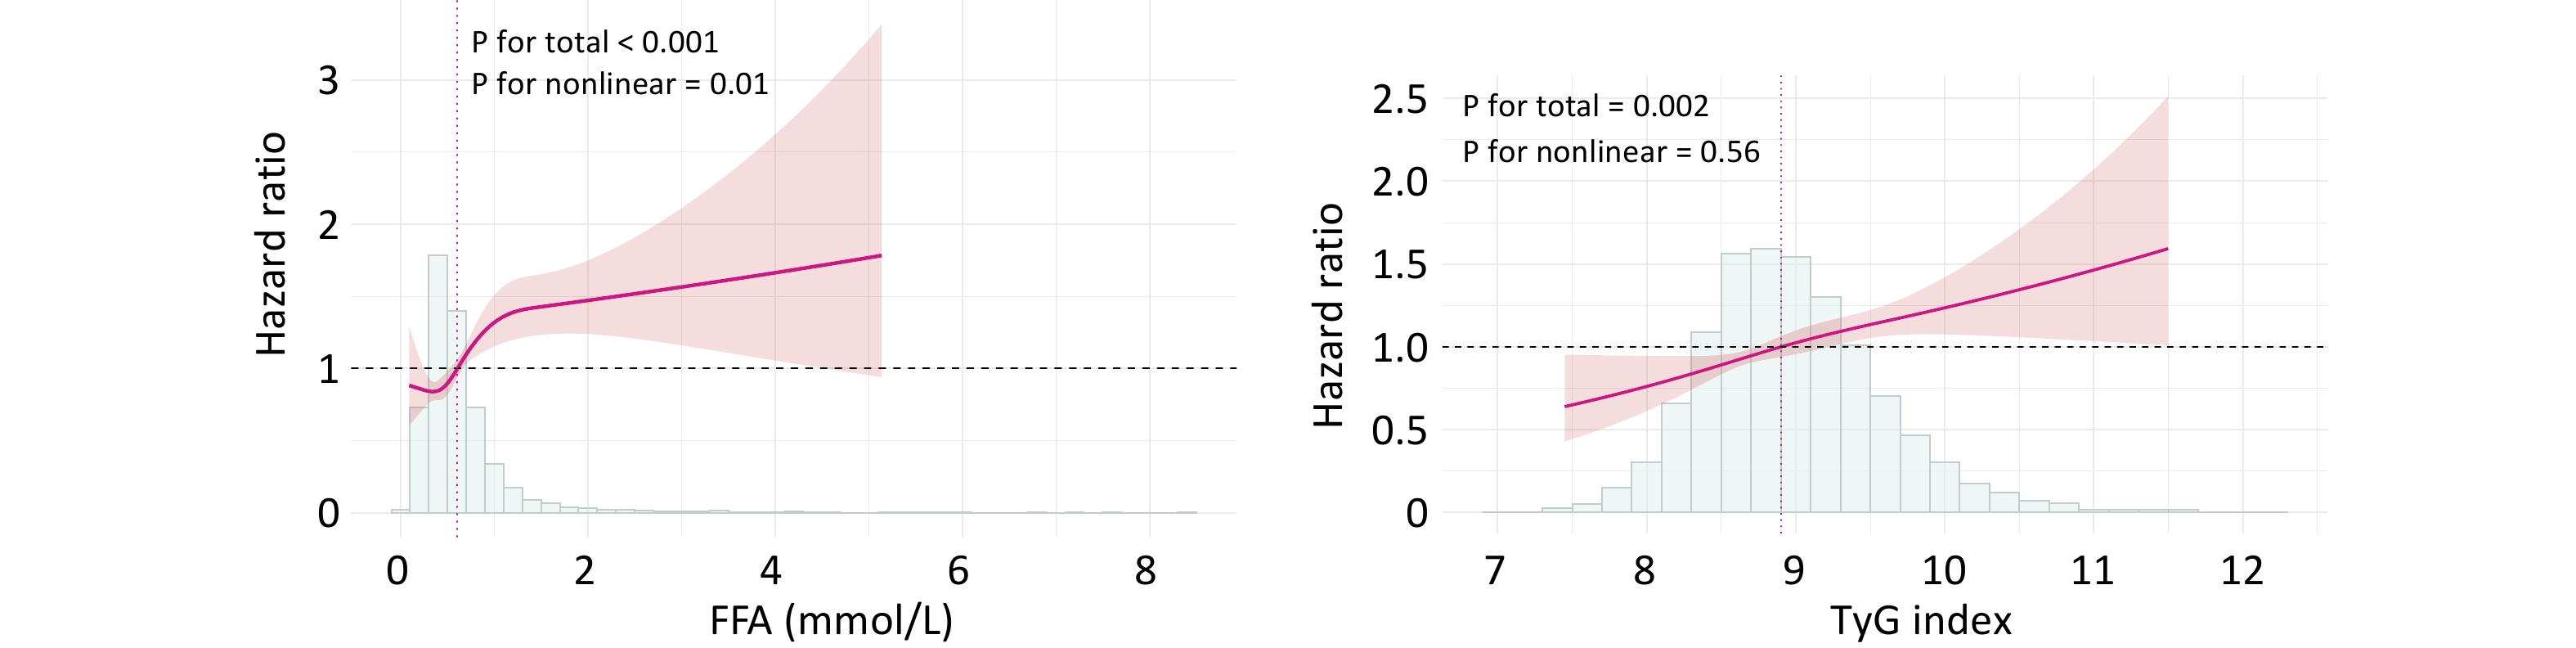
In the overall cohort, both FFA and the TyG index were independent predictors of MACCE when analyzed as continuous or binary variables based on the optimal thresholds (Table 2). The RCS curve illustrated a nonlinear J-shaped association between FFA and MACCE (P for nonlinearity = 0.01), whereas the TyG index demonstrated a linear relationship with outcomes (P for nonlinearity = 0.56; Figure 2).
Table 2. Independent Associations of FFA and TyG Index With MACCE
Crude HR (95% CI) P Adjusted HR (95% CI) P FFA 1.246 (1.123–1.383) < 0.001 1.212 (1.076–1.364) 0.002 FFA < 0.81mmol/l Reference FFA ≥ 0.81 mmol/l 1.624 (1.366–1.931) < 0.001 1.492 (1.239–1.795) < 0.001 TyG 1.250 (1.104–1.416) < 0.001 1.251 (1.092–1.434) 0.001 TyG < 9.05 Reference TyG ≥ 9.05 1.298 (1.109–1.521) 0.001 1.273 (1.077–1.506) 0.005 Note. multivariable factors: gender, age, hypertension, diabetes mellitus, smoking, acute coronary syndrome, cerebrovascular diseases, chronic kidney disease, baseline SYNTAX scores; 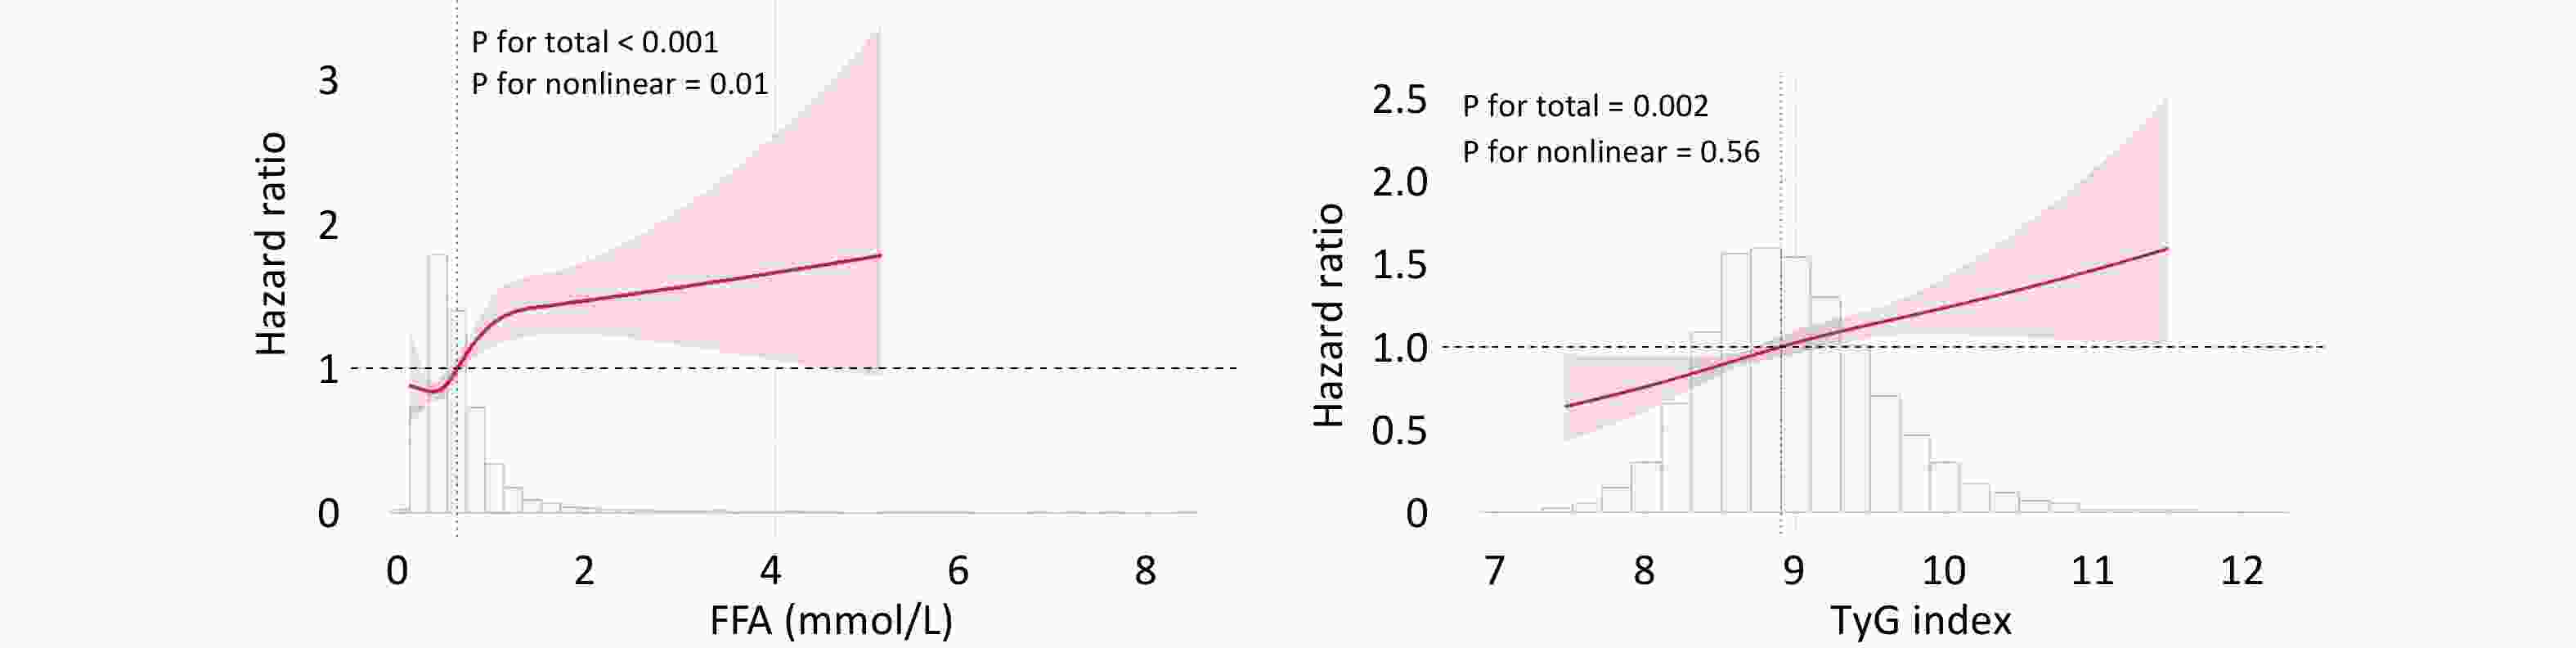
Figure 2. Restricted Cubic Spline Analysis for Cox Proportional Hazards Model.
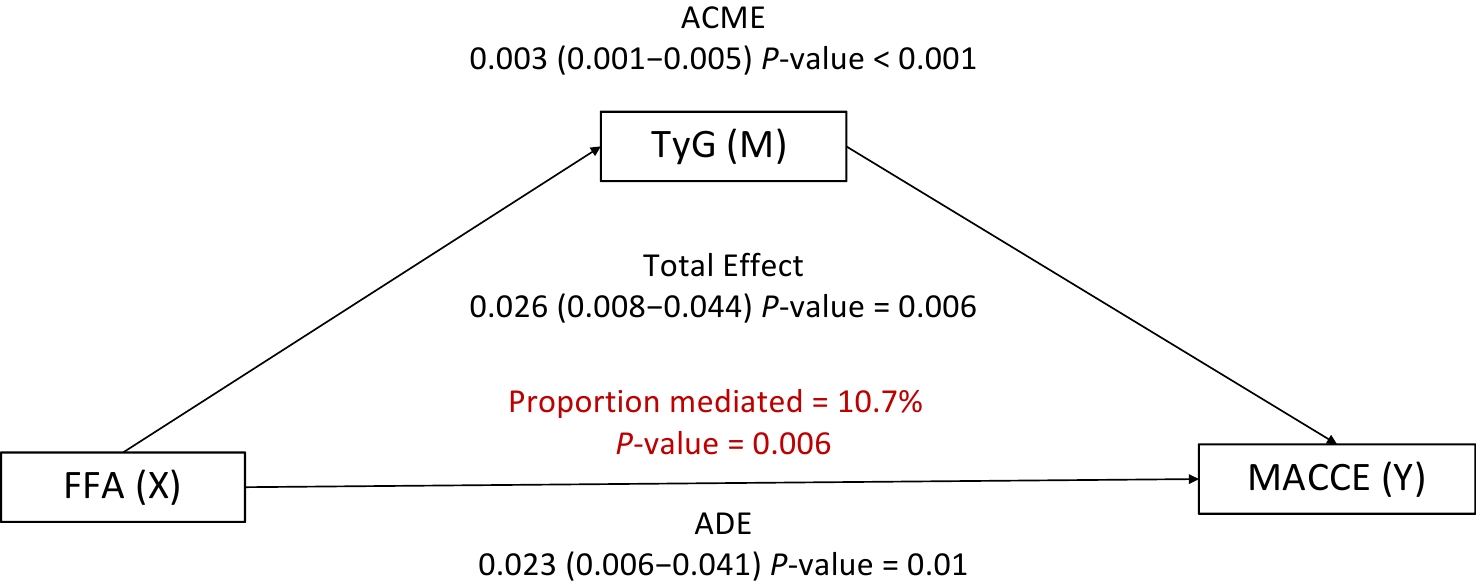
To investigate whether the TyG index mediated the association between FFA and MACCE, mediation analysis was performed. After adjusting for potential confounders, the results revealed that the TyG index significantly mediated the relationship between FFA and MACCE in overweight or obese patients, accounting for 10.7% of the total effect (Figure 3). This finding highlights the potential role of the TyG index as a pathway linking elevated FFA levels with adverse cardiovascular outcomes.
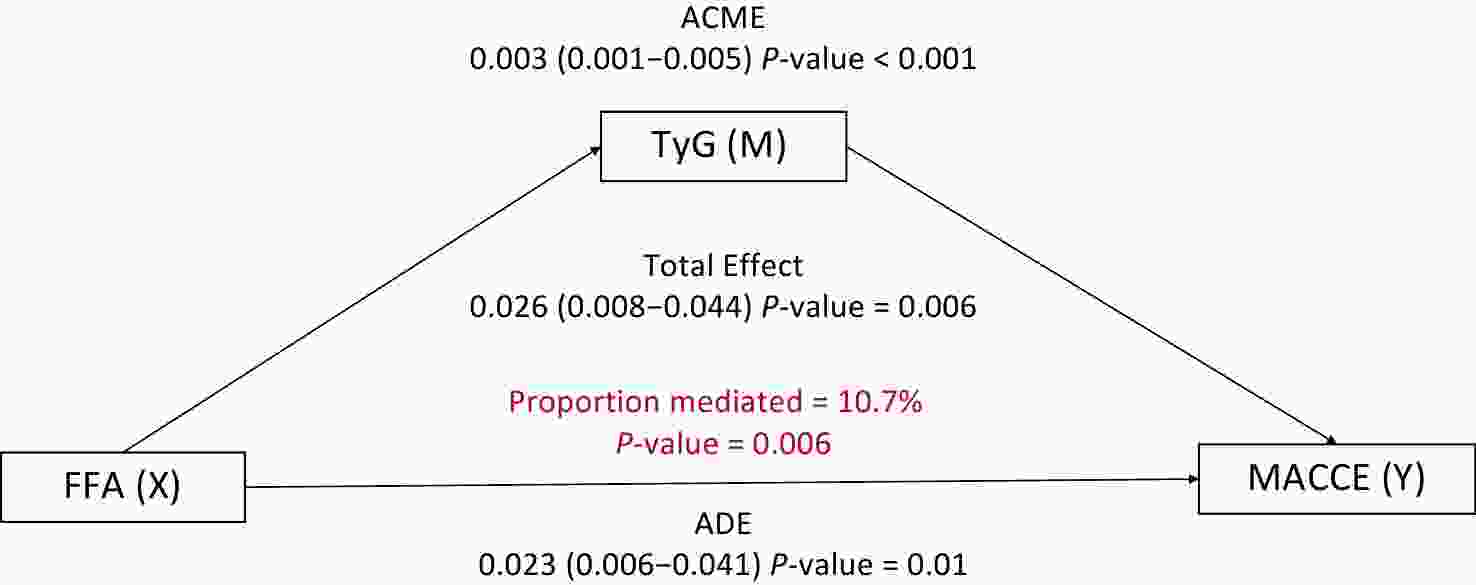
Figure 3. Mediation Analysis of the TyG Index in the Relationship Between FFA and MACCE. Adjusted by gender, age, hypertension, diabetes mellitus, smoking, acute coronary syndrome, cerebrovascular diseases, chronic kidney disease, baseline SYNTAX score. ACME: average causal mediation effect; ADE: average direct effect.
-
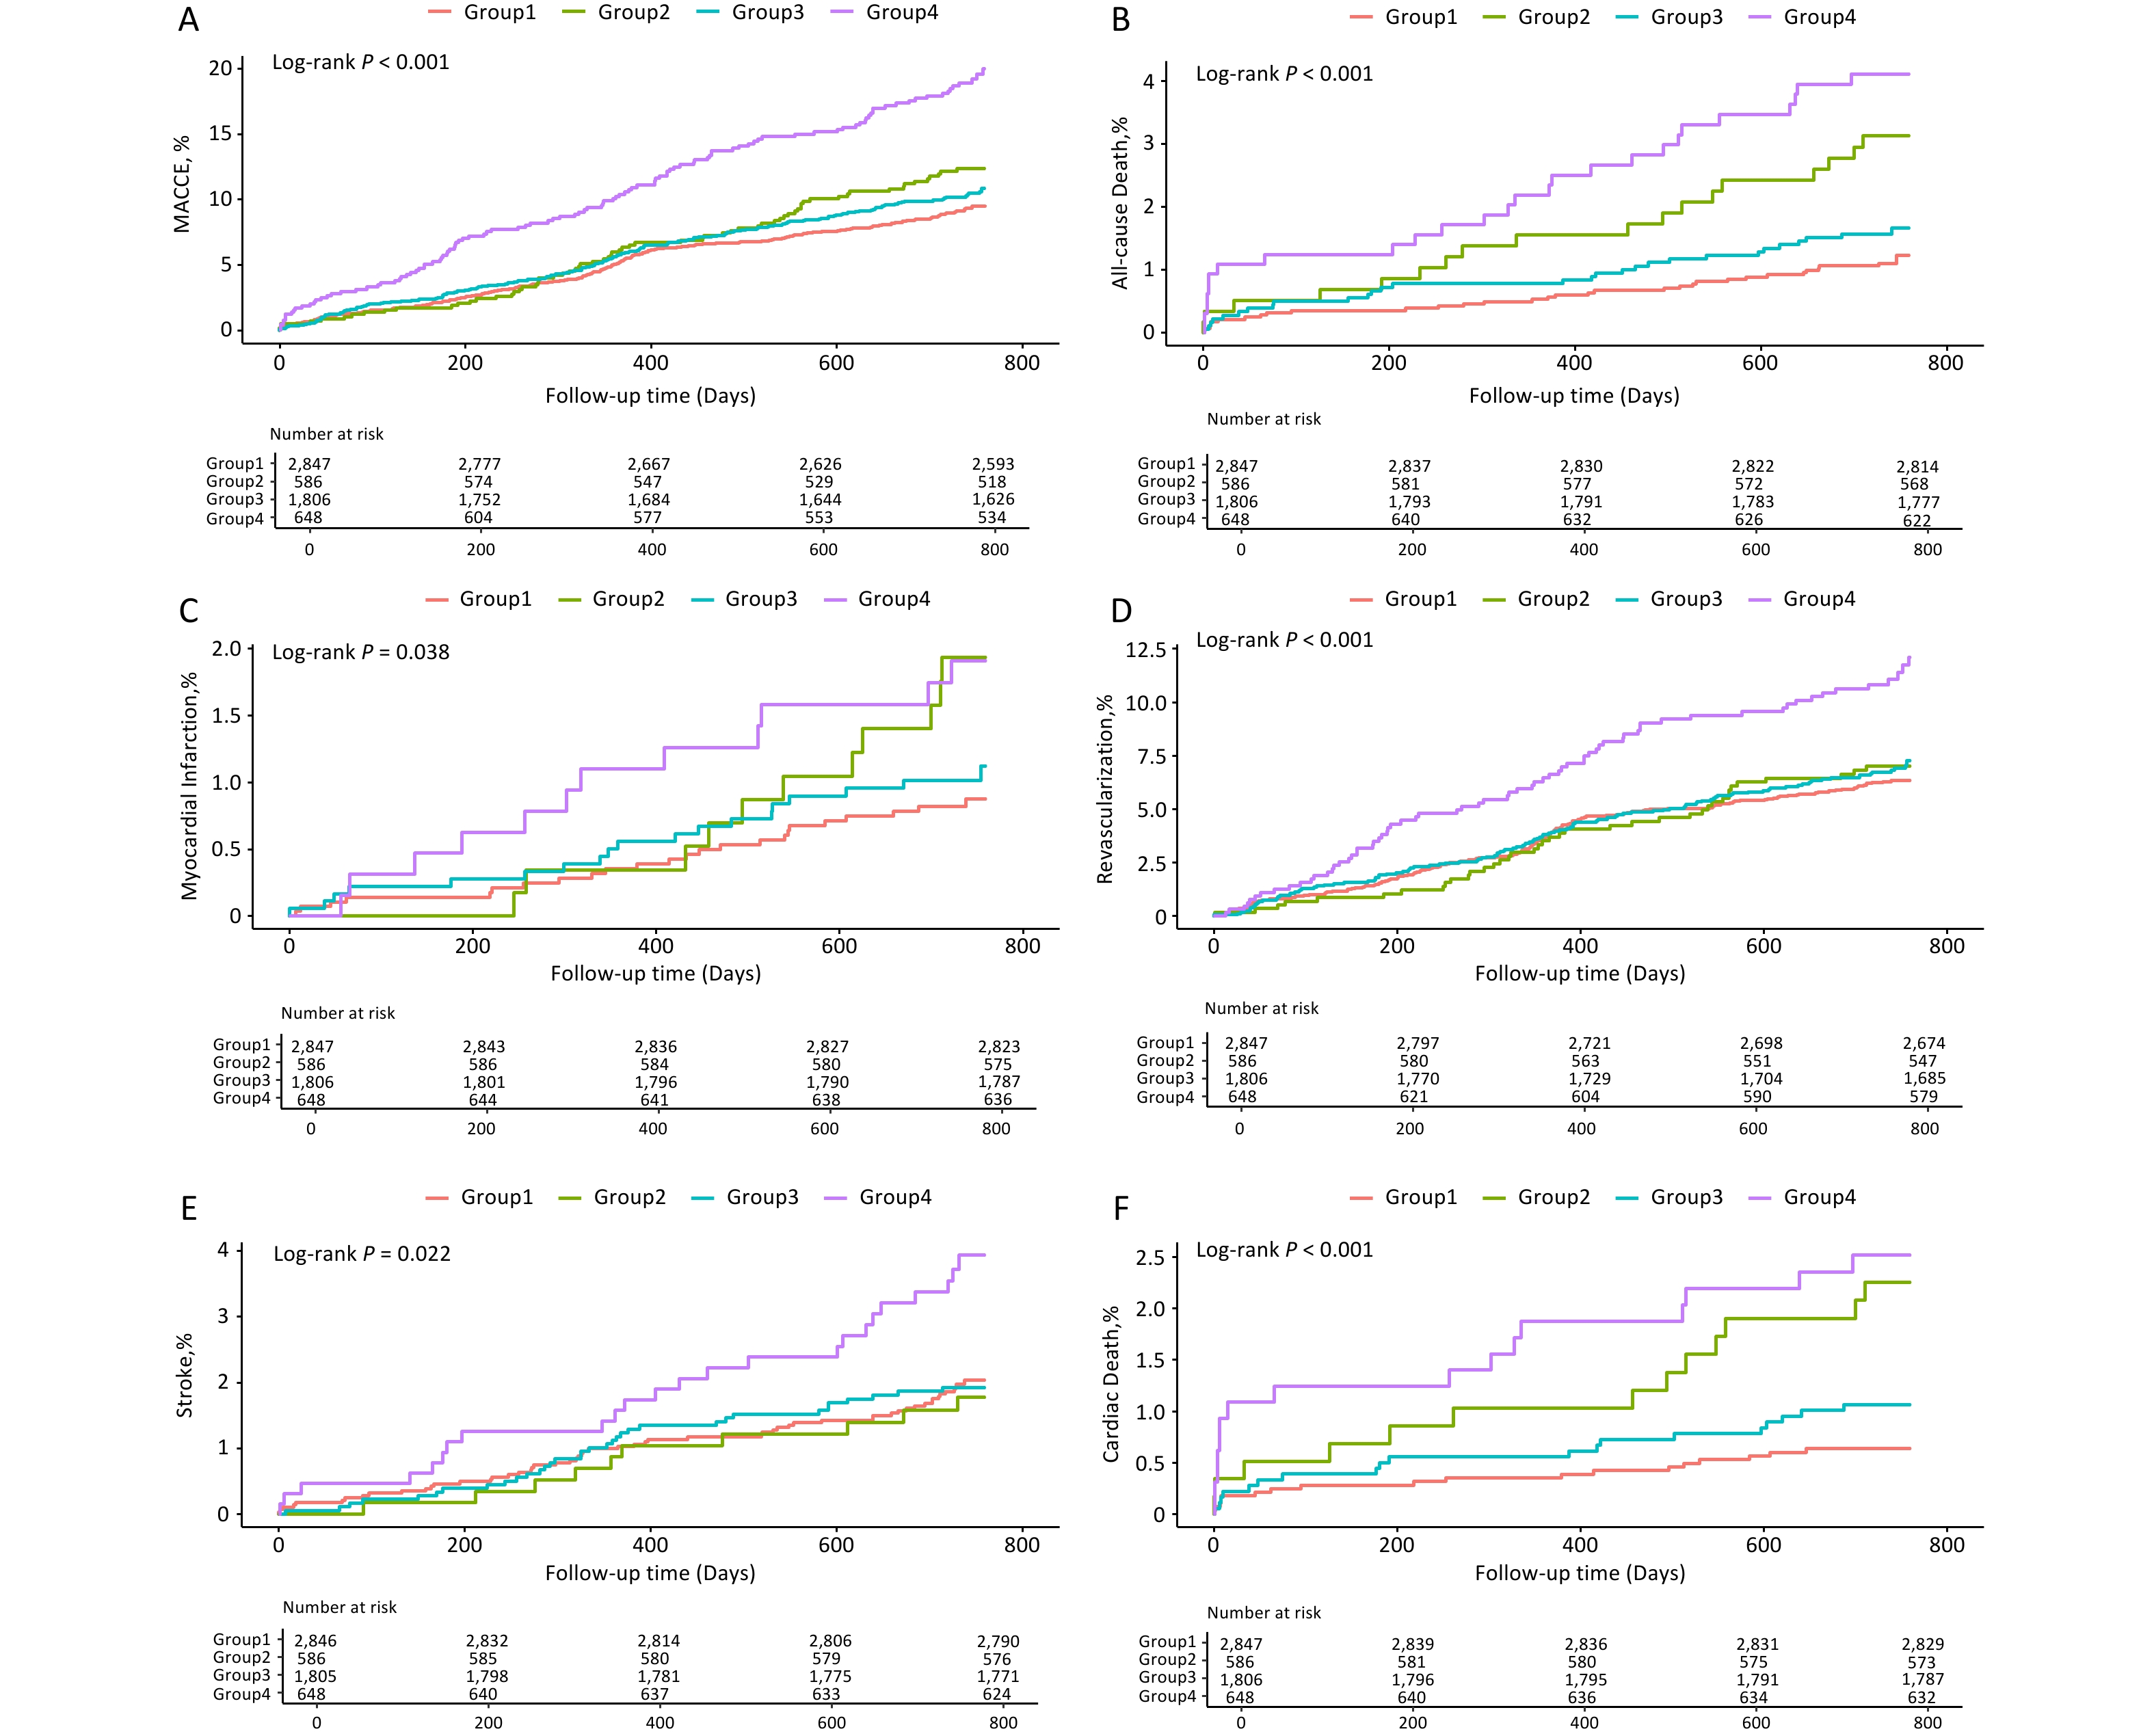
The study population was categorized into four groups based on the optimal thresholds for FFA and TyG index. Kaplan–Meier survival curves demonstrated that the H-FFA/H-TyG group had the highest incidence of adverse cardiovascular and cerebrovascular events (Figure 4). Consistently, patients with elevated FFA and TyG levels had a markedly higher risk of MACCE than those with low levels of both biomarkers (adjusted aHR: 1.951, 95% CI: 1.533–2.484, P < 0.001; Table 3). A significant interaction was observed between FFA and TyG index as categorical variables (P for interaction = 0.035). The risks of secondary endpoints were also significantly higher in the H-FFA/H-TyG group, except for acute myocardial infarction, for which no significant difference was detected (Table 4).
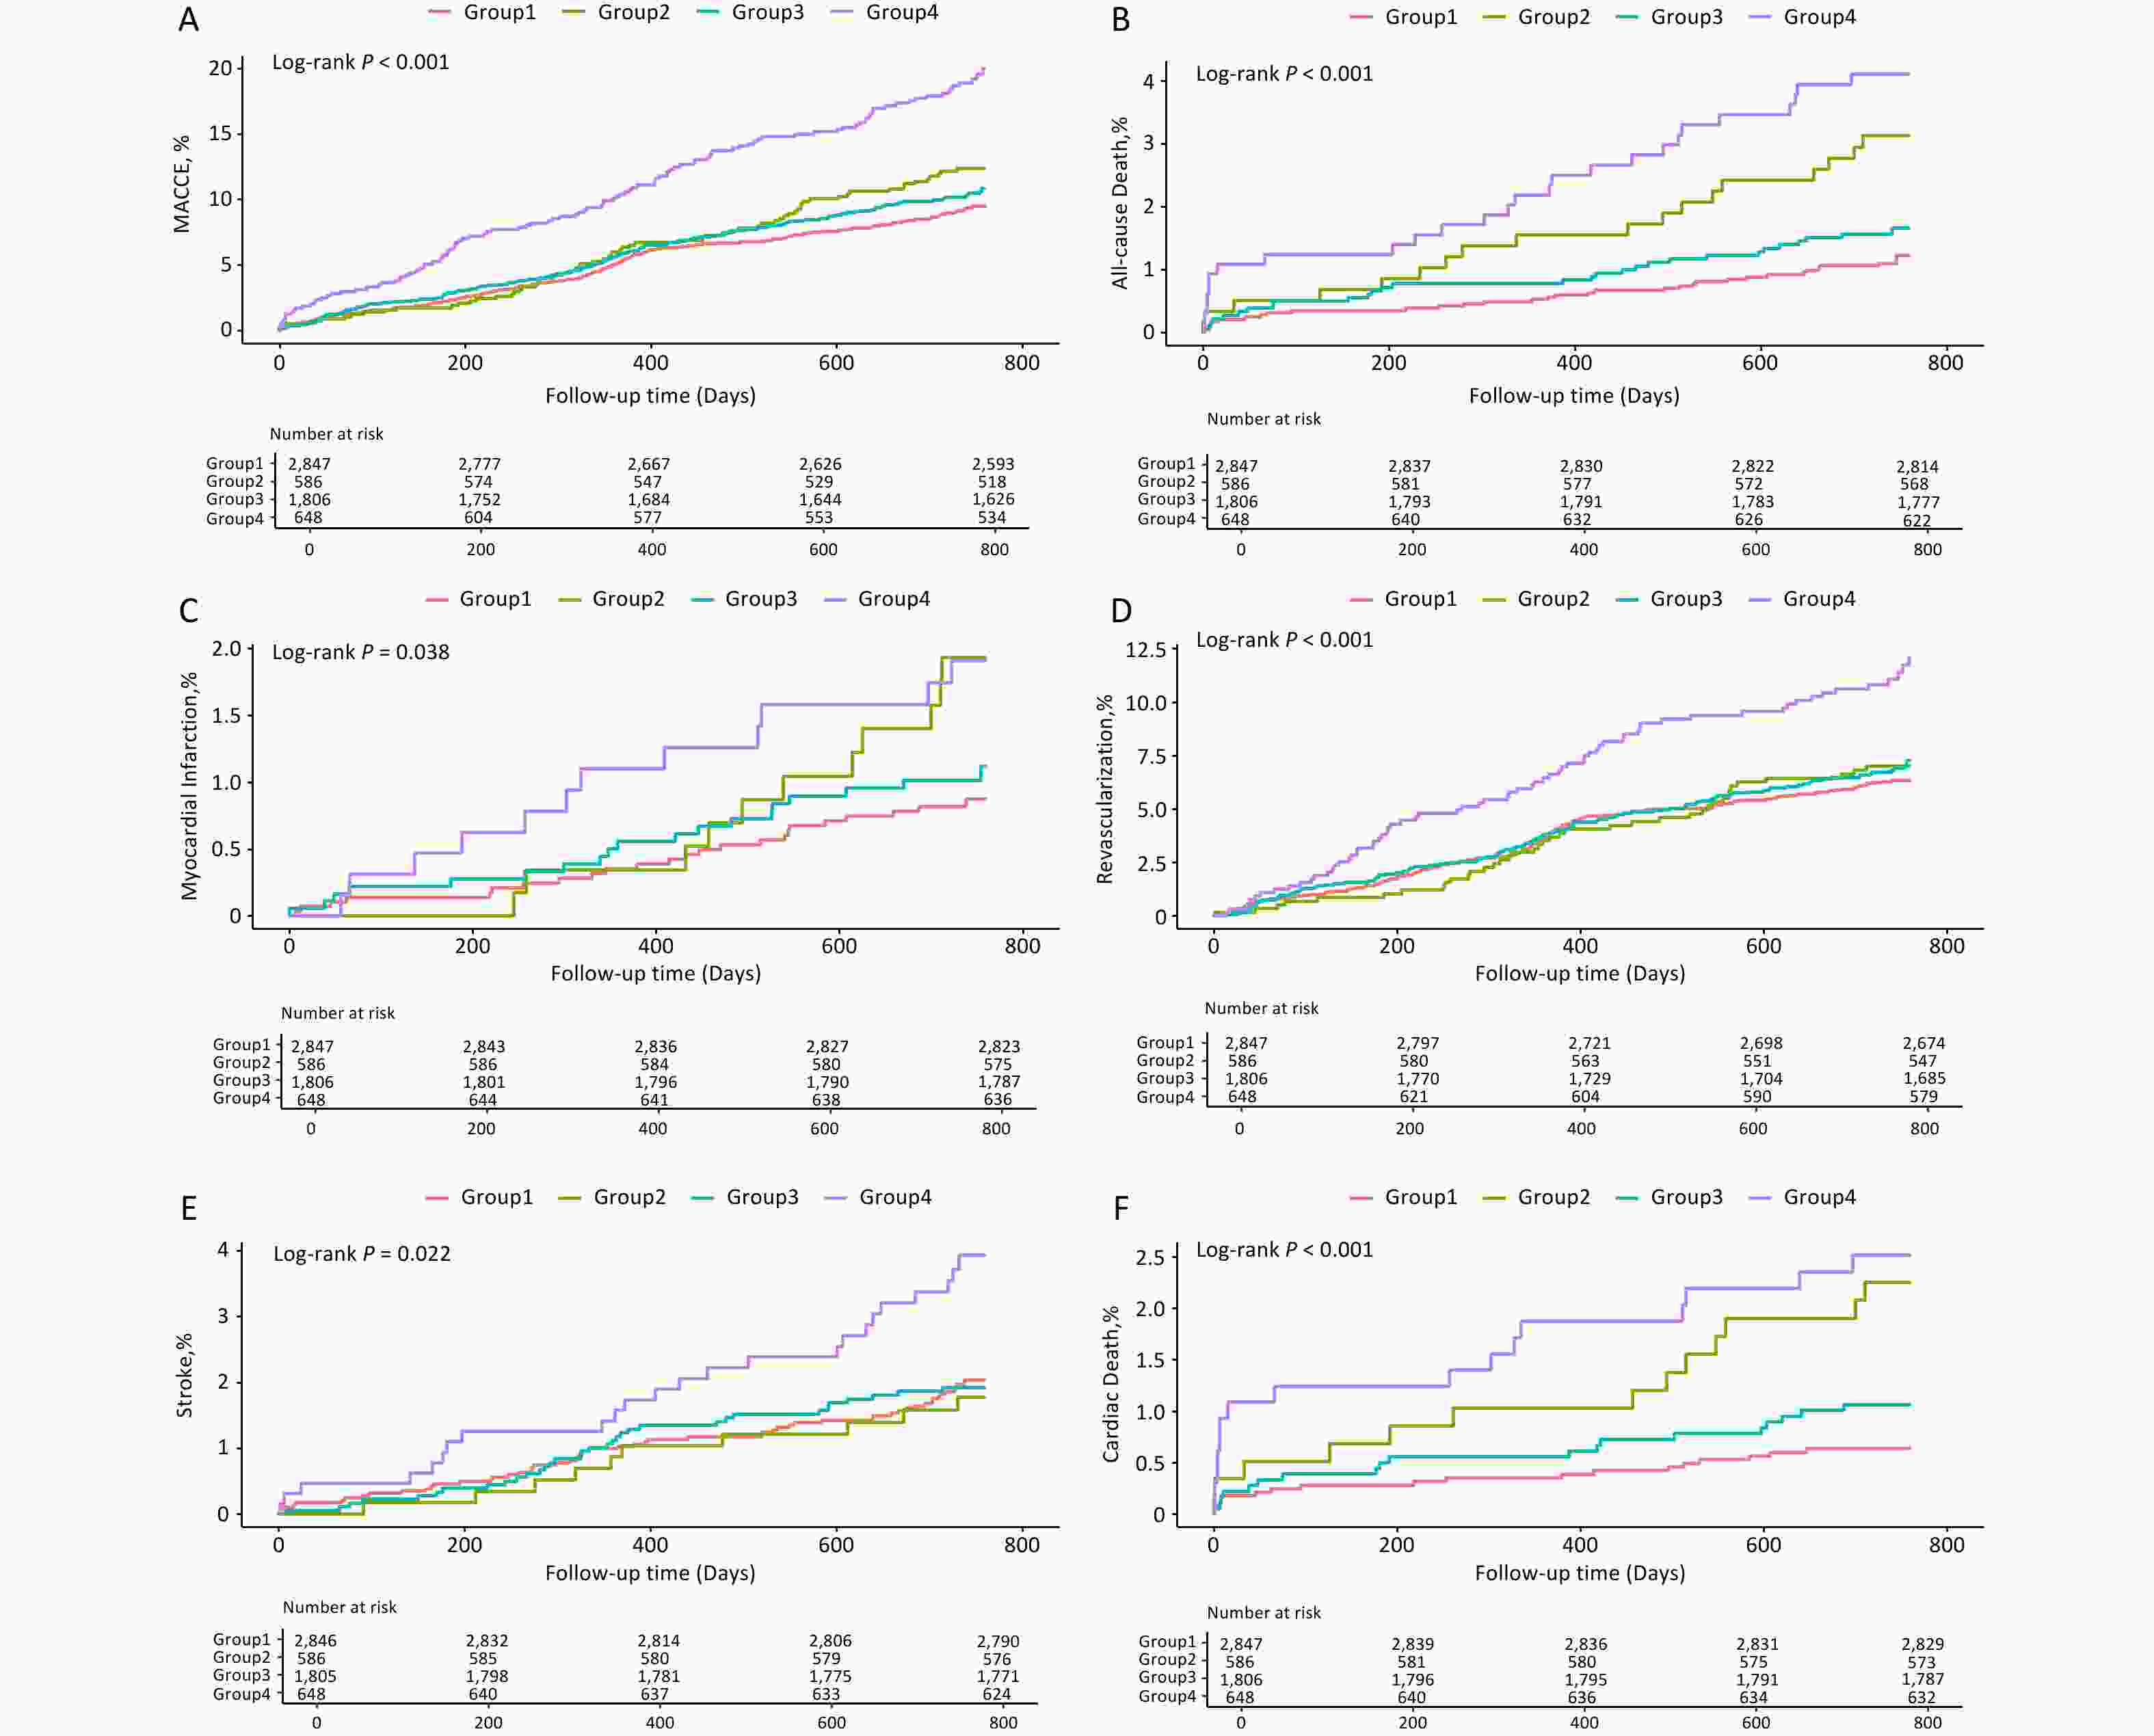
Figure 4. Kaplan–Meier Analysis Based on TyG and FFA Levels. Survival curves for MACCE (A), All-cause Death (B), Myocardial Infarction (C), Any Revascularization (D), Stroke (E) and Cardiac Death (F). Group1: Low-FFA+Low-TyG, Group2: High-FFA+Low-TyG, Group3: Low-FFA+High-TyG, Group4: High-FFA+High-TyG.
Table 3. The Combined Predictive Value of TyG Index and FFA Levels for MACCE in the Overall Population
Crude HR (95% CI) P Adjusted HR (95% CI) P P for Trend L-FFA/L-TyG
n = 2,847reference < 0.001 H-FFA/L-TyG
n = 5861.308 (1.001–1.709) 0.050 1.191 (0.904–1.569) 0.215 L-FFA/H-TyG
n = 1,8061.123 (0.928–1.360) 0.233 1.117 (0.916–1.361) 0.274 H-FFA/H-TyG
n = 6482.075 (1.664–2.588) < 0.001 1.951 (1.533–2.484) < 0.001 Note. L: low; H: high; HR: hazard ratio; CI: confidence interval; HR: hazard ratio; CI: confidence interval; TyG: triglyceride-glucose index; FFA: free fatty acid; multivariable factors: gender, age, hypertension, diabetes mellitus, smoking, acute coronary syndrome, cerebrovascular diseases, chronic kidney disease, baseline SYNTAX scores; P for interact = 0.035 between TyG more vs less than 9.05 and FFA more vs less than 0.81 for MACCE. Table 4. Predictive Value of TyG Index and FFA Levels for Secondary Endpoints in the Overall Population
Number of patients with
events No./total
No. (%)Crude HR (95% CI) P Adjusted HR (95% CI) P P for Trend All-cause Death L-FFA/L-TyG 33 (1.2%) reference < 0.001 H-FFA/L-TyG 18 (3.1%) 2.662 (1.499–4.728) 0.001 2.029 (1.122–3.669) 0.019 L-FFA/H-TyG 29 (1.6%) 1.388 (0.843–2.286) 0.198 1.472 (0.875–2.477) 0.145 H-FFA/H-TyG 26 (4.0%) 3.518 (2.104–5.881) < 0.001 3.443 (1.967–6.027) < 0.001 Myocardial Infarction L-FFA/L-TyG 24 (0.8%) reference 0.386 H-FFA/L-TyG 11 (1.9%) 2.244 (1.099–4.580) 0.026 1.575 (0.756–3.282) 0.225 L-FFA/H-TyG 19 (1.1%) 1.253 (0.687–2.288) 0.462 1.129 (0.604–2.111) 0.704 H-FFA/H-TyG 12 (1.9%) 2.242 (1.121–4.483) 0.022 1.512 (0.716–3.192) 0.278 Revascularization L-FFA/L-TyG 57 (2.0%) Reference 0.016 H-FFA/L-TyG 10 (1.7%) 1.100 (0.777–1.557) 0.591 1.064 (0.744–1.521) 0.736 L-FFA/H-TyG 35 (1.9%) 1.106 (0.877–1.396) 0.394 1.057 (0.831–1.345) 0.651 H-FFA/H-TyG 24 (3.7%) 1.824 (1.380–2.411) < 0.001 1.668 (1.230–2.263) 0.001 Stroke L-FFA/L-TyG 173 (6.1%) reference 0.081 H-FFA/L-TyG 39 (6.7%) 0.873 (0.446–1.712) 0.693 0.788 (0.396–1.569) 0.498 L-FFA/H-TyG 121 (6.7%) 0.961 (0.628–1.472) 0.855 1.026 (0.659–1.597) 0.909 H-FFA/H-TyG 69 (10.6%) 1.931 (1.197–3.114) 0.007 1.902 (1.128–3.207) 0.016 Cardiac Death L-FFA/L-TyG 18 (0.6%) reference 0.003 H-FFA/L-TyG 13 (2.2%) 3.530 (1.730–7.205) 0.001 2.477 (1.189–5.157) 0.015 L-FFA/H-TyG 19 (1.1%) 1.669 (0.876–3.180) 0.119 1.747 (0.891–3.427) 0.104 H-FFA/H-TyG 16 (2.5%) 3.963 (2.021–7.771) < 0.001 3.483 (1.681–7.217) 0.001 Note. multivariable factors: gender, age, hypertension, diabetes mellitus, smoking, acute coronary syndrome, cerebrovascular diseases, chronic kidney disease, baseline SYNTAX scores; The P for trend analysis further demonstrated a clear dose–response relationship across the four groups for MACCE, all-cause death, cardiac death, and revascularization. Post hoc power analysis indicated that the study had excellent statistical power to detect differences in all-cause death (power = 0.99), cardiac death (power = 0.96), and revascularization (power = 0.94). However, the statistical power for stroke and myocardial infarction was relatively modest (0.67 and 0.63, respectively); therefore, these results should be interpreted with caution.
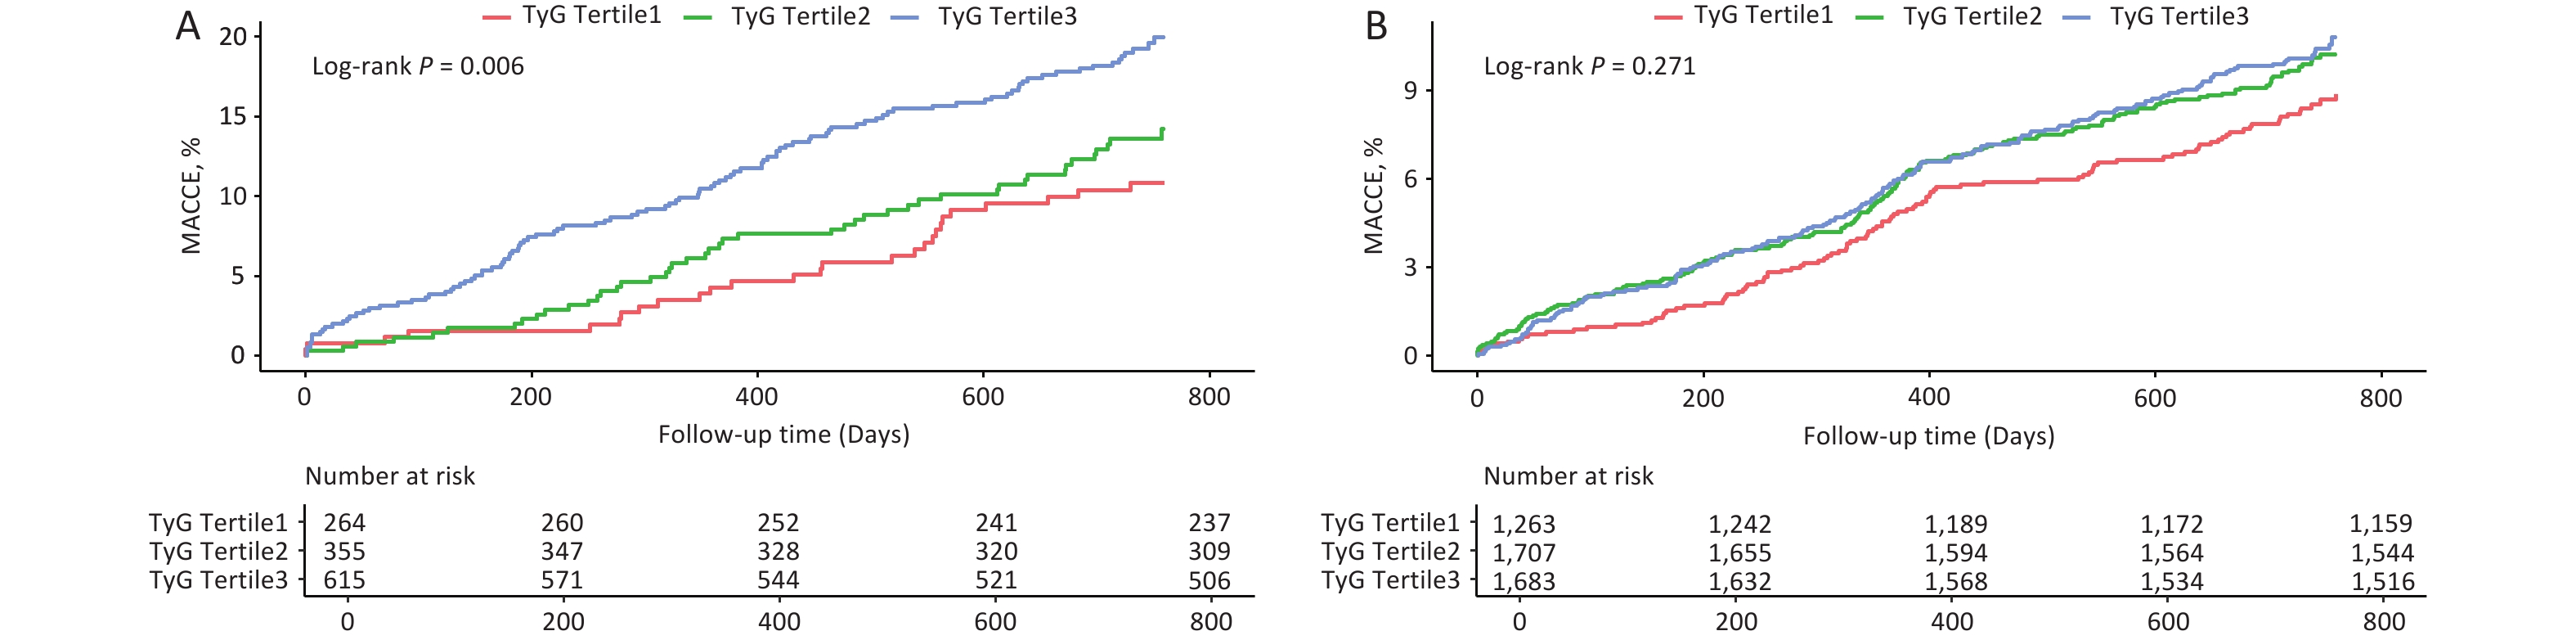
Stratified analysis is shown in Table 5, where the risk of MACCE increased with higher TyG tertiles in patients with elevated FFA levels but not in those with normal FFA levels (P for trend = 0.001). The Kaplan–Meier survival curves further supported this conclusion (Log-rank P = 0.006 vs. Log-rank P = 0.271; Figure 5).
Table 5. Differential Association Between TyG Index and MACCE in Obese Patients with or without Hyper-FFA
Crude HR (95% CI) P Adjusted HR (95% CI) P P for trend FFA < 0.81mmol/L n = 4,653 TyG Tertile1 n = 1,263 Reference 0.166 TyG Tertile2 n = 1,707 1.170 (0.915–1.497) 0.210 1.193 (0.931–1.529) 0.163 TyG Tertile3 n = 1,683 1.217 (0.953–1.555) 0.116 1.210 (0.936–1.566) 0.146 FFA ≥ 0.81mmol/L n = 1,234 TyG Tertile1 n = 264 Reference 0.001 TyG Tertile2 n = 355 1.287 (0.800–2.070) 0.298 1.235 (0.765–1.995) 0.388 TyG Tertile3 n = 615 1.844 (1.210–2.810) 0.004 1.987 (1.276–3.095) 0.002 Note. multivariable factors: gender, age, hypertension, diabetes mellitus, smoking, acute coronary syndrome, cerebrovascular diseases, chronic kidney disease, baseline SYNTAX scores. 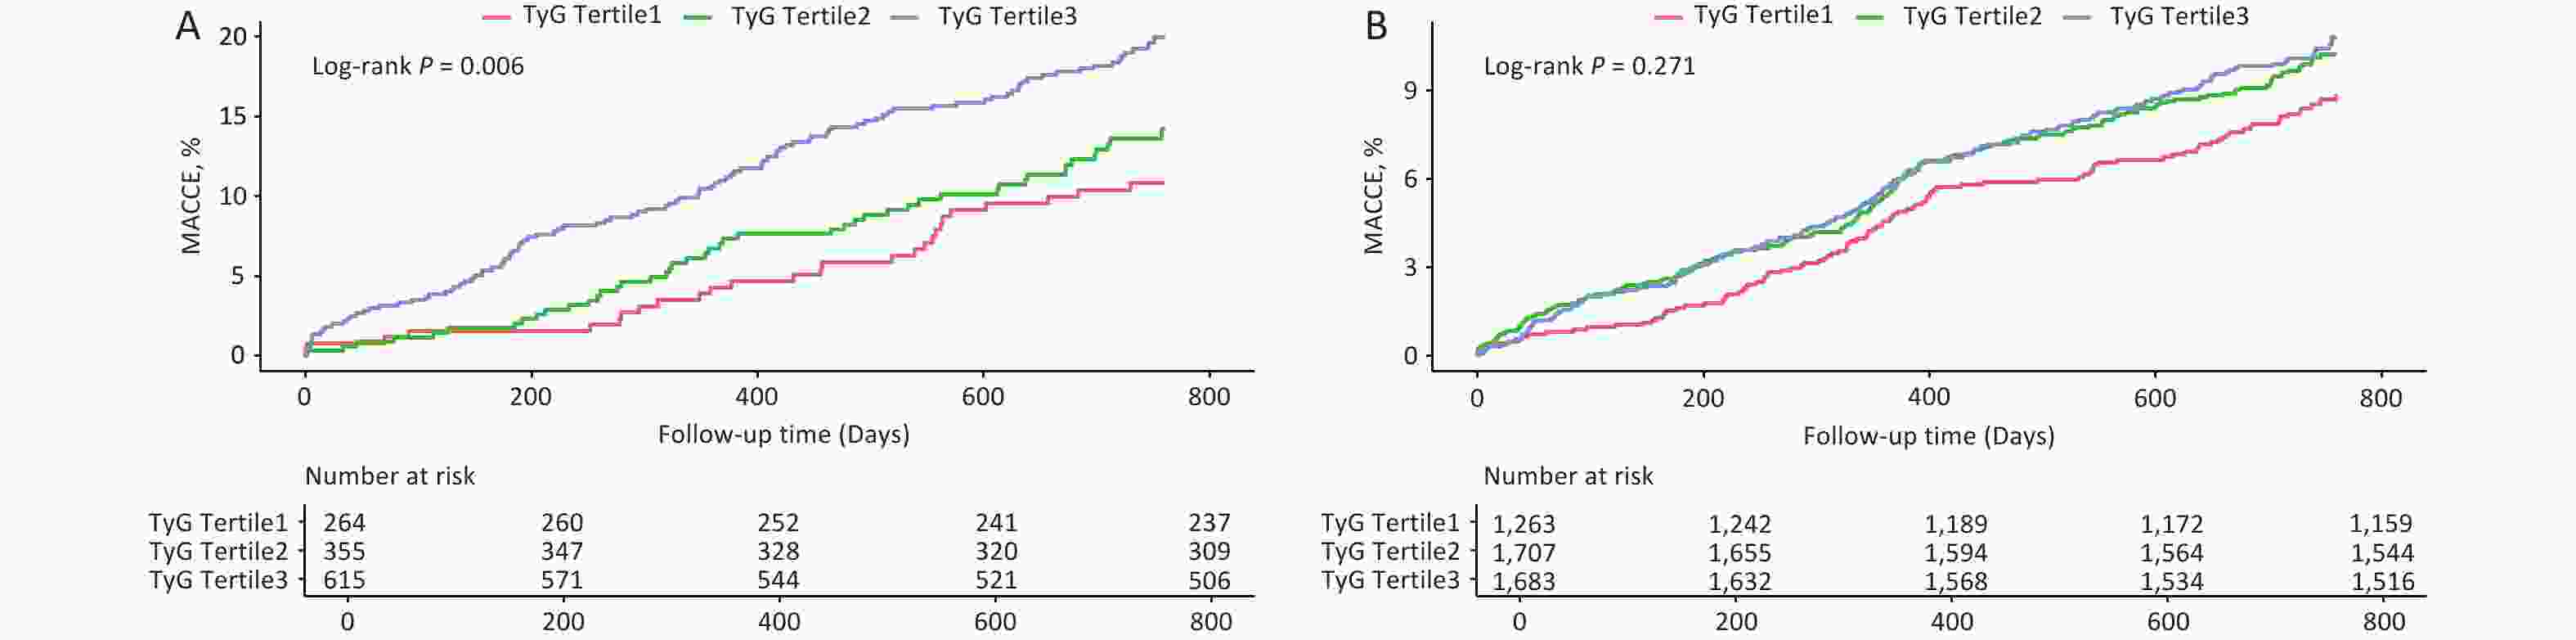
Figure 5. Kaplan–Meier Curves of TyG Tertiles and MACCE in Obese Patients With (A) and Without (B) Hyper-FFA.
-
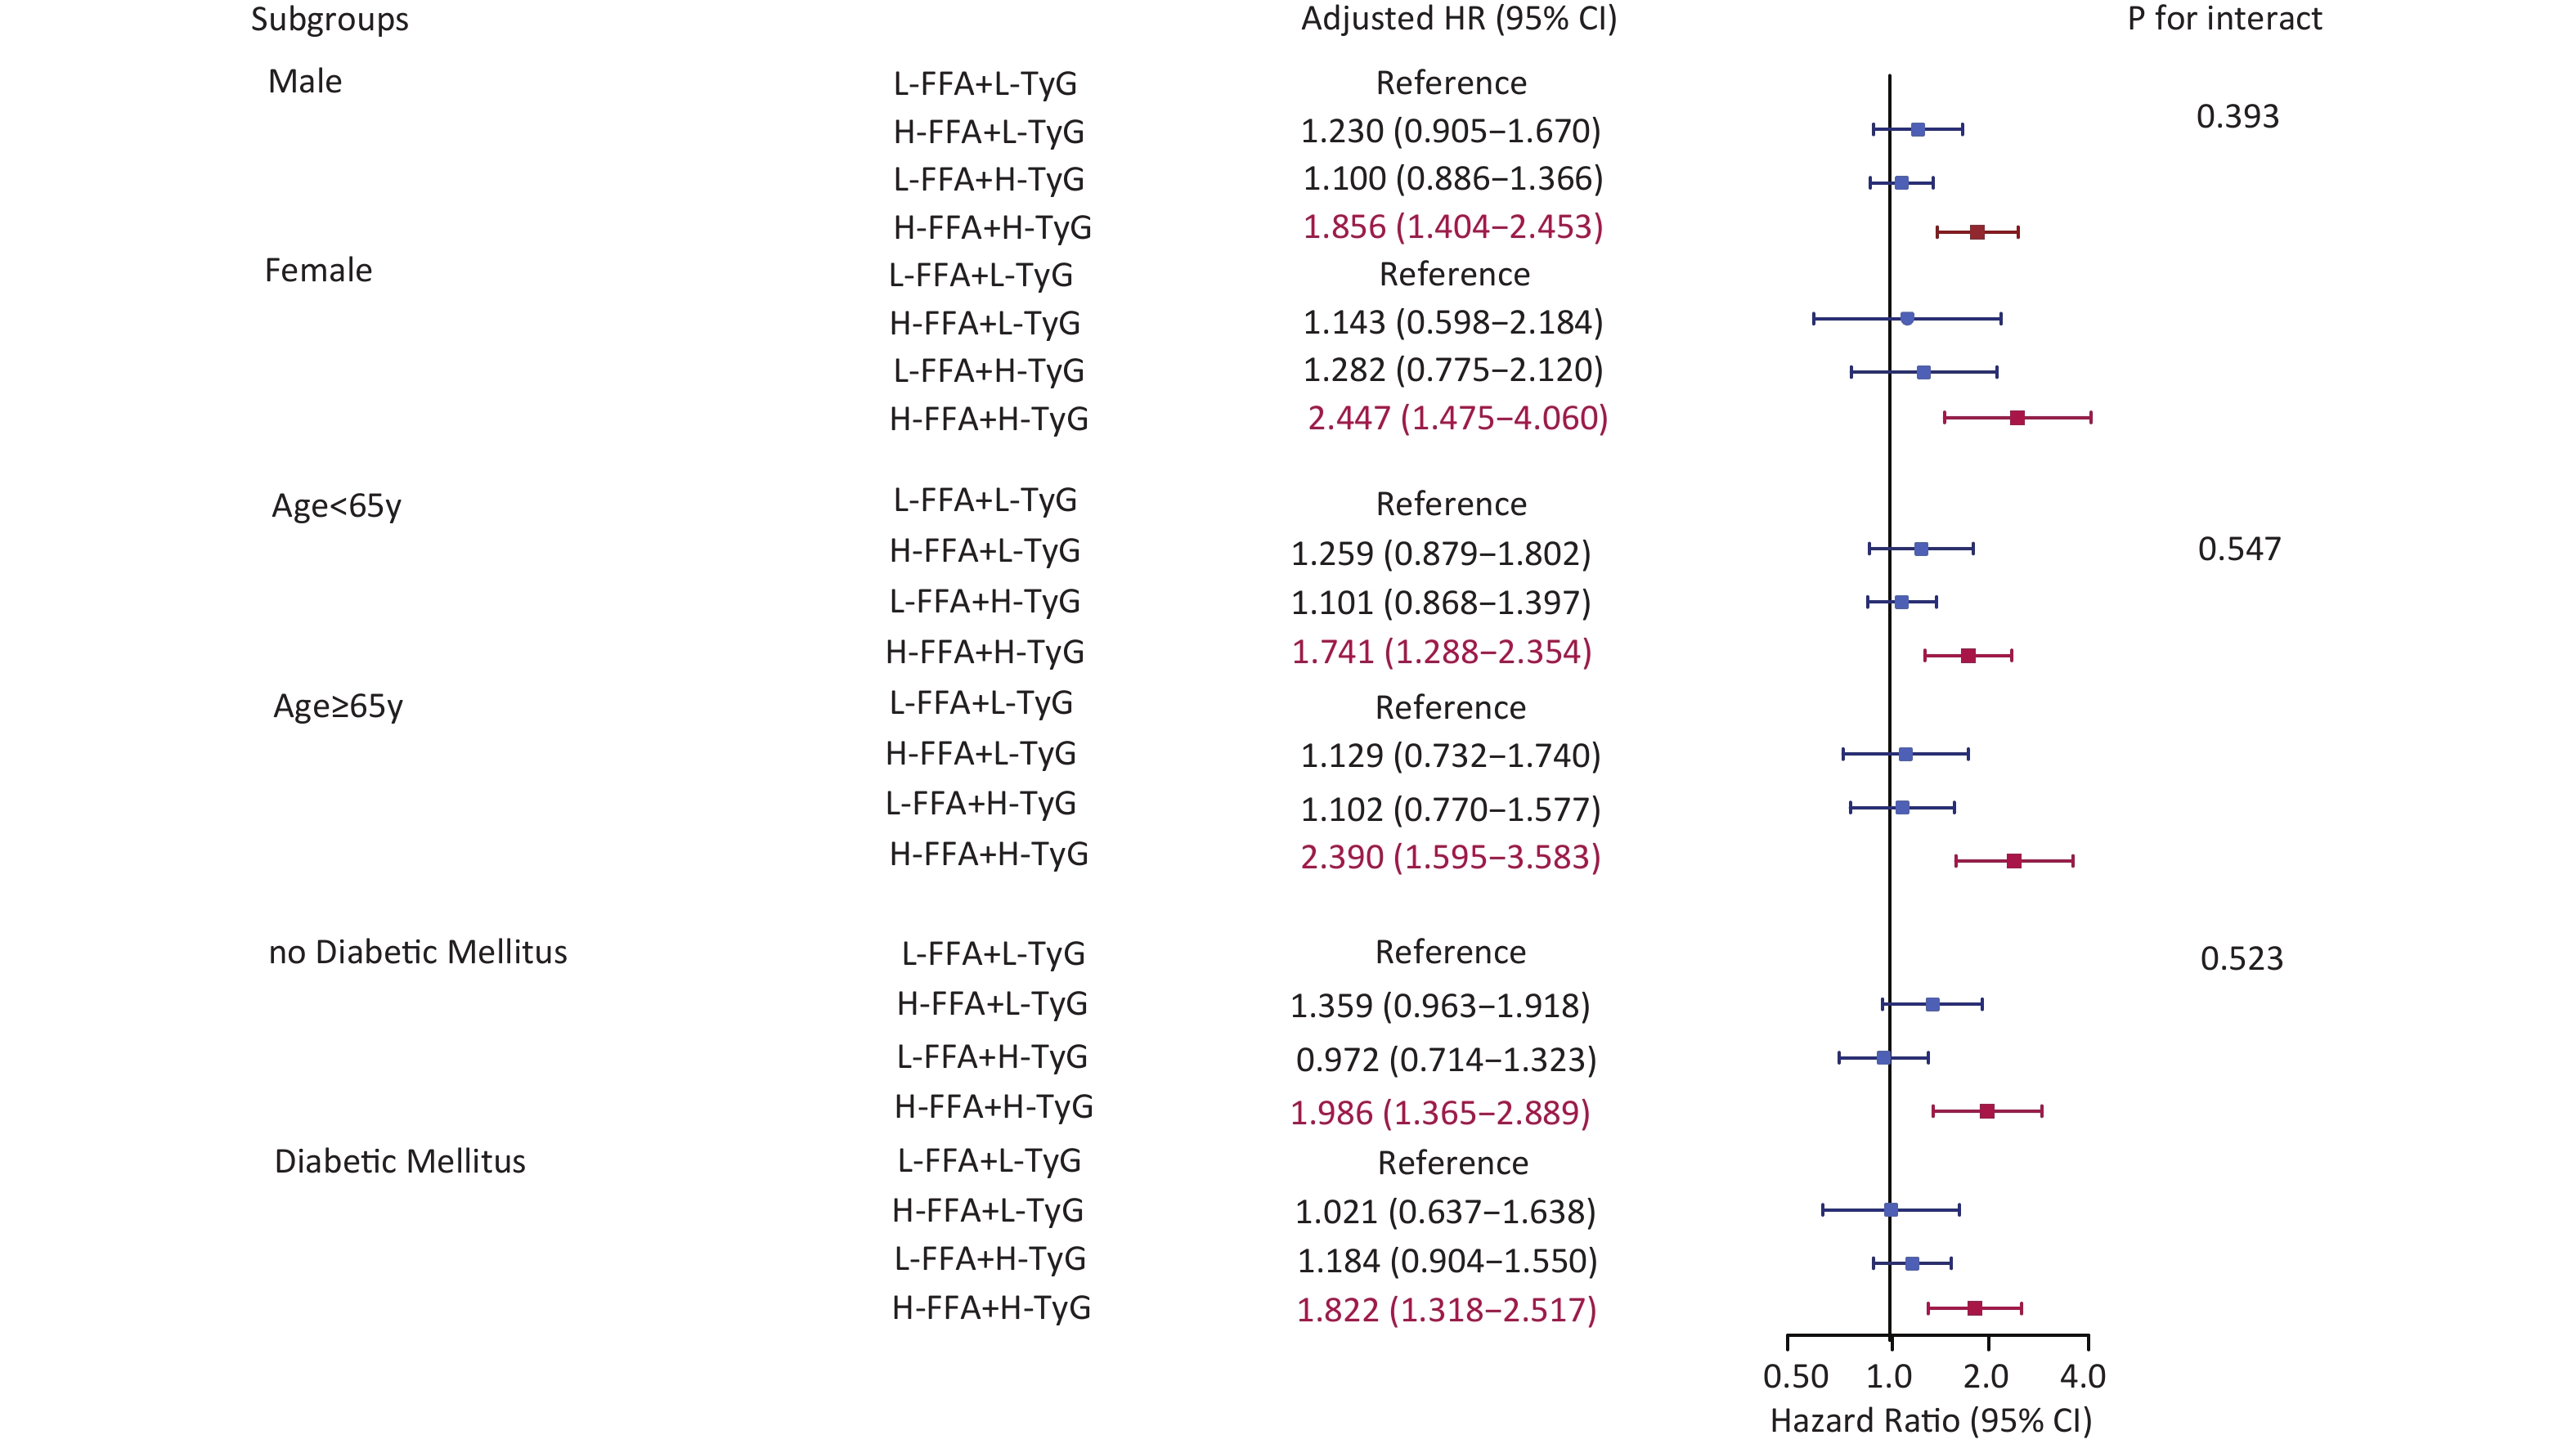
Subgroup analyses by sex, age, and DM consistently showed that high FFA and TyG levels were associated with poor prognosis. The risk of MACCE increased by 85.6% in males, 144.7% in females, 74.1% in younger patients, 139% in older patients, 98.6% in non-diabetic patients, and 82.2% in diabetic patients. No significant interactions were identified for any of the subgroup variables (Figure 6).
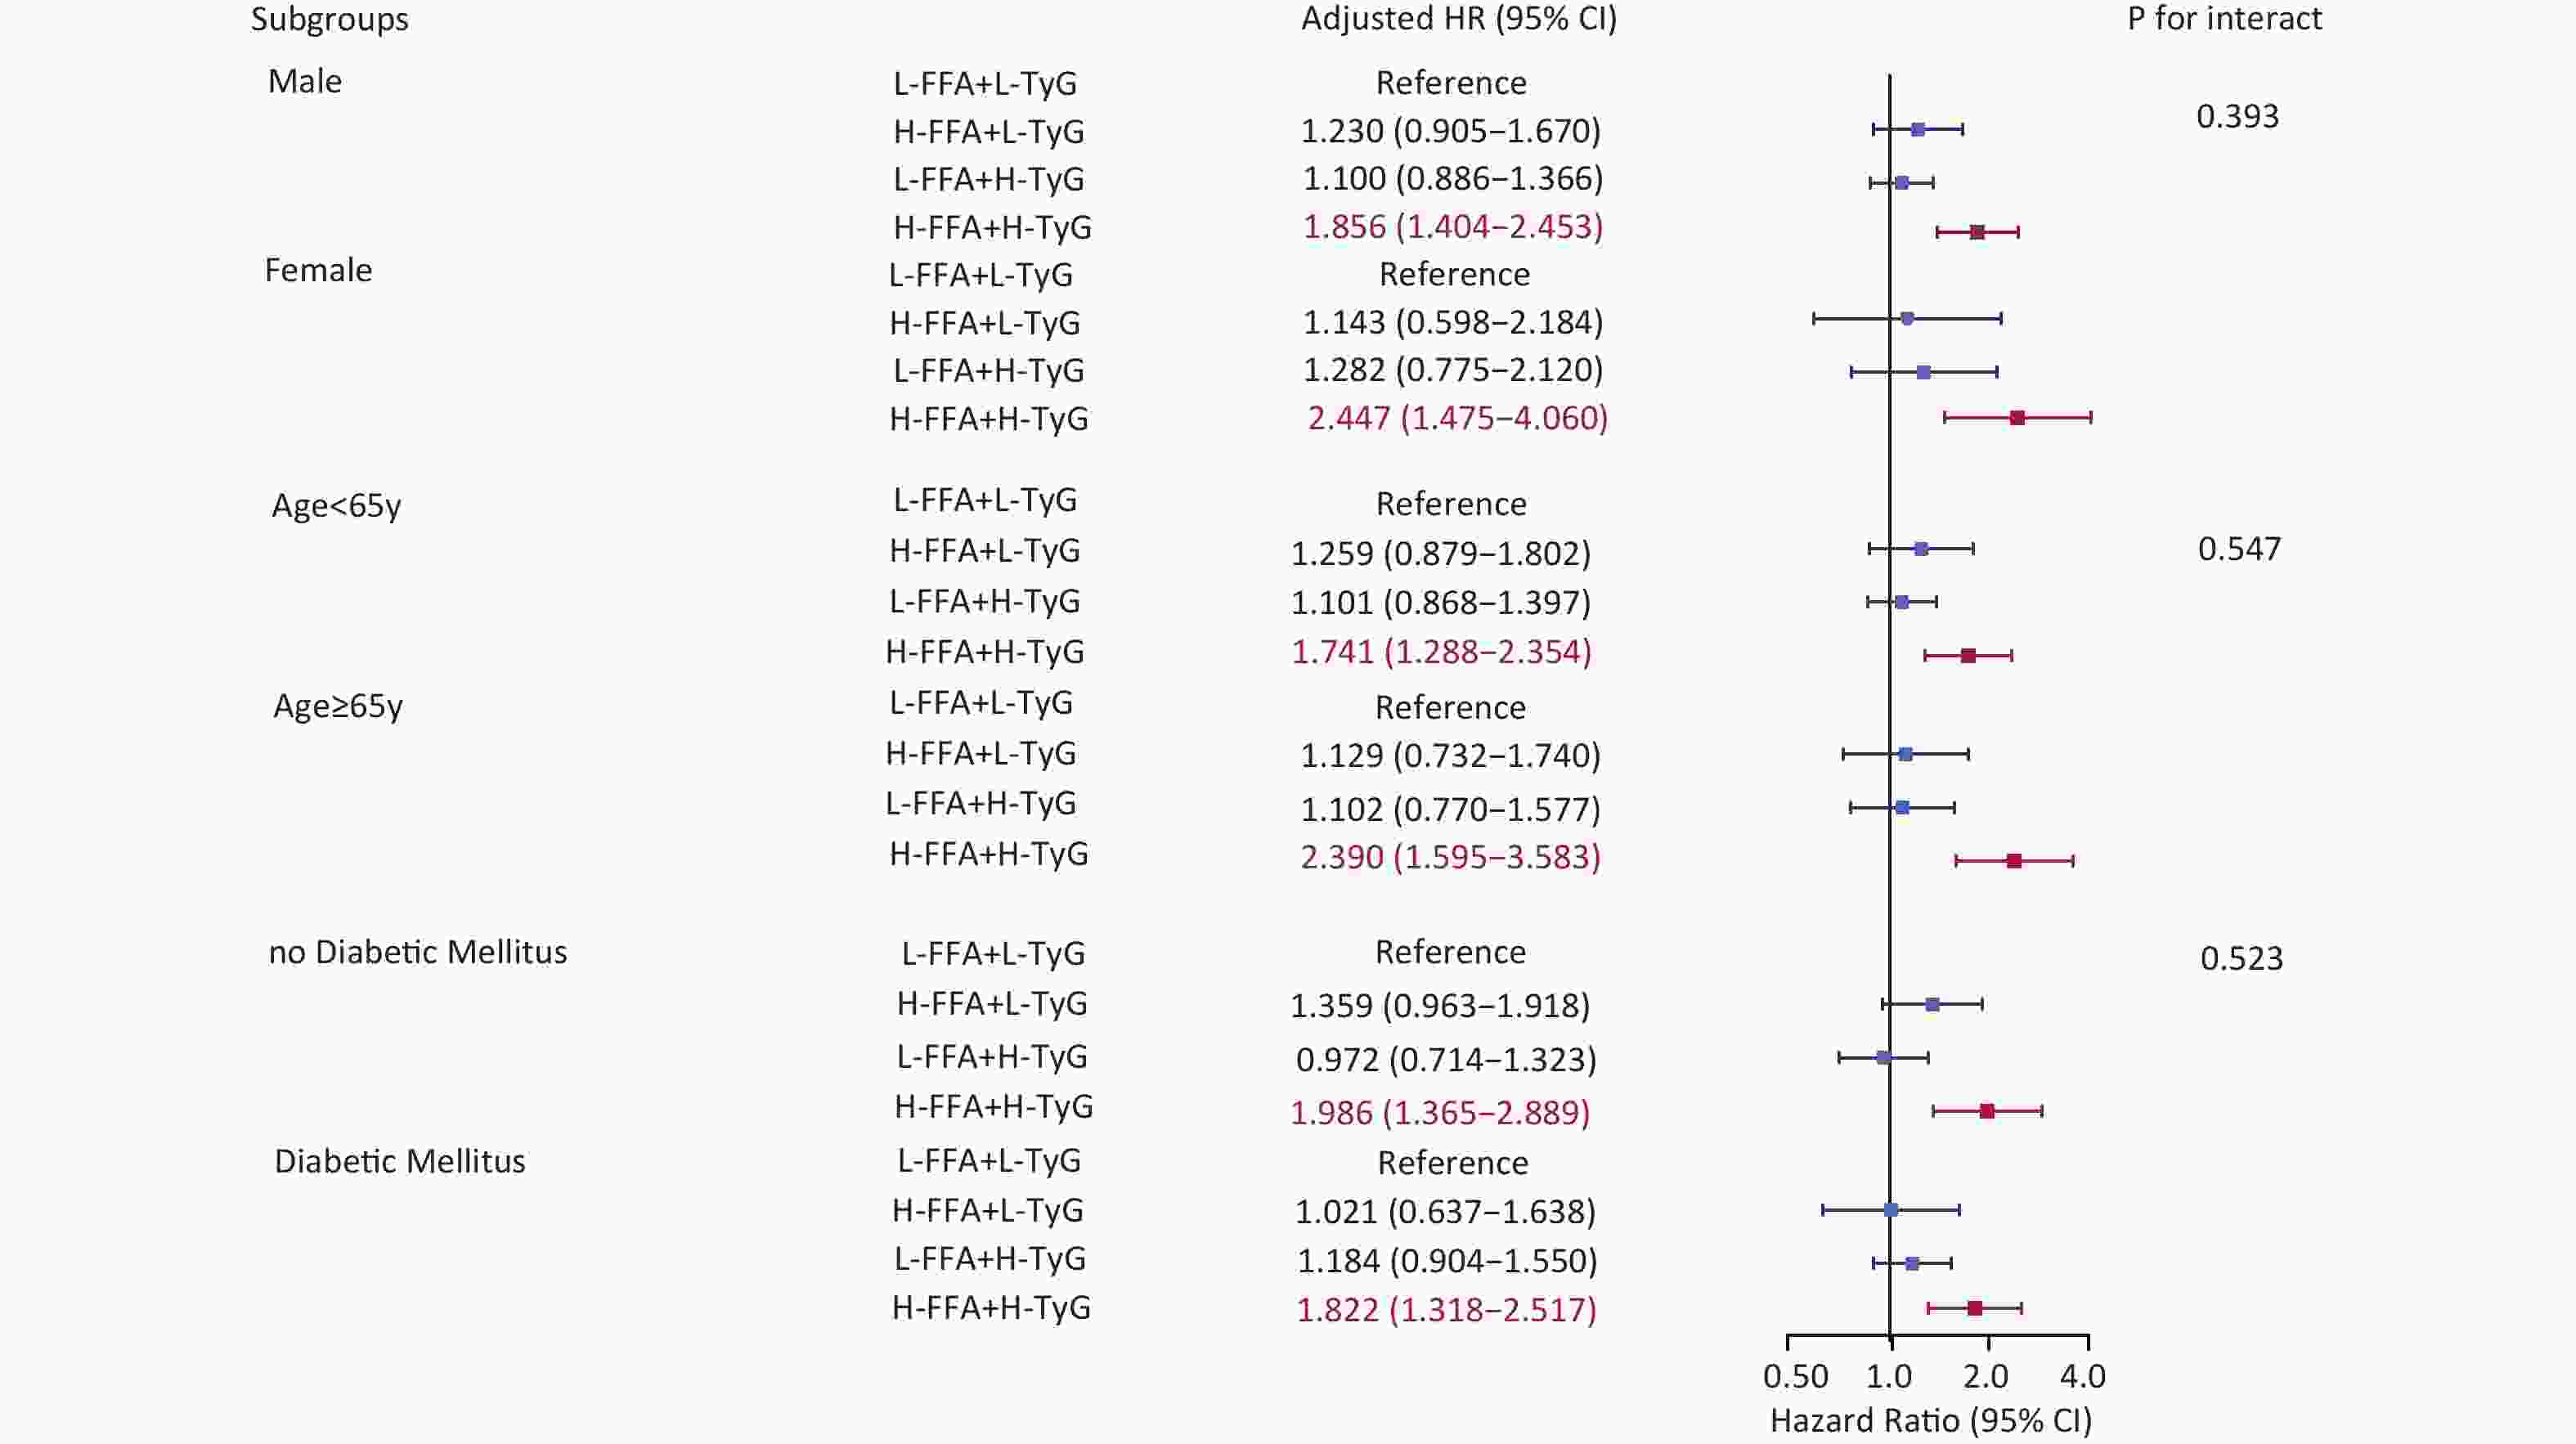
Figure 6. ?
-
This multicenter cohort study demonstrated that both the TyG index, a marker of insulin resistance, and FFA levels, which reflect lipid burden, were independent predictors of 2-year MACCE in overweight or obese CAD patients. Notably, the TyG index mediated 10.7% of the association between FFA and MACCE, suggesting that FFA exacerbated cardiovascular risk through insulin resistance.
Previous studies have demonstrated that obesity is associated with increased cardiovascular risk, partially mediated by insulin resistance, as measured by the TyG index[16]. The TyG index has also been shown to mediate the relationship between obesity and stroke, with its combination with BMI enhancing event prediction accuracy[17]. Additionally, the link between obesity and insulin resistance may be influenced by FFA released from adipose tissue[18]. Our findings extend this understanding by highlighting FFA as a critical factor in the interplay between obesity, insulin resistance, and adverse clinical outcomes.
Previous studies have confirmed that adipose tissue drives cardiac dysfunction by releasing FFA, accelerating the process of atherosclerosis, and leading to high levels of inflammation and endothelial dysfunction[19]. Insulin resistance exacerbates these effects by promoting hyperglycemia, hypertriglyceridemia, oxidative stress, and vascular inflammation, which impair endothelial function and accelerate smooth muscle proliferation[20]. The TyG index is a reliable surrogate for insulin resistance and has consistently demonstrated a predictive value for cardiovascular events[21]. These conclusions are consistent with the results of this study. In overweight or obese patients, both FFA and the TyG index were independent predictors of MACCE, and the TyG index played a mediating role (10.7%) in the relationship between FFA and MACCE.
The effect of mediation can be illustrated through several mechanisms: (1) the classic“"Randle cycl”" proposes that fatty acid and glucose metabolism are mutually competitive, that is, when FFA levels increase, fatty acid oxidation predominates, and the resulting metabolic byproducts inhibit glucose metabolism, which leads to impaired glucose oxidation and accumulation of glycolytic intermediates[22]; (2) elevated FFA levels could activate protein kinase C and disrupt the phosphorylation of insulin receptor substrate-1, impairing the PI3K/AKT signaling pathway[23,24]; (3) excess FFA undergoes incomplete oxidation, promoting the ectopic deposition of toxic lipid intermediates, such as ceramides and diacylglycerol, in skeletal muscle and liver, and these metabolites directly inhibit insulin signaling and reduce glucose uptake in tissues[25]; (4) FFA activates Toll-like receptor 4, inducing inflammatory responses[26], and promotes excessive production of reactive oxygen species, triggering oxidative stress and chronic low-grade inflammation, further impairing insulin sensitivity[27]. These pathways worsen insulin sensitivity and contribute to adverse cardiovascular outcomes.
Moreover, patients with both high FFA and TyG levels exhibited the highest risk burden, with a positive interaction between the two factors. This suggests that the risk associated with TyG levels is influenced by FFA levels. Further stratified analysis revealed that, in overweight or obese patients with low FFA levels, an increase in TyG was not associated with a higher MACCE risk, highlighting the role of FFA as a key stratification factor.
These findings may be attributable to the double-hit mechanism of lipotoxicity and insulin resistance. The first hit is primarily driven by elevated FFA, supranormal levels of FFAs, which act as signaling molecules and metabolic stressors. They activate pro-inflammatory pathways, induce endoplasmic reticulum stress[28], and promote the formation of toxic lipid intermediates within cardiomyocytes and vascular endothelial cells, directly leading to cellular dysfunction and apoptosis[29]. In the second hit, reflected by a high TyG index, insulin resistance exacerbates the damaging effects of lipotoxicity by impairing metabolic processes, promoting inflammation, and enhancing endothelial dysfunction[30]. Crucially, these processes form a vicious cycle: lipotoxicity from FFA directly impairs insulin signaling pathways in endothelial cells and myocytes, thereby worsening insulin resistance. The resulting higher TyG index further elevates the FFA levels and their detrimental effects.
Therefore, reducing the health threats caused by FFA remains a problem. Some studies have reported that FFA levels can be reduced through weight loss, diet, long-term exercise, and other methods[31]. Through our study, patients with elevated FFA levels may also benefit from aggressive management of coexisting metabolic disorders. Consequently, reducing insulin resistance in overweight or obese patients could mitigate both its synergistic and mediating effects on FFA-related adverse outcomes.
This study has some limitations. First, because our data lack waist circumference, subcutaneous or visceral fat, and other data that are recommended to accurately define obesity[32,33], only BMI ≥ 25 kg/m2 was used as the inclusion criteria for general overweight or obesity, which can be further optimized in the future. Second, baseline measurements of FFA and the TyG index were not longitudinal, limiting dynamic risk assessment. Third, the study cohort consisted mainly of Han Chinese patients, and its generalizability to other ethnic groups requires further validation. Fourth, the lack of data on alcohol consumption and physical activity, which are known to influence cardiovascular and cerebrovascular diseases, may introduce potential bias in our findings. Finally, given the nature of this observational study, we could not establish causal relationships between FFA, TyG index, and adverse clinical outcomes.
-
FFA and the TyG index are independent predictors of adverse outcomes in overweight or obese CAD patients, and the TyG index mediates the relationship between FFA and MACCE. The combined assessment of these two risk factors facilitates a more precise risk stratification in this population and emphasizes the importance of identifying high-risk individuals who may benefit from intensive surveillance and tailored interventions.
doi: 10.3967/bes2026.015
Joint Impact of Triglyceride-Glucose Index and Free Fatty Acid Levels on Cardiovascular Outcomes in Overweight or Obese Patients with Coronary Artery Disease — A Large Multicenter Prospective Study
-
Abstract:
Objective To investigate the joint effect of free fatty acid (FFA) and the triglyceride-glucose (TyG) index on the prognosis of overweight and obese coronary artery disease (CAD) patients. Methods A total of 5,887 patients were enrolled in this study. Restricted cubic spline analyses were used to assess the dose-response relationship of FFA and TyG with major adverse cardiovascular and cerebrovascular events (MACCE). Mediation analysis was used to examine whether TyG mediated the association between FFA and MACCE. Kaplan–Meier survival curves were used to compare the cumulative incidence of events. Multivariable Cox models were used to explore the independent association between Low-/High-FFA and Low-/High-TyG on outcomes. Results FFA and TyG were independent predictors of MACCE. TyG mediated 10.7% of the association between FFA and MACCE. Patients with high FFA and TyG levels exhibited a markedly higher MACCE risk (adjusted hazard ratio: 1.951, 95% confidence interval: 1.533–2.484; P < 0.001), with a significant interaction between FFA and TyG. Among patients with elevated FFA levels, MACCE increased progressively across higher TyG tertiles (P for trend = 0.001). Conclusions FFA and the TyG index independently predict adverse outcomes in overweight or obese CAD patients, with the TyG index mediating the relationship between FFA and MACCE. Their combined assessment enhances the risk stratification in this population. -
Key words:
- TyG index /
- FFA /
- Obesity /
- Coronary artery disease /
- Risk stratification
The authors declare that they have no competing financial interests or personal relationships that may have influenced the work reported in this study.
The Institutional Review Board of Fuwai Hospital approved the study protocol (IRB number: IRB2012-BG-006). The study was conducted in accordance with relevant regulations, and informed consent was obtained from all participants. The research was performed in accordance with the principles of the Declaration of Helsinki.
Ying Song, Jinqing Yuan, Yaling Han, Xueyan Zhao, Jue Chen, Runlin Gao, and Lei Song participated in the study design. Weiting Cai, Lin Jiang, Jingjing Xu, Yi Yao, Na Xu, Xiaozeng Wang, Zhenyu Liu, Zheng Zhang, Yongzhen Zhang, Xiaogang Guo, Zhifang Wang, Yingqing Feng, Qingsheng Wang, and Jianxin Li participated in data analysis. Queyun Sun and Cheng Cui wrote the manuscript. All authors participated in the data interpretation and critical revision of the manuscript.
The datasets generated or analyzed during the current study are not publicly available because the participants did not agree for their data to be shared publicly but are available from the corresponding author upon reasonable request.
Written informed consent for publication was obtained from all participants.
&These authors contributed equally to this work.
注释:1) Funding: 2) Competing interests: 3) Ethics: 4) Authors’ Contributions: 5) Data sharing: 6) Consent for Publication: -
Figure 3. Mediation Analysis of the TyG Index in the Relationship Between FFA and MACCE. Adjusted by gender, age, hypertension, diabetes mellitus, smoking, acute coronary syndrome, cerebrovascular diseases, chronic kidney disease, baseline SYNTAX score. ACME: average causal mediation effect; ADE: average direct effect.
Figure 4. Kaplan–Meier Analysis Based on TyG and FFA Levels. Survival curves for MACCE (A), All-cause Death (B), Myocardial Infarction (C), Any Revascularization (D), Stroke (E) and Cardiac Death (F). Group1: Low-FFA+Low-TyG, Group2: High-FFA+Low-TyG, Group3: Low-FFA+High-TyG, Group4: High-FFA+High-TyG.
Figure 5. Kaplan–Meier Curves of TyG Tertiles and MACCE in Obese Patients With (A) and Without (B) Hyper-FFA.
Table 1. Baseline Characteristics of patients
Variables Total
n = 5,887L-FFA/L-TyG
n = 2,847L-FFA/H-TyG
n = 586H-FFA/L-TyG
n = 1,806H-FFA/H-TyG
n = 648P value Age, y 58.6 ± 10.5 59.2±10.4 60.1 ± 11.1 57.7 ± 10.0 57.3 ± 11.4 < 0.001 Male 4,706 (79.9%) 2,327 (81.7%) 449 (76.6%) 1,455 (80.6%) 475 (73.3%) < 0.001 Acute Coronary Syndrome 2,697 (45.8%) 1,003 (35.2%) 434 (74.1%) 755 (41.8%) 505 (77.9%) < 0.001 Prior Myocardial Infartion 954 (16.2%) 474 (16.6%) 68 (11.6%) 322 (17.8%) 90 (13.9%) 0.001 Three-vessel Disease 2,565 (43.6%) 1,162 (40.8%) 240 (41.0%) 862 (47.7%) 301 (46.5%) < 0.001 Hypertension 4,046 (68.7%) 1,954 (68.6%) 415 (70.8%) 1,220 (67.6%) 457 (70.5%) 0.342 Diabetes Mellitus 2,774 (47.1%) 1,020 (35.8%) 198 (33.8%) 1,133 (62.7%) 423 (65.3%) < 0.001 Chronic Kidney Disease 101 (1.7%) 39 (1.4%) 15 (2.6%) 39 (2.2%) 8 (1.2%) 0.058 Cerebrovascular Diseases 858 (14.6%) 420 (14.8%) 91 (15.5%) 237 (13.1%) 110 (17.0%) 0.087 PVD 284 (4.8%) 144 (5.1%) 28 (4.8%) 82 (4.5%) 30 (4.6%) 0.870 Prior PCI 1,383 (23.5%) 686 (24.1%) 117 (20.0%) 459 (25.4%) 121 (18.7%) 0.001 Prior CABG 97 (1.6%) 42 (1.5%) 8 (1.4%) 42 (2.3%) 5 (0.8%) 0.029 Smoking history 3,616 (61.4%) 1,738 (61.0%) 344 (58.7%) 1,139 (63.1%) 395 (61.0%) 0.249 HFrEF 158 (2.7%) 61 (2.1%) 22 (3.8%) 42 (2.3%) 33 (5.1%) < 0.001 Successful PCI 5,795 (98.4%) 2,802 (98.4%) 580 (99.0%) 1,773 (98.2%) 640 (98.8%) 0.273 Baseline SYNTAX score 12.0 (7.0,18.0) 11.0 (7.0,17.5) 12.0 (8.0,18.5) 12.0 (7.0,18.5) 13.8 (8.5,20.5) < 0.001 Residual SYNTAX score 3.0 (0,7.0) 2.0 (0,7.0) 2.8 (0,7.0) 3.0 (0,7.5) 3.0 (0,8.0) < 0.001 TyG index 9.0 ± 0.6 8.6 ± 0.3 8.6 ± 0.4 9.5 ± 0.4 9.7 ± 0.5 < 0.001 FFA, mmol/L 0.5 (0.4,0.7) 0.5 (0.3,0,6) 1.0 (0.9,1.4) 0.5 (0.4,0.6) 1.1 (0.9,1.5) < 0.001 LDL-C, mmol/L 2.5 ± 0.9 2.3 ± 0.8 2.7 ± 0.9 2.6 ± 0.9 3.0 ± 0.9 < 0.001 Lpa, mg/dL 17.7 (7.9,40.5) 19.8 (8.7,46.6) 18.0 (9.2,38.6) 15.8 (6.8,36.2) 15.9 (7.3,35.2) < 0.001 Medications Aspirin 5,740 (97.5%) 2,769 (97.3%) 570 (97.3%) 1,768 (97.9%) 633 (97.7%) 0.403 Clopidogrel 4,610 (78.3%) 2,340 (82.2%) 402 (68.6%) 1,434 (79.4%) 434 (67.0%) < 0.001 Ticagrelor 1,470 (25.0%) 576 (20.2%) 218 (37.2%) 448 (24.8%) 228 (35.2%) < 0.001 CCB 2,543 (43.2%) 1,345 (47.2%) 201 (34.3%) 797 (44.1%) 200 (30.9%) < 0.001 ACEI/ARB 3,471 (59.0%) 1,586 (55.7%) 401 (68.4%) 1,038 (57.5%) 446 (68.8%) < 0.001 Statins 5,672 (96.3%) 2,756 (96.8%) 559 (95.4%) 1,738 (96.2%) 619 (95.5%) 0.207 Note. PVD: Peripheral Vascular Disease; PCI: Percutaneous Coronary Intervention; CABG: Coronary Artery Bypass Graft; HFrEF: Heart Failure with reduced Ejection Fraction; SYNTAX score: the Synergy Between Percutaneous Coronary Intervention with Taxus and Cardiac Surgery score; TyG: Triglyceride-Glucose index; FFA: Free Fatty Acid; LDL-C: Low Density Lipoprotein C; Lpa: Lipoprotein a; CCB: Calcium Channel Blocker; ACEI/ARB: Angiotensin-Converting Enzyme Inhibitor/ Angiotensin Receptor Blocker.  下载: 导出CSV
Table 2. Independent Associations of FFA and TyG Index With MACCE
Crude HR (95% CI) P Adjusted HR (95% CI) P FFA 1.246 (1.123–1.383) < 0.001 1.212 (1.076–1.364) 0.002 FFA < 0.81mmol/l Reference FFA ≥ 0.81 mmol/l 1.624 (1.366–1.931) < 0.001 1.492 (1.239–1.795) < 0.001 TyG 1.250 (1.104–1.416) < 0.001 1.251 (1.092–1.434) 0.001 TyG < 9.05 Reference TyG ≥ 9.05 1.298 (1.109–1.521) 0.001 1.273 (1.077–1.506) 0.005 Note. multivariable factors: gender, age, hypertension, diabetes mellitus, smoking, acute coronary syndrome, cerebrovascular diseases, chronic kidney disease, baseline SYNTAX scores;
下载: 导出CSV
Table 3. The Combined Predictive Value of TyG Index and FFA Levels for MACCE in the Overall Population
Crude HR (95% CI) P Adjusted HR (95% CI) P P for Trend L-FFA/L-TyG
n = 2,847reference < 0.001 H-FFA/L-TyG
n = 5861.308 (1.001–1.709) 0.050 1.191 (0.904–1.569) 0.215 L-FFA/H-TyG
n = 1,8061.123 (0.928–1.360) 0.233 1.117 (0.916–1.361) 0.274 H-FFA/H-TyG
n = 6482.075 (1.664–2.588) < 0.001 1.951 (1.533–2.484) < 0.001 Note. L: low; H: high; HR: hazard ratio; CI: confidence interval; HR: hazard ratio; CI: confidence interval; TyG: triglyceride-glucose index; FFA: free fatty acid; multivariable factors: gender, age, hypertension, diabetes mellitus, smoking, acute coronary syndrome, cerebrovascular diseases, chronic kidney disease, baseline SYNTAX scores; P for interact = 0.035 between TyG more vs less than 9.05 and FFA more vs less than 0.81 for MACCE.
下载: 导出CSV
Table 4. Predictive Value of TyG Index and FFA Levels for Secondary Endpoints in the Overall Population
Number of patients with
events No./total
No. (%)Crude HR (95% CI) P Adjusted HR (95% CI) P P for Trend All-cause Death L-FFA/L-TyG 33 (1.2%) reference < 0.001 H-FFA/L-TyG 18 (3.1%) 2.662 (1.499–4.728) 0.001 2.029 (1.122–3.669) 0.019 L-FFA/H-TyG 29 (1.6%) 1.388 (0.843–2.286) 0.198 1.472 (0.875–2.477) 0.145 H-FFA/H-TyG 26 (4.0%) 3.518 (2.104–5.881) < 0.001 3.443 (1.967–6.027) < 0.001 Myocardial Infarction L-FFA/L-TyG 24 (0.8%) reference 0.386 H-FFA/L-TyG 11 (1.9%) 2.244 (1.099–4.580) 0.026 1.575 (0.756–3.282) 0.225 L-FFA/H-TyG 19 (1.1%) 1.253 (0.687–2.288) 0.462 1.129 (0.604–2.111) 0.704 H-FFA/H-TyG 12 (1.9%) 2.242 (1.121–4.483) 0.022 1.512 (0.716–3.192) 0.278 Revascularization L-FFA/L-TyG 57 (2.0%) Reference 0.016 H-FFA/L-TyG 10 (1.7%) 1.100 (0.777–1.557) 0.591 1.064 (0.744–1.521) 0.736 L-FFA/H-TyG 35 (1.9%) 1.106 (0.877–1.396) 0.394 1.057 (0.831–1.345) 0.651 H-FFA/H-TyG 24 (3.7%) 1.824 (1.380–2.411) < 0.001 1.668 (1.230–2.263) 0.001 Stroke L-FFA/L-TyG 173 (6.1%) reference 0.081 H-FFA/L-TyG 39 (6.7%) 0.873 (0.446–1.712) 0.693 0.788 (0.396–1.569) 0.498 L-FFA/H-TyG 121 (6.7%) 0.961 (0.628–1.472) 0.855 1.026 (0.659–1.597) 0.909 H-FFA/H-TyG 69 (10.6%) 1.931 (1.197–3.114) 0.007 1.902 (1.128–3.207) 0.016 Cardiac Death L-FFA/L-TyG 18 (0.6%) reference 0.003 H-FFA/L-TyG 13 (2.2%) 3.530 (1.730–7.205) 0.001 2.477 (1.189–5.157) 0.015 L-FFA/H-TyG 19 (1.1%) 1.669 (0.876–3.180) 0.119 1.747 (0.891–3.427) 0.104 H-FFA/H-TyG 16 (2.5%) 3.963 (2.021–7.771) < 0.001 3.483 (1.681–7.217) 0.001 Note. multivariable factors: gender, age, hypertension, diabetes mellitus, smoking, acute coronary syndrome, cerebrovascular diseases, chronic kidney disease, baseline SYNTAX scores;
下载: 导出CSV
Table 5. Differential Association Between TyG Index and MACCE in Obese Patients with or without Hyper-FFA
Crude HR (95% CI) P Adjusted HR (95% CI) P P for trend FFA < 0.81mmol/L n = 4,653 TyG Tertile1 n = 1,263 Reference 0.166 TyG Tertile2 n = 1,707 1.170 (0.915–1.497) 0.210 1.193 (0.931–1.529) 0.163 TyG Tertile3 n = 1,683 1.217 (0.953–1.555) 0.116 1.210 (0.936–1.566) 0.146 FFA ≥ 0.81mmol/L n = 1,234 TyG Tertile1 n = 264 Reference 0.001 TyG Tertile2 n = 355 1.287 (0.800–2.070) 0.298 1.235 (0.765–1.995) 0.388 TyG Tertile3 n = 615 1.844 (1.210–2.810) 0.004 1.987 (1.276–3.095) 0.002 Note. multivariable factors: gender, age, hypertension, diabetes mellitus, smoking, acute coronary syndrome, cerebrovascular diseases, chronic kidney disease, baseline SYNTAX scores.
下载: 导出CSV
-
[1] Chooi YC, Ding C, Magkos F. The epidemiology of obesity. Metabolism, 2019; 92, 6−10. doi: 10.1016/j.metabol.2018.09.005 [2] Su SY, Liu FC. Cardiovascular health and disease report in China: two decades of progress. Biomed Environ Sci, 2025; 38, 891−2. [3] Ortega FB, Lavie CJ, Blair SN. Obesity and cardiovascular disease. Circ Res, 2016; 118, 1752−70. doi: 10.1161/CIRCRESAHA.115.306883 [4] Koskinas KC, Van Craenenbroeck EM, Antoniades C, et al. Obesity and cardiovascular disease: an ESC clinical consensus statement. Eur Heart J, 2024; 45, 4063−98. doi: 10.1093/eurheartj/ehae508 [5] Koliaki C, Liatis S, Kokkinos A. Obesity and cardiovascular disease: revisiting an old relationship. Metabolism, 2019; 92, 98−107. doi: 10.1016/j.metabol.2018.10.011 [6] Van Gaal LF, Mertens IL, De Block CE. Mechanisms linking obesity with cardiovascular disease. Nature, 2006; 444, 875−80. doi: 10.1038/nature05487 [7] Masenga SK, Kabwe LS, Chakulya M, et al. Mechanisms of oxidative stress in metabolic syndrome. Int J Mol Sci, 2023; 24, 7898. doi: 10.3390/ijms24097898 [8] Guerrero-Romero F, Simental-Mendía LE, González-Ortiz M, et al. The product of triglycerides and glucose, a simple measure of insulin sensitivity. Comparison with the euglycemic-hyperinsulinemic clamp. J Clin Endocrinol Metab, 2010; 95, 3347−51. doi: 10.1210/jc.2010-0288 [9] Du TT, Yuan G, Zhang MX, et al. Clinical usefulness of lipid ratios, visceral adiposity indicators, and the triglycerides and glucose index as risk markers of insulin resistance. Cardiovasc Diabetol, 2014; 13, 146. doi: 10.1186/s12933-014-0146-3 [10] Karpe F, Dickmann JR, Frayn KN. Fatty acids, obesity, and insulin resistance: time for a reevaluation. Diabetes, 2011; 60, 2441−9. doi: 10.2337/db11-0425 [11] Muniyappa R. Vascular insulin resistance and free fatty acids: the micro-macro circulation nexus. J Clin Endocrinol Metab, 2024; 109, e1671−2. doi: 10.1210/clinem/dgae013 [12] Simental-Mendía LE, Rodríguez-Morán M, Guerrero-Romero F. The product of fasting glucose and triglycerides as surrogate for identifying insulin resistance in apparently healthy subjects. Metab Syndr Relat Disord, 2008; 6, 299−304. doi: 10.1089/met.2008.0034 [13] WHO Expert Consultation. Appropriate body-mass index for Asian populations and its implications for policy and intervention strategies. Lancet, 2004; 363, 157−63. doi: 10.1016/S0140-6736(03)15268-3 [14] Thygesen K, Alpert JS, Jaffe AS, et al. Fourth universal definition of myocardial infarction (2018). J Am Coll Cardiol, 2018; 72, 2231−64. doi: 10.1016/j.jacc.2018.08.1038 [15] Hatano S. Experience from a multicentre stroke register: a preliminary report. Bull World Health Organ, 1976; 54, 541−53. [16] Tian X, Chen SH, Wang PL, et al. Insulin resistance mediates obesity-related risk of cardiovascular disease: a prospective cohort study. Cardiovasc Diabetol, 2022; 21, 289. doi: 10.1186/s12933-022-01729-9 [17] Huo RR, Liao Q, Zhai L, et al. Interacting and joint effects of triglyceride-glucose index (TyG) and body mass index on stroke risk and the mediating role of TyG in middle-aged and older Chinese adults: a nationwide prospective cohort study. Cardiovasc Diabetol, 2024; 23, 30. doi: 10.1186/s12933-024-02122-4 [18] Sinha R, Dufour S, Petersen K, et al. Assessment of skeletal muscle triglyceride content by 1H nuclear magnetic resonance spectroscopy in lean and obese adolescents: relationships to insulin sensitivity, total body fat, and central adiposity. Diabetes, 2002; 51, 1022−7. doi: 10.2337/diabetes.51.4.1022 [19] Grundy SM. Obesity, metabolic syndrome, and cardiovascular disease. J Clin Endocrinol Metab, 2004; 89, 2595−600. [20] Tao LC, Xu JN, Wang TT, et al. Triglyceride-glucose index as a marker in cardiovascular diseases: landscape and limitations. Cardiovasc Diabetol, 2022; 21, 68. doi: 10.1186/s12933-022-01511-x [21] Alizargar J, Bai CH, Hsieh NC, et al. Use of the triglyceride-glucose index (TyG) in cardiovascular disease patients. Cardiovasc Diabetol, 2020; 19, 8. doi: 10.1186/s12933-019-0982-2 [22] Randle PJ, Garland PB, Hales CN, et al. The glucose fatty-acid cycle its role in insulin sensitivity and the metabolic disturbances of diabetes mellitus. Lancet, 1963; 281, 785−9. doi: 10.1016/S0140-6736(63)91500-9 [23] Shulman GI. Cellular mechanisms of insulin resistance. J Clin Invest, 2000; 106, 171−6. doi: 10.1172/JCI10583 [24] Griffin ME, Marcucci MJ, Cline GW, et al. Free fatty acid-induced insulin resistance is associated with activation of protein kinase C theta and alterations in the insulin signaling cascade. Diabetes, 1999; 48, 1270−4. doi: 10.2337/diabetes.48.6.1270 [25] Samuel VT, Shulman GI. Mechanisms for insulin resistance: common threads and missing links. Cell, 2012; 148, 852−71. doi: 10.1016/j.cell.2012.02.017 [26] Bessone F, Razori MV, Roma MG. Molecular pathways of nonalcoholic fatty liver disease development and progression. Cell Mol Life Sci, 2019; 76, 99−128. doi: 10.1007/s00018-018-2947-0 [27] Cusi K. The role of adipose tissue and lipotoxicity in the pathogenesis of type 2 diabetes. Curr Diab Rep, 2010; 10, 306−15. doi: 10.1007/s11892-010-0122-6 [28] Achard CS, Laybutt DR. Lipid-induced endoplasmic reticulum stress in liver cells results in two distinct outcomes: adaptation with enhanced insulin signaling or insulin resistance. Endocrinology, 2012; 153, 2164−77. doi: 10.1210/en.2011-1881 [29] Bodenstab ML, Varghese RT, Iacobellis G. Cardio-lipotoxicity of epicardial adipose tissue. Biomolecules, 2024; 14, 1465. doi: 10.3390/biom14111465 [30] DeFronzo RA. Insulin resistance, lipotoxicity, type 2 diabetes and atherosclerosis: the missing links. The Claude Bernard Lecture 2009. Diabetologia, 2010; 53, 1270−87. doi: 10.1007/s00125-010-1684-1 [31] Shojaee-Moradie F, Baynes KCR, Pentecost C, et al. Exercise training reduces fatty acid availability and improves the insulin sensitivity of glucose metabolism. Diabetologia, 2007; 50, 404−13. doi: 10.1007/s00125-006-0498-7 [32] Rubino F, Cummings DE, Eckel RH, et al. Definition and diagnostic criteria of clinical obesity. Lancet Diabetes Endocrinol, 2025; 13, 221−62. doi: 10.1016/S2213-8587(24)00316-4 [33] Powell-Wiley TM, Poirier P, Burke LE, et al. Obesity and cardiovascular disease: a scientific statement from the American Heart Association. Circulation, 2021; 143, e984−1010. -

 点击查看大图
计量
- 文章访问数: 31
- HTML全文浏览量: 16
- PDF下载量: 0
- 被引次数: 0

 Quick Links