

 下载:
下载:


-
Lipoprotein (a) [Lp(a)] is a kind of mainly genetically determined lipoprotein particles with a LDL-like structure linked to apolipoprotein (a) [apo(a)][1]. Apart from the effect similar to low-density lipoprotein cholesterol (LDL-C), the prothrombotic and proinflammatory effect of Lp(a) also lead to its atherogenic property[2-4]. Large epidemiological and genetic studies have suggested that high level of Lp(a) was a risk factor for atherosclerotic cardiovascular disease (CVD) including stable angina pectoris, myocardial infarction, aortic stenosis, and stroke[5-8]. There is considerable ethnic heterogeneity in regard of plasma Lp(a) concentrations. For Caucasians, the cut-off value of significant risk was recommended as 50 mg/dL, whereas it is usually 30 mg/dL for Chinese population considering the far lower level in Chinese[9, 10]. Moreover, previous studies also suggested that Lp(a) concentration and its LPA gene variants were correlated with multivessel lesions of coronary artery disease (CAD)[11]. However, large-sample study with respect to the association of Lp(a) level and severity of CAD were still few in Chinese population.
Since there are limited therapeutic options for lowering plasma Lp(a), the main strategy in the clinical practice is focusing on other atherogenic lipid profiles, especially LDL-C, which is still the main treatment target recommended by guidelines[10, 12]. Though LDL-C has been recognized as one of the major risk factors for CAD, the residual risk for CAD despite of intensive statin therapy indicates the important role of other factors including Lp(a)[13]. Therefore, whether the simultaneous elevations of Lp(a) and LDL-C will bring higher risk for the presence and severity of CAD is worth exploring.
Thus, in the current study we investigated the role of Lp(a) in the presence and severity of CAD for patients undergoing coronary angiography (CAG). Besides, whether the predictive value of Lp(a) for CAD was enhanced by the combination of LDL-C was examined.
-
This cross-sectional study consecutively recruited patients admitted for diagnostic/ interventional CAG due to angina- like chest pain and/or positive treadmill exercise test or suspicion of CAD in the division of dyslipidemia of Fu Wai Hospital from October 2012 to April 2017. Patients were included if they met: 1) no use of statins or other lipid lowering drugs for at least 3 months prior to the study; 2) age ≥ 18 years old; 3) with complete medical records; 4) with Lp(a) level measurement. Besides, patients with severe liver dysfunction (alanine transaminase > 3 times upper normal limit), severe renal dysfunction (plasma creatinine > 132 μmol/L), familial hypercholesterolemia, acute coronary syndrome, thyroid dysfunction, heart failure (left ventricle ejection fraction < 45%), infectious inflammatory diseases, autoimmune disease, pregnancy and malignant tumor were excluded. Finally, a total of 1, 980 patients were enrolled into the current study. The main demographic and clinical data were obtained from medical records.
Our study conducted according to the Declaration of Helsinki and was approved by the hospital's ethical review board (Fu Wai Hospital & National Center for Cardiovascular Diseases, Beijing, China). Informed written consents were obtained from all the participants.
-
Blood samples of all patients were collected from cubital vein after fasting for at least 12 h upon admission. All the biochemical measurements were conducted in the clinical chemistry department of Fu Wai hospital. The concentrations of the serum total cholesterol (TC), triglyceride (TG), high-density lipoprotein cholesterol (HDL-C), and LDL-C were measured using an enzymatic assay by automatic biochemistry analyzer (Hitachi 7150, Tokyo, Japan), while apoA, apolipoprotein (apoB) were measured using a turbidimetric immunoassay. Lp(a) levels were assayed by an immunoturbidimetry method according to the manufacturer's guide as described in our previous study[14], a latex turbidimetric method [LASAY Lp(a) auto; SHIMA laboratories] with its normal reference value less than 300 mg/L. Other related biochemical and hematological indicators were measured according to standard tests.
-
The diagnosis of CAD was defined as the presence of coronary lesions ≥ 50% in at least one major coronary artery assessed by CAG with the analysis of at least two experienced interventional physicians. What's more, Gensini score (GS) was used to assess the severity of coronary lesions[15]. According to GS system, the narrowing was scored as 1 point for 1%-25%, 2 for 26%-50%, 4 for 76%-90%, 16 for 91%-99%, and 32 for 100% occluded artery. Then the score was multiplied depending on the functional significance of each segment: × 5.0 for left main coronary artery (LM), × 2.5 for proximal left anterior descending artery (LAD) and proximal left circumflex artery (LCX), × 1.5 for middle LAD, × 1.0 for distal LAD, mid-distal LCX and right coronary artery (RCA), × 0.5 for residual major segments.
-
Continuous variables were presented as mean ± standard deviation (SD) if normally distributed and median (Q1-Q3 quartiles) otherwise, while categorical variables were shown as number (percentage). The differences of clinical characteristics and biochemical parameters among groups were assessed using Student's t test, Mann-Whitney U test or analysis of variance (ANOVA) appropriately for continuous variables or χ2 test for categorical ones. Univariable and multivariable logistic regression analysis were performed to determine the odds ratios (OR) and 95% confidential interval (CI) of Lp(a) for presence of CAD as well as high GS, adjusted by potential confounding factors such as male, age, smoke, diabetes mellitus (DM) and hypertension (HT). A P < 0.05 was considered as significantly different. The statistical analysis was performed with SPSS version 21.0 software (SPSS Inc., Chicago Illinois, USA).
-
The characteristics of the study population according to CAD were shown in Table 1. A total of 1, 980 patients were recruited including 1,162 patients with CAD (58.7%) and 818 patients without CAD (41.3%) determined by CAG. The average age of the patients with and without CAD was 58 ± 10 and 53 ± 11 years old respectively. There were more men diagnosed with CAD than non-CAD group (69.5% vs. 48.9%, P < 0.001). Patients with CAD had significantly higher prevalence of HT, DM, current smokers, and alcohol drinkers. What's more, the mean level of Lp(a), LDL-C, non-HDL-C, apoB, and glucose were significantly higher and levels of HDL-C, apoA were significantly lower in the group of patients with CAD compared to non-CAD group (all P < 0.05).
Table 1. Baseline Characteristics of Study Population
Variables Overall
n = 1,980Non-CAD
n = 818CAD
n = 1,162P-value Age, year 56 ± 11 53 ± 11 58 ± 10 < 0.001 Men, n (%) 1, 208 (61%) 400 (48.9%) 808 (69.5%) < 0.001 HT, n (%) 1, 097 (55.4%) 343 (41.9%) 754 (64.9%) < 0.001 DM, n (%) 378 (19.1%) 84 (10.3%) 294 (25.3%) < 0.001 Current smoking, n (%) 616 (31.1%) 196 (24%) 420 (36.1%) < 0.001 Alcohol drinker, n (%) 355 (17.9%) 116 (14.2%) 239 (20.6%) < 0.001 Family history of CVD, n (%) 446 (22.5%) 167 (20.4%) 279 (24%) 0.059 Glucose, mmol/L 5.59 ± 1.52 5.26 ± 1.19 5.82 ± 1.68 < 0.001 BMI, kg/(m2) 25.68 ± 3.47 25.36 ± 3.62 25.90 ± 3.35 0.001 TC, mmol/L 4.83 ± 0.98 4.79 ± 1.00 4.85 ± 0.96 0.139 HDL-C, mmol/L 1.10 ± 0.33 1.13 ± 0.36 1.09 ± 0.31 0.017 LDL-C, mmol/L 3.15 ± 0.89 3.07 ± 0.91 3.20 ± 0.87 0.001 Non-HDL-C, mmol/L 3.72 ± 0.93 3.66 ± 0.94 3.77 ± 0.92 0.015 Apo A, g/L 1.35 ± 0.29 1.37 ± 0.30 1.33 ± 0.29 0.002 Apo B, g/L 1.03 ± 0.25 1.00 ± 0.25 1.05 ± 0.25 < 0.001 TG, mmol/L 1.57 (1.15-2.27) 1.53 (1.12-2.21) 1.61 (1.16-2.30) 0.184 Lp(a), mg/L 121.02 (58.75-279.67) 110.59 (56.60-254.40) 129.95 (60.60-295.70) 0.037 Note. Data are expressed as mean ± SD, median (25th-75th percentile) or n (%). Bold values indicate statistical significance. CAD: coronary artery disease; HT: hypertension; DM: diabetes mellitus; BMI: body mass index; TC: Total cholesterol; HDL-C: HDL cholesterol; LDL-C: LDL cholesterol; non-HDL-C: non-HDL cholesterol; Apo A: apolipoprotein A; Apo B: apolipoprotein B; TG: Triglyceride; Lp(a): Lipoprotein (a). -
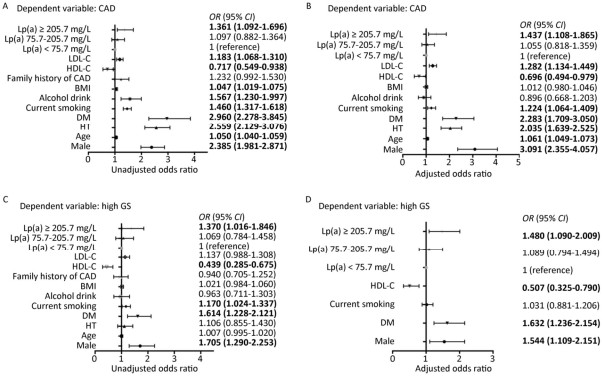
Patients with CAD had significantly higher level of Lp(a) than those without CAD (P = 0.037). Further, patients with CAD (n = 1,162) were divided in to three groups according to GS tertiles (Table 2). The Lp(a) concentration was highest in the third tertile of GS. On the other hand, when the study subjects were classified into three groups according to Lp(a) tertiles (Table 3), we found that patients with highest tertile of Lp(a) [Lp(a) ≥ 205.7 mg/L] also had the highest GS. In addition, the group of the highest tertile of Lp(a) showed more prevalence of CAD, current smoking and higher level of TC, HDL-C, LDL-C, non-HDL-C, and ApoB. Univariate and Multivariate logistic regression analyses were used to explore the association of Lp(a) and CAD as shown in Figure 1. After adjustment, patients with Lp(a) ≥ 205.7 mg/L had 1.437 (95% CI: 1.108-1.865, P = 0.006) and 1.480 (95% CI: 1.090-2.009, P = 0.012) fold of risk for presence and severity of CAD respectively comparing with the lowest tertile.
Table 2. Clinical Characteristics According to Gensini Score Tertiles in Patients with CAD
Variables T1 T2 T3 P-value GS < 14 GS 14-38 GS ≥ 38 Age, year 58 ± 10 58 ± 10 59 ± 10 0.541 Men, n (%) 235 (60.3%) 276 (71.7%) 297 (76.7%) < 0.001 HT, n (%) 246 (63.1%) 251 (65.2%) 257 (66.4%) 0.616 DM, n (%) 74 (19%) 98 (25.5%) 122 (31.5%) < 0.001 Current smoking, n (%) 126 (32.3%) 140 (36.4%) 154 (39.8%) 0.008 Alcohol drinker, n(%) 83 (21.3%) 78 (20.3%) 78 (20.2%) 0.912 Family history of CVD, n (%) 87 (22.3%) 102 (26.5%) 90 (23.3%) 0.360 Glucose, mmol/L 5.69 ± 1.45 5.80 ± 1.74 5.98 ± 1.82 0.054 BMI, kg/(m2) 25.81 ± 3.26 25.83 ± 3.62 26.06 ± 3.17 0.540 TC, mmol/L 4.91 ± 0.90 4.79 ± 1.01 4.86 ± 0.96 0.201 HDL-C, mmol/L 1.15 ± 0.35** 1.07 ± 0.28 1.04 ± 0.29 < 0.001 LDL-C, mmol/L 3.21 ± 0.79 3.13 ± 0.91 3.27 ± 0.90 0.084 Non-HDL-C, mmol/L 3.76 ± 0.85 3.72 ± 0.97 3.82 ± 0.92 0.256 Apo A, g/L 1.39 ± 0.30** 1.32 ± 0.28 1.29 ± 0.26 < 0.001 Apo B, g/L 1.06 ± 0.25 1.04 ± 0.26 1.06 ± 0.25 0.298 TG, mmol/L 1.54 (1.10-2.23) 1.59 (1.19-2.26) 1.67 (1.23-2.35) 0.146 Lp(a), mg/L 118.32 (56.51-260.60)* 133.58 (60.01-280.90) 144.54 (66.90-355.46) 0.042 Note. Data are expressed as mean ± SD, median (25th-75th percentile) or n (%). Bold values indicate statistical significance. CAD: coronary artery disease; HT: hypertension; DM: diabetes mellitus; BMI: body mass index; TC: Total cholesterol; HDL-C: HDL cholesterol; LDL-C: LDL cholesterol; non-HDL-C: non-HDL cholesterol; Apo A: apolipoprotein A; Apo B: apolipoprotein B; TG: Triglyceride; Lp(a): Lipoprotein (a).*P < 0.05 vs. T3, **P < 0.05 vs. T2 and T3. Table 3. Clinical Characteristics According to Lp(a) Tertiles of all Patients
Variables T1 T2 T3 P-value < 75.7 mg/L 75.7-205.7 mg/L ≥ 205.7 mg/L Age, year 55 ± 10** 57 ± 11 56 ± 11 < 0.001 Men, n (%) 440 (66.7%) 388 (58.8%) 380 (57.6%) 0.001 CAD, n (%) 366 (55.5%) 381 (57.7%) 415 (62.9%) 0.019 HT, n (%) 375 (56.8%) 351 (53.2%) 371 (56.2%) 0.363 DM, n (%) 125 (18.9%) 126 (19.1%) 127 (19.2%) 0.990 Current smoking, n (%) 237 (35.9%) 191 (28.9%) 188 (28.5%) 0.008 Alcohol drinker, n (%) 130 (19.7%) 119 (18.0%) 106 (16.1%) 0.226 Family history of CVD, n (%) 149 (22.6%) 147 (22.3%) 150 (22.7%) 0.980 Glucose, mmol/L 5.67 ± 1.66 5.59 ± 1.41 5.52 ± 1.48 0.224 BMI, kg/(m2) 26.00 ± 3.48* 25.79 ± 3.57* 25.24 ± 3.32 < 0.001 TC, mmol/L 4.66 ± 0.95** 4.83 ± 0.98* 4.99 ± 0.98 < 0.001 HDL-C, mmol/L 1.07 ± 0.31* 1.09 ± 0.30* 1.15 ± 0.38 < 0.001 LDL-C, mmol/L 2.93 ± 0.85** 3.18 ± 0.88* 3.33 ± 0.89 < 0.001 Non-HDL-C, mmol/L 3.60 ± 0.91** 3.74 ± 0.92 3.83 ± 0.93 < 0.001 Apo A, g/L 1.33 ± 0.28 1.35 ± 0.28 1.36 ± 0.31 0.153 Apo B, g/L 0.98 ± 0.25** 1.03 ± 0.25* 1.08 ± 0.26 < 0.001 TG, mmol/L 1.71 (1.19-2.60)** 1.57 (1.17-2.21)* 1.48 (1.09-2.06) < 0.001 GS 8.00 (0.00-26.00)* 8.00 (0.00-30.00)* 12.50 (0.00-38.00) 0.001 Note. Data are expressed as mean ± SD, median (25th-75th percentile) or n (%). Bold values indicate statistical significance. CAD: coronary artery disease; HT: hypertension; DM: diabetes mellitus; BMI: body mass index; TC: Total cholesterol; HDL-C: HDL cholesterol; LDL-C: LDL cholesterol; non-HDL-C: non-HDL cholesterol; Apo A: apolipoprotein A; Apo B: apolipoprotein B; TG: Triglyceride; Lp(a): Lipoprotein (a); GS: gensini score. *P < 0.05 vs. T3, **P < 0.05 vs. T2 and T3. 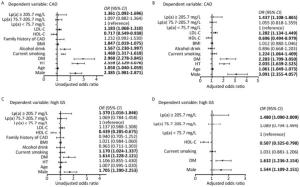
Figure 1. Analysis of Lp(a) as a risk factor for CAD (A, B) and high GS (C, D). Univariate (A, C) and multivariate (B, D) logistic regression analyses were used. Bold values indicate statistical significance. CAD: coronary artery disease; GS: gensini score; HT: hypertension; DM: diabetes mellitus; BMI: body mass index; HDL-C: HDL cholesterol; LDL-C: LDL cholesterol; Lp(a): Lipoprotein (a).
-
Although there was significantly increasing level of LDL-C according to Lp(a) tertiles, there was no high correlation of LDL-C with Lp(a) in patients with CAD (r = 0.18, P < 0.001). Taking 3.36 mmol/L and 2.31 [Lp(a) ≥ 205.7 mg/L] as cut-off value of LDL-C and log Lp(a), the scatterplots showed that the distribution of Lp(a) and LDL-C was not well concordant (Figure 2). Only 15.6% of patients and 41.5% patients showed concomitantly high and low level of Lp(a) and LDL-C respectively, while 42.9% patients with discordant levels. So we explored the influence of the four subgroups on the presence and severity of CAD (Table 4). Compared with the patients with both low level of LDL-C and Lp(a), patients with sole high LDL-C, sole high Lp(a) and both high level of LDL-C and Lp(a) had gradually increasing risk for CAD (OR = 1.398, OR = 1.558, and OR = 1.845, respectively, all P < 0.005). However, the predictive value of LDL-C and Lp(a) was slightly different with high GS. The subgroups with sole high Lp(a) and both high level of LDL-C and Lp(a) had significantly increased risk for high GS (OR= 1.563, OR= 1.736, respectively, all P < 0.005). In any case, patients with both high level of LDL-C and Lp(a) had the highest risk for presence and severity of CAD.
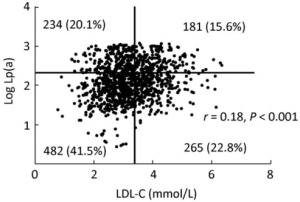
Figure 2. Distribution of Lp(a) and LDL-C in patients with CAD. Lp(a) is logarithmically transformed before analysis. Cut-off value of LDL-C and log Lp(a) was 3.36 mmol/L and 2.31 [Lp(a) 205.7 mg/L] respectively.
Table 4. Predictive Value of Combination of Lp(a) and LDL-C for CAD and High GS
Models Low LDL-C + low Lp(a) High LDL-C + low Lp(a) Low LDL-C + High Lp(a) High LDL-C + High Lp(a) CAD Model 1 OR 1 (reference) 1.200 (0.952-1.513) 1.353 (1.056-1.734) 1.419 (1.077-1.869) P 0.122 0.017 0.013 Model 2 OR 1 (reference) 1.372 (1.071-1.758) 1.467 (1.123-1.917) 1.672 (1.244-2.249) P 0.012 0.005 0.001 Model 3 OR 1 (reference) 1.398 (1.070-1.827) 1.558 (1.163-2.088) 1.845 (1.339-2.541) P 0.014 0.003 < 0.001 High GS Model 1 OR 1 (reference) 1.167 (0.846-1.610) 1.415 (1.018-1.965) 1.380 (0.963-1.976) P 0.347 0.039 0.079 Model 2 OR 1 (reference) 1.290 (0.930-1.790) 1.484 (1.064-2.071) 1.519 (1.054-2.189) P 0.127 0.020 0.025 Model 3 OR 1 (reference) 1.360 (0.967-1.915) 1.563 (1.103-2.215) 1.736 (1.188-2.538) P 0.077 0.012 0.004 Note. Multivariate logistic regression analyses were used. Bold values indicate statistical significance. Model 1: unadjusted; Model 2: Age- and sex-adjusted; Model 3: fully adjusted for age, male, HT, DM, smoke, drink, HDL-C, BMI and family history of CAD. CAD: coronary artery disease; Lp(a): Lipoprotein (a); LDL-C: LDL cholesterol; GS: gensini score. The cut-off value of Lp(a) and LDL-C were 205.7 mg/L and 3.36 mmol/L, respectively. -
Our study supported that high level of Lp(a) was a useful marker for predicting the presence and severity of CAD in untreated Chinese patients undergoing CAG. More importantly, patients with both elevated level of Lp(a) and LDL-C exerted the highest risk, suggesting that more aggressive lipid- lowering strategy might be needed for such kind of patients.
It has been demonstrated that Lp(a) is a reliable predictor for the development of CAD[16, 17]. A recent large-scare meta-analysis conducted by Erqou et al. included 36 prospective studies with 126, 634 individuals and confirmed the modest but strong risk for CVD caused by elevated Lp(a), especially with a level of Lp(a) ≥ 240 mg/L[18]. Similar results were shown in Chinese study. Cai DP et al. conducted a cross-sectional study including 3, 462 CAD cases, among which 1, 304 patients were initial ischemic heart disease[19]. They found that Lp(a) ≥ 204 mg/L lead to 1.586 fold risk of initial ischemic heart disease compared to Lp(a) ≤ 28 mg/L. Consistent with these reported studies, our data showed that the highest tertile of Lp(a) [Lp(a) ≥ 205.7 mg/L] increased the risk for presence of CAD by 1.44 fold compared to the lowest tertile significantly and independently. Of note, since the Lp(a) concentration is much lower in Chinese population than the Caucasians which may be explained by the LPA gene polymorphism across ethnics[20], we choose the highest tertile instead of 500 mg/L as cut-off value. Interestingly, though the association of Lp(a) with incidence of CAD has been proved from different levels of evidence, the effect of Lp(a) on the cardiovascular outcome is still controversial. Recently Zewinger et al. recruited 3, 313 patients with established coronary heart disease with a median follow-up of 9.9 years, finding that there was no association between Lp(a) concentration as well as genetic variants with mortality[21]. Nevertheless, O'Donoghue et al. integrated three studies including 6, 762 patients and found that the prognostic value of Lp(a) for cardiovascular events was only certainly significant when average LDL-C ≥ 130 mg/dL (OR = 1.46, 95% CI: 1.23-1.73, P < 0.001)[22]. Furthermore, role of Lp(a) in the manifestation of CAD deserved concerning.
The relation of Lp(a) to the severity of CAD has less been investigated and also limited by small sample size[23-25]. From this point of view, our data firstly demonstrated that elevated Lp(a) concentration was not only associated with the presence of CAD but also the severity of CAD assessed by GS using a large Chinese cohort who did not receive lipid-lowering drugs. Interestingly, previous studies indicated that Lp(a) was associated with three-vessel and left main coronary lesions while some did not[26]. At least, the method for assessing the severity of CAD in their study might need supplements. Accordingly, in the present study, we applied GS system for examining the relationship between Lp(a) and the severity of CAD. As we already know, GS is well recognized as a powerful tool to reflect the severity of coronary lesions and assess the cardiovascular outcome[27]. Thereby, our data with large sample size might provide additional and more important information with regard to the potential association of Lp(a) with the coronary severity in patients with CAD.
Previous studies have suggested that high Lp(a) is strongly associated with high LDL-C and their interactions conferred greater risk in specific populations including patients with premature acute coronary syndrome and stent placement[28, 29], while the associations failed to be confirmed in general population[30]. But the role of this action in the population group of stable CAD has less been investigated. As the distribution of LDL-C and Lp(a) was not well consistent in spite of a significant correlation between them, we investigated the contribution of concomitant high level of Lp(a) and LDL-C to the risk of CAD and its severity, finding that their synergistic effect represented the highest risk. Moreover, we demonstrated that the high level of Lp(a) still increased the risk for the presence and severity of CAD when LDL-C was below 3.36 mmol/L. Hence, we should also pay intensive attentions on the management of Lp(a) and LDL-C lowering to the individuals with high Lp(a) in spite of LDL-C < 3.36 mmol/L.
Although the role of Lp(a) in the development of CAD is well recognized, there are few efficient approaches to reduce Lp(a) in the routine clinical practice[31]. LDL-C is still no doubt the first target of treatment. Fortunately, proprotein convertase subtilisin/kexin type 9 (PCSK9) inhibitors and lipoprotein apheresis are emerging available interventions for lowering Lp(a). PCSK9 inhibitors, which decrease the degradation of LDLR, could reduce the Lp(a) level by 20%-30%[32]. A recent study reported that long-term lipoprotein apheresis decreases major cardiovascular events in people with Lp(a) hyperlipoproteinemia[33]. Our current study again verified that these intense treatments were warranted for patients at high risk for CAD with both high level of LDL-C and Lp(a).
Nevertheless, there were several limitations in the present study. First, our study was a cross-sectional study and further association between Lp(a) and CAD should be explored by prospective studies. Second, single center study may be another limitation. Third, apo(a) isoforms were not available in the present study to exclude the influence of apo(a) isoform size heterogeneity.
In conclusion, in this sizable Chinese cohort study, we enrolled 1, 980 untreated patients undergoing CAG and examined the relation of plasma Lp(a) level to the severity of CAD and LDL-C. Data has suggested that Lp(a) is strongly associated with the presence and severity of CAD, especially combined with LDL-C in Chinese patients. No doubt, our study added more information into the area concerning the relation of Lp(a) to CAD, indicating that more aggressive lipid-lowering treatments may be needed for patients with both high level of Lp(a) and LDL-C.
-
No conflict of interest to declare.
doi: 10.3967/bes2018.033
Lipoprotein (a) as a Marker for Predicting the Presence and Severity of Coronary Artery Disease in Untreated Chinese Patients Undergoing Coronary Angiography
-
Abstract:
Objective Low-density lipoprotein cholesterol (LDL-C) has been well known as the risk factor of coronary artery disease (CAD). However, the role of lipoprotein (a)[Lp(a)] in the development of CAD is of great interest but still controversial. Thus, we aim to explore the effect of Lp(a) on predicting the presence and severity of CAD in Chinese untreated patients, especially in combination with LDL-C. Methods We consecutively recruited 1, 980 non-treated patients undergoing coronary angiography, among which 1,162 patients were diagnosed with CAD. Gensini score (GS) was used to assess the severity of CAD. Lp(a) was measured by immunoturbidimetric method. Results Patients with CAD had higher level of LDL-C and Lp(a) compared with non-CAD (P < 0.05). Multivariable logistic regression revealed that Lp(a) > 205 mg/L (highest tertile) predicted 1.437-fold risk for CAD (95% CI:1.108-1.865, P=0.006) and 1.480-fold risk for high GS (95% CI:1.090-2.009, P=0.012) respectively. Interestingly, concomitant elevated level of Lp(a) and LDL-C conferred the highest risk for both presence[OR=1.845, 95% CI:1.339-2.541, P < 0.001] and severity[OR=1.736, 95% CI:1.188-2.538, P=0.004] of CAD. Conclusion Lipoprotein (a) is a useful marker for predicting the presence and severity of CAD, especially combined with LDL-C. -
Key words:
- Lipoprotein (a) /
- LDL-C /
- Coronary artery disease /
- Chinese
-
Figure 1. Analysis of Lp(a) as a risk factor for CAD (A, B) and high GS (C, D). Univariate (A, C) and multivariate (B, D) logistic regression analyses were used. Bold values indicate statistical significance. CAD: coronary artery disease; GS: gensini score; HT: hypertension; DM: diabetes mellitus; BMI: body mass index; HDL-C: HDL cholesterol; LDL-C: LDL cholesterol; Lp(a): Lipoprotein (a).
Figure 2. Distribution of Lp(a) and LDL-C in patients with CAD. Lp(a) is logarithmically transformed before analysis. Cut-off value of LDL-C and log Lp(a) was 3.36 mmol/L and 2.31 [Lp(a) 205.7 mg/L] respectively.
Table 1. Baseline Characteristics of Study Population
Variables Overall
n = 1,980Non-CAD
n = 818CAD
n = 1,162P-value Age, year 56 ± 11 53 ± 11 58 ± 10 < 0.001 Men, n (%) 1, 208 (61%) 400 (48.9%) 808 (69.5%) < 0.001 HT, n (%) 1, 097 (55.4%) 343 (41.9%) 754 (64.9%) < 0.001 DM, n (%) 378 (19.1%) 84 (10.3%) 294 (25.3%) < 0.001 Current smoking, n (%) 616 (31.1%) 196 (24%) 420 (36.1%) < 0.001 Alcohol drinker, n (%) 355 (17.9%) 116 (14.2%) 239 (20.6%) < 0.001 Family history of CVD, n (%) 446 (22.5%) 167 (20.4%) 279 (24%) 0.059 Glucose, mmol/L 5.59 ± 1.52 5.26 ± 1.19 5.82 ± 1.68 < 0.001 BMI, kg/(m2) 25.68 ± 3.47 25.36 ± 3.62 25.90 ± 3.35 0.001 TC, mmol/L 4.83 ± 0.98 4.79 ± 1.00 4.85 ± 0.96 0.139 HDL-C, mmol/L 1.10 ± 0.33 1.13 ± 0.36 1.09 ± 0.31 0.017 LDL-C, mmol/L 3.15 ± 0.89 3.07 ± 0.91 3.20 ± 0.87 0.001 Non-HDL-C, mmol/L 3.72 ± 0.93 3.66 ± 0.94 3.77 ± 0.92 0.015 Apo A, g/L 1.35 ± 0.29 1.37 ± 0.30 1.33 ± 0.29 0.002 Apo B, g/L 1.03 ± 0.25 1.00 ± 0.25 1.05 ± 0.25 < 0.001 TG, mmol/L 1.57 (1.15-2.27) 1.53 (1.12-2.21) 1.61 (1.16-2.30) 0.184 Lp(a), mg/L 121.02 (58.75-279.67) 110.59 (56.60-254.40) 129.95 (60.60-295.70) 0.037 Note. Data are expressed as mean ± SD, median (25th-75th percentile) or n (%). Bold values indicate statistical significance. CAD: coronary artery disease; HT: hypertension; DM: diabetes mellitus; BMI: body mass index; TC: Total cholesterol; HDL-C: HDL cholesterol; LDL-C: LDL cholesterol; non-HDL-C: non-HDL cholesterol; Apo A: apolipoprotein A; Apo B: apolipoprotein B; TG: Triglyceride; Lp(a): Lipoprotein (a).  下载: 导出CSV
Table 2. Clinical Characteristics According to Gensini Score Tertiles in Patients with CAD
Variables T1 T2 T3 P-value GS < 14 GS 14-38 GS ≥ 38 Age, year 58 ± 10 58 ± 10 59 ± 10 0.541 Men, n (%) 235 (60.3%) 276 (71.7%) 297 (76.7%) < 0.001 HT, n (%) 246 (63.1%) 251 (65.2%) 257 (66.4%) 0.616 DM, n (%) 74 (19%) 98 (25.5%) 122 (31.5%) < 0.001 Current smoking, n (%) 126 (32.3%) 140 (36.4%) 154 (39.8%) 0.008 Alcohol drinker, n(%) 83 (21.3%) 78 (20.3%) 78 (20.2%) 0.912 Family history of CVD, n (%) 87 (22.3%) 102 (26.5%) 90 (23.3%) 0.360 Glucose, mmol/L 5.69 ± 1.45 5.80 ± 1.74 5.98 ± 1.82 0.054 BMI, kg/(m2) 25.81 ± 3.26 25.83 ± 3.62 26.06 ± 3.17 0.540 TC, mmol/L 4.91 ± 0.90 4.79 ± 1.01 4.86 ± 0.96 0.201 HDL-C, mmol/L 1.15 ± 0.35** 1.07 ± 0.28 1.04 ± 0.29 < 0.001 LDL-C, mmol/L 3.21 ± 0.79 3.13 ± 0.91 3.27 ± 0.90 0.084 Non-HDL-C, mmol/L 3.76 ± 0.85 3.72 ± 0.97 3.82 ± 0.92 0.256 Apo A, g/L 1.39 ± 0.30** 1.32 ± 0.28 1.29 ± 0.26 < 0.001 Apo B, g/L 1.06 ± 0.25 1.04 ± 0.26 1.06 ± 0.25 0.298 TG, mmol/L 1.54 (1.10-2.23) 1.59 (1.19-2.26) 1.67 (1.23-2.35) 0.146 Lp(a), mg/L 118.32 (56.51-260.60)* 133.58 (60.01-280.90) 144.54 (66.90-355.46) 0.042 Note. Data are expressed as mean ± SD, median (25th-75th percentile) or n (%). Bold values indicate statistical significance. CAD: coronary artery disease; HT: hypertension; DM: diabetes mellitus; BMI: body mass index; TC: Total cholesterol; HDL-C: HDL cholesterol; LDL-C: LDL cholesterol; non-HDL-C: non-HDL cholesterol; Apo A: apolipoprotein A; Apo B: apolipoprotein B; TG: Triglyceride; Lp(a): Lipoprotein (a).*P < 0.05 vs. T3, **P < 0.05 vs. T2 and T3.
下载: 导出CSV
Table 3. Clinical Characteristics According to Lp(a) Tertiles of all Patients
Variables T1 T2 T3 P-value < 75.7 mg/L 75.7-205.7 mg/L ≥ 205.7 mg/L Age, year 55 ± 10** 57 ± 11 56 ± 11 < 0.001 Men, n (%) 440 (66.7%) 388 (58.8%) 380 (57.6%) 0.001 CAD, n (%) 366 (55.5%) 381 (57.7%) 415 (62.9%) 0.019 HT, n (%) 375 (56.8%) 351 (53.2%) 371 (56.2%) 0.363 DM, n (%) 125 (18.9%) 126 (19.1%) 127 (19.2%) 0.990 Current smoking, n (%) 237 (35.9%) 191 (28.9%) 188 (28.5%) 0.008 Alcohol drinker, n (%) 130 (19.7%) 119 (18.0%) 106 (16.1%) 0.226 Family history of CVD, n (%) 149 (22.6%) 147 (22.3%) 150 (22.7%) 0.980 Glucose, mmol/L 5.67 ± 1.66 5.59 ± 1.41 5.52 ± 1.48 0.224 BMI, kg/(m2) 26.00 ± 3.48* 25.79 ± 3.57* 25.24 ± 3.32 < 0.001 TC, mmol/L 4.66 ± 0.95** 4.83 ± 0.98* 4.99 ± 0.98 < 0.001 HDL-C, mmol/L 1.07 ± 0.31* 1.09 ± 0.30* 1.15 ± 0.38 < 0.001 LDL-C, mmol/L 2.93 ± 0.85** 3.18 ± 0.88* 3.33 ± 0.89 < 0.001 Non-HDL-C, mmol/L 3.60 ± 0.91** 3.74 ± 0.92 3.83 ± 0.93 < 0.001 Apo A, g/L 1.33 ± 0.28 1.35 ± 0.28 1.36 ± 0.31 0.153 Apo B, g/L 0.98 ± 0.25** 1.03 ± 0.25* 1.08 ± 0.26 < 0.001 TG, mmol/L 1.71 (1.19-2.60)** 1.57 (1.17-2.21)* 1.48 (1.09-2.06) < 0.001 GS 8.00 (0.00-26.00)* 8.00 (0.00-30.00)* 12.50 (0.00-38.00) 0.001 Note. Data are expressed as mean ± SD, median (25th-75th percentile) or n (%). Bold values indicate statistical significance. CAD: coronary artery disease; HT: hypertension; DM: diabetes mellitus; BMI: body mass index; TC: Total cholesterol; HDL-C: HDL cholesterol; LDL-C: LDL cholesterol; non-HDL-C: non-HDL cholesterol; Apo A: apolipoprotein A; Apo B: apolipoprotein B; TG: Triglyceride; Lp(a): Lipoprotein (a); GS: gensini score. *P < 0.05 vs. T3, **P < 0.05 vs. T2 and T3.
下载: 导出CSV
Table 4. Predictive Value of Combination of Lp(a) and LDL-C for CAD and High GS
Models Low LDL-C + low Lp(a) High LDL-C + low Lp(a) Low LDL-C + High Lp(a) High LDL-C + High Lp(a) CAD Model 1 OR 1 (reference) 1.200 (0.952-1.513) 1.353 (1.056-1.734) 1.419 (1.077-1.869) P 0.122 0.017 0.013 Model 2 OR 1 (reference) 1.372 (1.071-1.758) 1.467 (1.123-1.917) 1.672 (1.244-2.249) P 0.012 0.005 0.001 Model 3 OR 1 (reference) 1.398 (1.070-1.827) 1.558 (1.163-2.088) 1.845 (1.339-2.541) P 0.014 0.003 < 0.001 High GS Model 1 OR 1 (reference) 1.167 (0.846-1.610) 1.415 (1.018-1.965) 1.380 (0.963-1.976) P 0.347 0.039 0.079 Model 2 OR 1 (reference) 1.290 (0.930-1.790) 1.484 (1.064-2.071) 1.519 (1.054-2.189) P 0.127 0.020 0.025 Model 3 OR 1 (reference) 1.360 (0.967-1.915) 1.563 (1.103-2.215) 1.736 (1.188-2.538) P 0.077 0.012 0.004 Note. Multivariate logistic regression analyses were used. Bold values indicate statistical significance. Model 1: unadjusted; Model 2: Age- and sex-adjusted; Model 3: fully adjusted for age, male, HT, DM, smoke, drink, HDL-C, BMI and family history of CAD. CAD: coronary artery disease; Lp(a): Lipoprotein (a); LDL-C: LDL cholesterol; GS: gensini score. The cut-off value of Lp(a) and LDL-C were 205.7 mg/L and 3.36 mmol/L, respectively.
下载: 导出CSV
-
[1] Nordestgaard BG, Chapman MJ, Ray K, et al. Lipoprotein(a) as a cardiovascular risk factor: current status. Eur Heart J, 2010; 31, 2844-53. doi: 10.1093/eurheartj/ehq386 [2] Imhof A, Rothenbacher D, Khuseyinova N, et al. Plasma lipoprotein Lp(a), markers of haemostasis and inflammation, and risk and severity of coronary heart disease. Eur J Cardiovasc Prev Rehabil, 2003; 10, 362-70. doi: 10.1097/01.hjr.0000087080.83314.be [3] Grainger DJ, Kirschenlohr HL, Metcalfe JC, et al. Proliferation of human smooth muscle cells promoted by lipoprotein(a). Science, 1993; 260, 1655-8. doi: 10.1126/science.8503012 [4] Krychtiuk KA, Kastl SP, Hofbauer SL, et al. Monocyte subset distribution in patients with stable atherosclerosis and elevated levels of lipoprotein(a). J Clin Lipidol, 2015; 9, 533-41. doi: 10.1016/j.jacl.2015.04.005 [5] Kamstrup PR, Benn M, Tybjaerg-Hansen A, et al. Extreme lipoprotein(a) levels and risk of myocardial infarction in the general population: the Copenhagen City Heart Study. Circulation, 2008; 117, 176-84. doi: 10.1161/CIRCULATIONAHA.107.715698 [6] Nsaibia MJ, Mahmut A, Boulanger MC, et al. Autotaxin interacts with lipoprotein(a) and oxidized phospholipids in predicting the risk of calcific aortic valve stenosis in patients with coronary artery disease. J Intern Med, 2016; 280, 509-17. doi: 10.1111/joim.2016.280.issue-5 [7] Nave AH, Lange KS, Leonards CO, et al. Lipoprotein (a) as a risk factor for ischemic stroke: a meta-analysis. Atherosclerosis, 2015; 242, 496-503. https://www.sciencedirect.com/science/article/pii/S0021915015300848 [8] Clarke R, Peden JF, Hopewell JC, et al. Genetic variants associated with Lp(a) lipoprotein level and coronary disease. N Engl J Med, 2009; 361, 2518-28. doi: 10.1056/NEJMoa0902604 [9] A joint committee on guidelines of the prevention and control of adult dyslipidemia in China. Chinese guidelines on prevention and treatment of dyslipidemia in adults. Chin J Cardiol, 2007; 35, 390-419. (In Chinese) [10] Catapano AL, Graham I, De Backer G, et al. 2016 ESC/EAS Guidelines for the Management of Dyslipidaemias. Eur Heart J, 2016; 37, 2999-3058. doi: 10.1093/eurheartj/ehw272 [11] Bjornsson E, Gudbjartsson DF, Helgadottir A, et al. Common sequence variants associated with coronary artery disease correlate with the extent of coronary atherosclerosis. Arterioscler Thromb Vasc Biol, 2015; 35, 1526-31. doi: 10.1161/ATVBAHA.114.304985 [12] Brown WV, Ballantyne CM, Jones PH, et al. Management of Lp(a). J Clin Lipidol, 2010; 4, 240-7. doi: 10.1016/j.jacl.2010.07.002 [13] Khera AV, Everett BM, Caulfield MP, et al. Lipoprotein(a) concentrations, rosuvastatin therapy, and residual vascular risk: an analysis from the JUPITER Trial (Justification for the Use of Statins in Prevention: an Intervention Trial Evaluating Rosuvastatin). Circulation, 2014; 129, 635-42. doi: 10.1161/CIRCULATIONAHA.113.004406 [14] Li S, Wu NQ, Zhu CG, et al. Significance of lipoprotein(a) levels in familial hypercholesterolemia and coronary artery disease. Atherosclerosis, 2017; 260, 67-74. doi: 10.1016/j.atherosclerosis.2017.03.021 [15] Gensini GG. A more meaningful scoring system for determining the severity of coronary heart disease. Am J Cardiol, 1983; 51, 606. doi: 10.1016/S0002-9149(83)80105-2 [16] Hopewell JC, Seedorf U, Farrall M, et al. Impact of lipoprotein(a) levels and apolipoprotein(a) isoform size on risk of coronary heart disease. J Intern Med, 2014; 276, 260-8. doi: 10.1111/joim.12187 [17] Schwartzman RA, Cox ID, Poloniecki J, et al. Elevated plasma lipoprotein(a) is associated with coronary artery disease in patients with chronic stable angina pectoris. J Am Coll Cardiol, 1998; 31, 1260-6. doi: 10.1016/S0735-1097(98)00096-5 [18] Erqou S, Kaptoge S, Perry PL, et al. Lipoprotein(a) concentration and the risk of coronary heart disease, stroke, and nonvascular mortality. JAMA, 2009; 302, 412-23. doi: 10.1001/jama.2009.1063 [19] Cai DP, He YM, Yang XJ, et al. Lipoprotein (a) is a risk factor for coronary artery disease in Chinese Han ethnic population modified by some traditional risk factors: A cross-sectional study of 3462 cases and 6125 controls. Clin Chim Acta, 2015; 451, 278-86. doi: 10.1016/j.cca.2015.10.009 [20] Wang L, Chen J, Zeng Y, et al. Functional Variant in the SLC22A3-LPAL2-LPA Gene Cluster Contributes to the Severity of Coronary Artery Disease. Arterioscler Thromb Vasc Biol, 2016; 36, 1989-96. doi: 10.1161/ATVBAHA.116.307311 [21] Zewinger S, Kleber ME, Tragante V, et al. Relations between lipoprotein(a) concentrations, LPA genetic variants, and the risk of mortality in patients with established coronary heart disease: a molecular and genetic association study. Lancet Diabetes Endocrinol, 2017; 5, 534-43. doi: 10.1016/S2213-8587(17)30096-7 [22] O'Donoghue ML, Morrow DA, Tsimikas S, et al. Lipoprotein(a) for risk assessment in patients with established coronary artery disease. J Am Coll Cardiol, 2014; 63, 520-7. doi: 10.1016/j.jacc.2013.09.042 [23] Boroumand MA, Rekabi V, Davoodi G, et al. Correlation between lipoprotein(a) serum concentration and severity of coronary artery stenosis in an Iranian population according to Gensini score. Clin Biochem, 2008; 41, 117-20. doi: 10.1016/j.clinbiochem.2007.10.004 [24] Moon JY, Kwon HM, Kwon SW, et al. Lipoprotein(a) and LDL particle size are related to the severity of coronary artery disease. Cardiology, 2007; 108, 282-9. doi: 10.1159/000099097 [25] Gazzaruso C, Bruno R, Pujia A, et al. Lipoprotein(a), apolipoprotein(a) polymorphism and coronary atherosclerosis severity in type 2 diabetic patients. Int J Cardiol, 2006; 108, 354-8. doi: 10.1016/j.ijcard.2005.05.022 [26] Kral BG, Kalyani RR, Yanek LR, et al. Relation of Plasma Lipoprotein(a) to Subclinical Coronary Plaque Volumes, Three-Vessel and Left Main Coronary Disease, and Severe Coronary Stenoses in Apparently Healthy African-Americans With a Family History of Early-Onset Coronary Artery Disease. Am J Cardiol, 2016; 118, 656-61. doi: 10.1016/j.amjcard.2016.06.020 [27] Sinning C, Lillpopp L, Appelbaum S, et al. Angiographic score assessment improves cardiovascular risk prediction: the clinical value of SYNTAX and Gensini application. Clin Res Cardiol, 2013; 102, 495-503. doi: 10.1007/s00392-013-0555-4 [28] Afshar M, Pilote L, Dufresne L, et al. Lipoprotein(a) Interactions With Low-Density Lipoprotein Cholesterol and Other Cardiovascular Risk Factors in Premature Acute Coronary Syndrome (ACS). J Am Heart Assoc, 2016; 5. http://cn.bing.com/academic/profile?id=6619ab5ae6d7037d789a27b24f1e68e7&encoded=0&v=paper_preview&mkt=zh-cn [29] Cai A, Li L, Zhang Y, et al. Baseline LDL-C and Lp(a) elevations portend a high risk of coronary revascularization in patients after stent placement. Dis Markers, 2013; 35, 857-62. doi: 10.1155/2013/472845 [30] Saeedi R, Li M, Allard M, et al. Marked effects of extreme levels of lipoprotein(a) on estimation of low-density lipoprotein cholesterol. Clin Biochem, 2014; 47, 1098-9. doi: 10.1016/j.clinbiochem.2014.04.023 [31] Tsimikas S. The re-emergence of lipoprotein(a) in a broader clinical arena. Prog Cardiovasc Dis, 2016; 59, 135-44. doi: 10.1016/j.pcad.2016.07.005 [32] Raal FJ, Giugliano RP, Sabatine MS, et al. Reduction in lipoprotein(a) with PCSK9 monoclonal antibody evolocumab (AMG 145): a pooled analysis of more than 1, 300 patients in 4 phase Ⅱ trials. J Am Coll Cardiol, 2014; 63, 1278-88. doi: 10.1016/j.jacc.2014.01.006 [33] Roeseler E, Julius U, Heigl F, et al. Lipoprotein Apheresis for Lipoprotein(a)-Associated Cardiovascular Disease: Prospective 5 Years of Follow-Up and Apolipoprotein(a) Characterization. Arterioscler Thromb Vasc Biol, 2016; 36, 2019-27. doi: 10.1161/ATVBAHA.116.307983 -

 点击查看大图
计量
- 文章访问数: 2952
- HTML全文浏览量: 924
- PDF下载量: 123
- 被引次数: 0

 Quick Links