

 下载:
下载:

-
Diabetes poses a large disease burden worldwide with unequal distribution across countries and regions with different economic levels: middle- and low-income countries and deprived areas suffer the highest prevalence[1-3]. Such socioeconomic inequity in diabetes also exists within countries, and a few studies have linked disadvantaged socioeconomic factors (i.e., income, education, and occupation) with higher diabetes risk[4]. However, the overall socioeconomic status (SES) has multiple dimensions and cannot be reflected by single factors[5], and there are few studies quantifying the association between overall SES and diabetes risk, which is necessary for evaluating the disease burden of diabetes and promoting health equity.
Even fewer studies have explored the mediating roles of different risk factors and whether their associations with diabetes risk are modified by SES. SES is a foundational determinant of health and influences a wide range of social determinants of health[4], including environmental exposures and psychological stressors. These determinants can further influence individuals’ behaviors and physiological conditions, ultimately influencing diabetes risk[4]. Thus, environmental, psychological, behavioral, and physiological factors may mediate the increased diabetes risk associated with low SES and may serve as intervention targets. However, existing evidence only considered a limited number of risk factors and did not fully consider potential confounding from other factors (such as environmental factors)[6-9], which led to the high variability of the mediation proportion estimates. Additionally, it remains unclear whether associations between modifiable diabetes risk profiles and diabetes risk vary across different SES groups, which is essential to identify intervention priorities.
Therefore, in the UK Biobank, a large nationwide prospective cohort, we constructed two sets of instruments to characterize participants’ overall SES and their modifiable diabetes risk factor profiles across physiological, behavioral, environmental, and psychological domains. Our objectives were to: 1) quantify the association between overall SES and incident diabetes; 2) estimate the proportion of this association mediated by overall modifiable diabetes risk profiles; and 3) assess whether SES modifies the associations between these risk profiles and diabetes risk.
-
Between 2007 and 2010, the UK Biobank recruited 502,492 participants aged 37 to 73 years from 22 assessment centers across England, Scotland, and Wales. The study design and data collection procedures were previously described[10]. After excluding 107,981 participants with prevalent diabetes, cardiovascular disease, or cancer except for nonmelanoma (definitions are reported in Supplementary Methods) at baseline and 57,282 participants missing data on SES, our analysis included 337,229 participants. The UK Biobank was approved by the North West Multi-Centre Research Ethics Committee. All participants provided written informed consent.
-
SES is a complex construct and should be comprehensively evaluated by income, occupation, and education according to the theoretical framework[5]. According to previous publications[5,11], latent class analysis, a commonly-used method in sociology, was performed to generate a latent variable SES according to three observable, self-reported, categorical variables – income, occupation, and education. According to previous UK Biobank studies, income was defined by average total household income before tax (≥ ₤52,000, ₤31,000 to ₤51,999, ₤18,000 to ₤30,999, and < ₤18,000)[11]; occupation was defined by employment status and job code (skilled job, unskilled job, unemployment, and others)[11,12]; education was defined by qualifications (college or university degree [equivalent to 20 years of education], National Vocational Qualification [NVQ]/Higher National Diploma [HND]/Higher National Certificate [HNC] or equivalent [19 years], other professional qualifications [15 years], Advanced [A])/Advanced Subsidiary [AS] levels or equivalent [13 years], Ordinary [O]/General Certificate of Secondary Education [GCSE]/Certificate of Secondary Education [CSE] or equivalent [10 years], and none of the above [7 years])[13]. Participants’ SES remained relatively stable –94.9%, 83.7%, and 62.7% of participants reported the same employment, education, and income information between 2007-2010 and 2012-2013, respectively. The rationale of grouping is detailed in Supplementary Methods.
The latent class analysis was performed by a SAS procedure PROC LCA[14]. Latent class models with two to six classes were evaluated. Model fit was assessed using the G2 statistics, Akaike information criterion (AIC), and Bayesian information criterion (BIC). Since the decrease of these statistics leveled off after three latent classes, and all mean posterior probabilities in the three-class solution were ≥ 0.80, we selected the three-class solution to define overall SES (i.e., low, medium, and high SES groups). Detailed methods and model fit statistics are reported in our previous studies[11,15] and Supplementary Methods.
-
We examined 42 risk factors from a recent review of an atlas on risk factors for diabetes[16], which were categorized into physiological, behavioral, environmental, and psychological factors. Each factor was classified into two levels – healthy and risk levels, and we calculated physiological, behavioral, environmental, and psychological scores as the number of healthy factors in each category, with higher scores indicating less risk. The healthy level for each factor was defined by clinical guidelines, recommendations, or distributions (40% of participants had the healthy level) and shown in Supplementary Table S1. This method has been widely used to comprehensively evaluate multiple risk factors[11,17], given its computational simplicity, potential for utilization in the real world, and ability to reflect the interrelation and cluster of different risk factors. Missing information was imputed to the mode (Supplementary Table S1 shows the number of missingness). A sensitivity analysis was conducted by excluding participants with missing information on risk factors, and the results remained largely consistent (data not shown). To ensure directional consistency in the mediation framework, we included only modifiable factors whose predefined healthy levels were more common among participants with high SES and were associated with lower diabetes risk.
Specifically, we considered 23 physiological factors (13 metabolic factors – serum glycated hemoglobin, dyslipidemia, body mass index, waist-to-hip ratio, serum uric acid, resting pulse rate, C-reactive protein, sex hormone binding globulin, platelet count, hypertension, non-alcoholic fatty liver disease and liver malfunction, chronic kidney disease, and hyperthyroidism and hypothyroidism, and 10 disease factors – severe periodontal disease, asthma, chronic obstructive pulmonary disease, inflammatory bowel disease, systemic autoimmune disorders, allergic rhinitis, rheumatoid arthritis, psoriasis, osteoarthritis, and atopic dermatitis), 7 behavioral factors (dietary quality, sleep health, alcohol drinking, leisure-time physical activity, sedentary behavior, active smoking, and passive smoking), 6 environmental factors (average sound level, PM2.5, PM10, nitrogen dioxide, percentage of the home location buffer classed as 'natural environment' at 1000m, and health deprivation score), and 5 psychological factors (visiting friends/family, attending group activity, confiding in someone close, stress event, and depression and anxiety).
These four categories of risk factors are interrelated and may influence one another along the causal pathway (Supplementary Figure S1). We hypothesize that 1) SES directly influences all four categories, 2) environmental and psychological factors also influence behavioral and physiological factors, and 3) behavioral factors further influence physiological factors. For each category, a composite score was constructed by summing binary factors representing whether participants met the predefined healthy level for each included factor. All factors were equally weighted. Each score was then categorized into tertiles based on its distribution in the analytic sample, with higher tertiles indicating more favorable overall risk profiles.
Age, sex, self-reported race/ethnicity, and family history of diabetes were obtained via questionnaires and included as covariates. Supplementary Methods and Supplementary Table S1 report detailed methods of data collection and variable definitions.
-
Incident diabetes cases were identified through linkages to hospital inpatient records (International Classification of Diseases [ICD] codes, tenth and ninth revision), death records (ICD-10 code), and primary care records (read codes) after baseline. The UK Biobank mapped ICD-9 and read codes to ICD-10 codes. ICD-10 codes E11-E14 were used to identify incident diabetes, and type 2 diabetes (E11) was a secondary outcome.
-
Baseline characteristics were described across SES groups, and differences across groups were tested by analysis of variance for continuous variables and χ2 test for categorical variables. To select factors associated with diabetes risk, Cox proportional hazard regression models were constructed with adjustment of age, sex, and race/ethnicity, and factors would be selected if their healthy levels were associated with lower diabetes risk. To select factors associated with SES, logistic regression models with adjustment of age, sex, and race/ethnicity were constructed, where risk factors and SES were included as the dependent and independent variables, respectively; factors would be selected if participants with low SES are less likely to have healthy levels of the factors compared with those with high SES.
Hazard ratios (HRs) with 95% confidence intervals (CIs) associated with SES for incident diabetes were estimated by Cox proportional hazard regression models. The proportional hazards assumption was tested by visual examination of survival curves for different SES groups, and no cross was observed (Supplementary Figure S2). Person-years were counted from baseline until the date of incident diabetes, death, loss to follow-up, or end of follow-up (September 30, 2021 for England, July 31, 2021 for Scotland, and February 28, 2018 for Wales), whichever occurred first. Based on our previous study of SES and the atlas review of risk factors for diabetes[11,16], model 1 included SES, age, sex, race/ethnicity, family history of diabetes, and alcohol drinking. In the UK Biobank, heavy alcohol drinking (predefined risk levels) was associated with lower diabetes risk and high SES (Supplementary Tables S1 and S2), and it is unreasonable to recommend people to consume alcohol heavily; thus, we included alcohol drinking as a covariate instead of as a component of the behavioral score. Based on model 1, models 2 to 5 additionally included physiological, behavioral, environmental, and psychological scores (continuous variables), respectively; model 6 included four scores at the same time based on model 1. Incidence rate difference (IRD) for diabetes across different SES groups with 95% CIs were also estimated by additive hazard models with adjustment of covariates included in model 1 and model 6, and R package “addhazard” was used[18].
To examine whether and to what extent modifiable diabetes risk profiles could mediate the association between SES and incident diabetes, we first examine the associations of physiological, behavioral, environmental, and psychological scores (both as continuous scores and tertiles) with the risk of diabetes (model 6). Then, mediation proportion was calculated by the difference method[19], i.e., the difference in the coefficients of SES between models with and without hypothesized mediators (continuous scores), and the confidence interval was estimated using the data duplication algorithm included in the SAS macro %mediate[20]. A sensitivity analysis was conducted by using the product method[19].
Given that additive interaction conveys greater public health significance[21], IRD for diabetes comparing different tertiles of physiological, behavioral, environmental, and psychological scores were estimated across different SES groups, and product terms of SES and four scores were respectively introduced into the additive hazard models to test the statistical significance of additive interaction. Multiplicative interactions between SES and four scores were also tested as a secondary analysis by introducing product terms of SES and four scores into the Cox proportional hazard regression models. P values for the product terms of < 0.05 indicated significant interactions.
Several sensitivity analyses were conducted to test the robustness of the results (Supplementary Methods). All analyses were conducted using SAS version 9.4 (SAS Institute, Cary, NC) or R version 4.2.2 (http://www.R-project.org/). Two-sided P values of <0.05 were considered statistically significant.
-
Among 337,229 participants, 90,252 (26.8%), 172,825 (51.2%), and 74,152 (22.0%) had high, medium, and low SES, respectively (Table 1). Compared with participants with low SES, those with high SES were more likely to be younger, male, and White British, as well as to have higher levels of income, occupation, and education (which supported the rationale for constructing the latent variable SES), but they were less likely to have family histories of diabetes. Individuals with missing SES tended to be older and female, and have lower levels of income, occupation, and education (Supplementary Table S3).
Table 1. Baseline characteristics of participants across socioeconomic status groups
Socioeconomic status High Medium Low Total, n (%) 90,252 (26.8) 172,825 (51.2) 74,152 (22.0) Mean age (SD), y 51.9 (7.0) 55.2 (8.0) 59.5 (7.5) Men, n (%) 47,074 (52.2) 78,413 (45.4) 30,810 (41.6) Non-white, n (%) 3,338 (3.7) 8,073 (4.7) 4,179 (5.6) Family history of diabetes, n (%) 18,153 (20.1) 36,705 (21.2) 15,845 (21.4) Annual income of ≥ ₤31,000, n (%) 90,252 (100.0) 90,274 (52.2) 5,464 (7.4) Skilled job, n (%) 76,662 (84.9) 102,554 (59.3) 1,687 (2.3) College or university degree, n (%) 55,258 (61.2) 60,441 (35.0) 8,021 (10.8) Physiological factors Mean physiological score (SD) 18.5 (1.7) 18.1 (1.8) 17.5 (1.9) Serum glycated hemoglobin of < 39 mmol/moL, n (%) 77,825 (86.2) 141,605 (81.9) 56,709 (76.5) No prevalent dyslipidemia, n (%) 57,169 (63.3) 100,727 (58.3) 37,196 (50.2) Body mass index of < 30 kg/m2, n (%) 74,212 (82.2) 136,169 (78.8) 54,575 (73.6) Waist-to-hip ratio of < 0.90/0.85 for men/women, n (%) 52,373 (58.0) 93,981 (54.4) 34,839 (47.0) Serum uric acid of ≤ 7.6/6.6 mg/dL, n (%) 85,177 (94.4) 163,139 (94.4) 69,011 (93.1) C-reactive protein < 5 mg/L, n (%) 84,090 (93.2) 156,743 (90.7) 63,958 (86.3) Normal sex hormone binding globulin level, n (%) 75,924 (84.1) 145,178 (84.0) 62,192 (83.9) Platelet count of 169.06-397.10*103 cells/μL, n (%) 84,935 (94.1) 162,190 (93.9) 69,061 (93.1) No prevalent hypertension, n (%) 48,713 (54.0) 78,920 (45.7) 25,942 (35.0) No prevalent non-alcoholic fatty liver disease or liver malfunction, n (%) 73,490 (81.4) 143,498 (83.0) 61,103 (82.4) No prevalent chronic kidney disease, n (%) 80,688 (89.4) 151,808 (87.8) 62,984 (84.9) No prevalent hyperthyroidism or hypothyroidism, n (%) 86,474 (95.8) 163,092 (94.4) 68,498 (92.4) No severe peridontal disease, n (%) 88,052 (97.6) 166,338 (96.3) 69,791 (94.1) No prevalent asthma, n (%) 78,962 (87.5) 152,431 (88.2) 64,935 (87.6) No prevalent chronic obstructive pulmonary disease, n (%) 88,580 (98.2) 168,249 (97.4) 70,329 (94.8) No prevalent inflammatory bowel disease, n (%) 89,387 (99.0) 171,020 (99.0) 73,212 (98.7) No prevalent systemic autoimmune disorders, n (%) 89,921 (99.6) 171,782 (99.4) 73,481 (99.1) No prevalent rheumatoid arthritis, n (%) 89,726 (99.4) 171,081 (99.0) 72,710 (98.1) No prevalent psoriasis, n (%) 88,534 (98.1) 169,225 (97.9) 72,446 (97.7) No prevalent osteoarthritis, n (%) 84,724 (93.9) 154,849 (89.6) 60,501 (81.6) No prevalent atopic dermatitis, n (%) 88,554 (98.1) 169,373 (98.0) 72,567 (97.9) Behavioral factors Mean behavioral score (SD) 3.4 (1.1) 3.2 (1.2) 3.0 (1.1) Cardiovascular health diet score of ≥ 5 points, n (%) 14,458 (16.0) 31,015 (18.0) 14,100 (19.0) Healthy sleep score of 4–5 points, n (%) 61,092 (67.7) 115,532 (66.9) 47,578 (64.2) ≥ 150 minutes/week of moderate to vigorous leisure-time physical activity, n (%) 38,567 (42.7) 63,872 (37.0) 25,037 (33.8) Bottom two quintiles of sedentary time, n (%) 38,474 (42.6) 59,703 (34.6) 19,328 (26.1) No current active smoking, n (%) 86,449 (95.8) 160,513 (92.9) 64,903 (87.5) No current passive smoking, n (%) 67,887 (75.2) 120,762 (69.9) 49,367 (66.6) Current no or moderate alcohol drinking, n (%) 36,275 (40.2) 87,460 (50.6) 44,991 (60.7) Environmental factors Mean environmental score (SD) 2.6 (1.8) 2.3 (1.8) 2.0 (1.7) Bottom two quintiles of average sound level, n (%) 36,319 (40.2) 67,974 (39.3) 28,632 (38.6) Bottom two quintiles of nitrogen dioxide, n (%) 39,080 (43.3) 70,398 (40.7) 25,429 (34.3) Bottom two quintiles of PM10, n (%) 34,612 (38.4) 64,379 (37.3) 25,350 (34.2) Bottom two quintiles of PM2.5, n (%) 37,882 (42.0) 64,409 (37.3) 23,176 (31.3) Top two quintiles of the percentage of the home location buffer at 1 km classed as natural environment, n (%) 37,840 (41.9) 70,212 (40.6) 26,722 (36.0) Bottom two quintiles of health deprivation score, n (%) 53,069 (58.8) 67,278 (38.9) 17,319 (23.4) Psychological factors Mean psychological score (SD) 3.7 (1.0) 3.4 (1.1) 3.2 (1.2) Live with relatives or visit friends/family more than once a week, n (%) 86,971 (96.4) 154,262 (89.3) 62,163 (83.8) Attend social group activity once a week or more often, n (%) 65,345 (72.4) 123,345 (71.4) 49,163 (66.3) Confide in someone close to you more than once a week, n (%) 64,439 (71.4) 111,749 (64.7) 42,758 (57.7) No stress events in last 2 years, n (%) 55,506 (61.5) 97,656 (56.5) 39,908 (53.8) No depression, n (%) 61,211 (67.8) 104,235 (60.3) 39,693 (53.5) Note. Differences among socioeconomic groups were tested through analysis of variance and χ2 test for continuous and categorical variables, respectively, and all P values were < 0.001. SD, standard deviation. -
During 4086,128 person-years of follow-up (median=12.5 years), 11,557 diabetes cases occurred, and 10,702 were type 2 diabetes. Healthy levels of 21 of 23 physiological factors were associated with lower diabetes risk (Supplementary Table S1), with the strongest association for serum glycated hemoglobin level (comparing < 39 mmol/moL with ≥ 39 mmol/moL, HR = 0.16, 95% CI: 0.15 to 0.16), followed by body mass index, waist-to-hip ratio, etc. Healthy levels of six of seven behavioral factors were associated with lower diabetes risk, with the strongest association for active smoking (comparing no with yes, HR = 0.53, 95% CI: 0.50 to 0.56), followed by leisure-time physical activity, sedentary behavior, etc. Healthy levels of all six environmental factors were associated with lower diabetes risk, with the strongest association for health deprivation score (comparing bottom two quintiles with top three quintiles, HR = 0.56, 95% CI: 0.54 to 0.58), followed by nitrogen dioxide, PM2.5, etc. Healthy levels of all five psychological factors were associated with lower diabetes risk, with the strongest association for depression and anxiety (comparing no with yes, HR = 0.65, 95% CI: 0.63 to 0.68).
As for overall modifiable diabetes risk profiles, HRs (95% CIs) for incident diabetes were 0.08 (0.07 to 0.09), 0.60 (0.58 to 0.63), 0.85 (0.81 to 0.89), and 0.71 (0.67 to 0.76) comparing top versus bottom tertiles of physiological, behavioral, environmental, and psychological scores, respectively (Supplementary Table S4).
Meanwhile, the healthy levels of all selected diabetes-related factors were more prevalent among participants with high SES compared to those with low SES (Supplementary Table S2); accordingly, the mean for physiological, behavioral, environmental, and psychological scores was lower among participants with low SES compared to those with high SES (Table 1). Specifically, predefined healthy levels of resting pulse rate (60-100 bpm), absence of allergic rhinitis, and alcohol drinking (current no or moderate drinking) were more prevalent among participants with low SES compared to those with high SES, and therefore were not included in the physiological or behavioral scores.
-
With the adjustment for age, sex, race/ethnicity, HbA1c, alcohol drinking, and family history of diabetes, participants with medium SES had a 49% higher risk of diabetes compared to those with high SES (HR 1.49, 95% CI: 1.41 to 1.57) and an excess incidence of 0.7 (95% CI: 0.6 to 0.8) per 1000 person-years, and those with low SES had a 2.47-fold higher risk (HR 2.47, 95% CI: 2.33 to 2.62) and an excess incidence of 2.7 (95% CI: 2.5 to 2.8) per 1000 person-years (Table 2).
Table 2. Associations of socioeconomic status with diabetes risk
Model Socioeconomic status, HR (95% CI) High Medium Low Mediation (%, 95% CI) Base model 1.00 1.49 (1.41 to 1.57) 2.47 (2.33 to 2.62) − Base model + physical mediators 1.00 1.32 (1.25 to 1.40) 1.74 (1.64 to 1.84) 39.1 (36.6 to 41.8) Base model + behavioral mediators 1.00 1.38 (1.30 to 1.45) 2.11 (1.99 to 2.24) 17.4 (16.2 to 18.6) Base model + environmental mediators 1.00 1.45 (1.37 to 1.53) 2.33 (2.19 to 2.47) 6.6 (6.0 to 7.3) Base model + psychological mediators 1.00 1.42 (1.34 to 1.50) 2.22 (2.09 to 2.36) 11.7 (10.8 to 12.7) Base model + all mediators 1.00 1.24 (1.17 to 1.31) 1.51 (1.42 to 1.61) 54.4 (50.9 to 58.0) Note. Base model adjusted for age, sex, race/ethnicity, alcohol drinking, and family history of diabetes. The mediation proportion is the proportion of the association between low (vs. high) socioeconomic status and diabetes risk that is explained by the mediators. CI, confidence interval; HR, hazard ratio. The associations were attenuated but still significant after controlling for physiological, behavioral, environmental, and psychological scores, respectively (Table 2). Physiological scores contributed to the largest mediation proportion (39.1%, 95% CI 36.6% to 41.8%) of the association between SES (comparing low versus high SES) and the risk of diabetes, followed by behavioral (17.4%, 16.2% to 18.6%), psychological (11.7%, 10.8% to 12.7%), and environmental scores (6.6%, 6.0% to 7.3%). Because these mediation proportions were estimated without mutual adjustment for the other three scores, the proportion for an upstream score also reflects its indirect effects through downstream scores. For instance, the 6.6% of the SES-diabetes association explained by environmental factors represents both their direct contribution and their indirect influence through downstream behavioral and physiological factors. The product method generated similar mediation proportions (Supplementary Table S6). With a simultaneous adjustment for all four scores, the HRs (95% CIs) comparing medium and low versus high SES were 1.24 (1.17 to 1.31) and 1.51 (1.42 to 1.61), and the corresponding IRDs (95% CIs) were 0.2 (0.1 to 0.3) and 1.2 (1.0 to 1.4) per 1000 person-years. These four scores together explained 54.4% (95% CI 50.9% to 58.0%) of the SES-diabetes association (Table 2). Results were consistent in sensitivity analyses, e.g., using incident type 2 diabetes as outcome, examining individual socioeconomic factors (Supplementary Table S6).
-
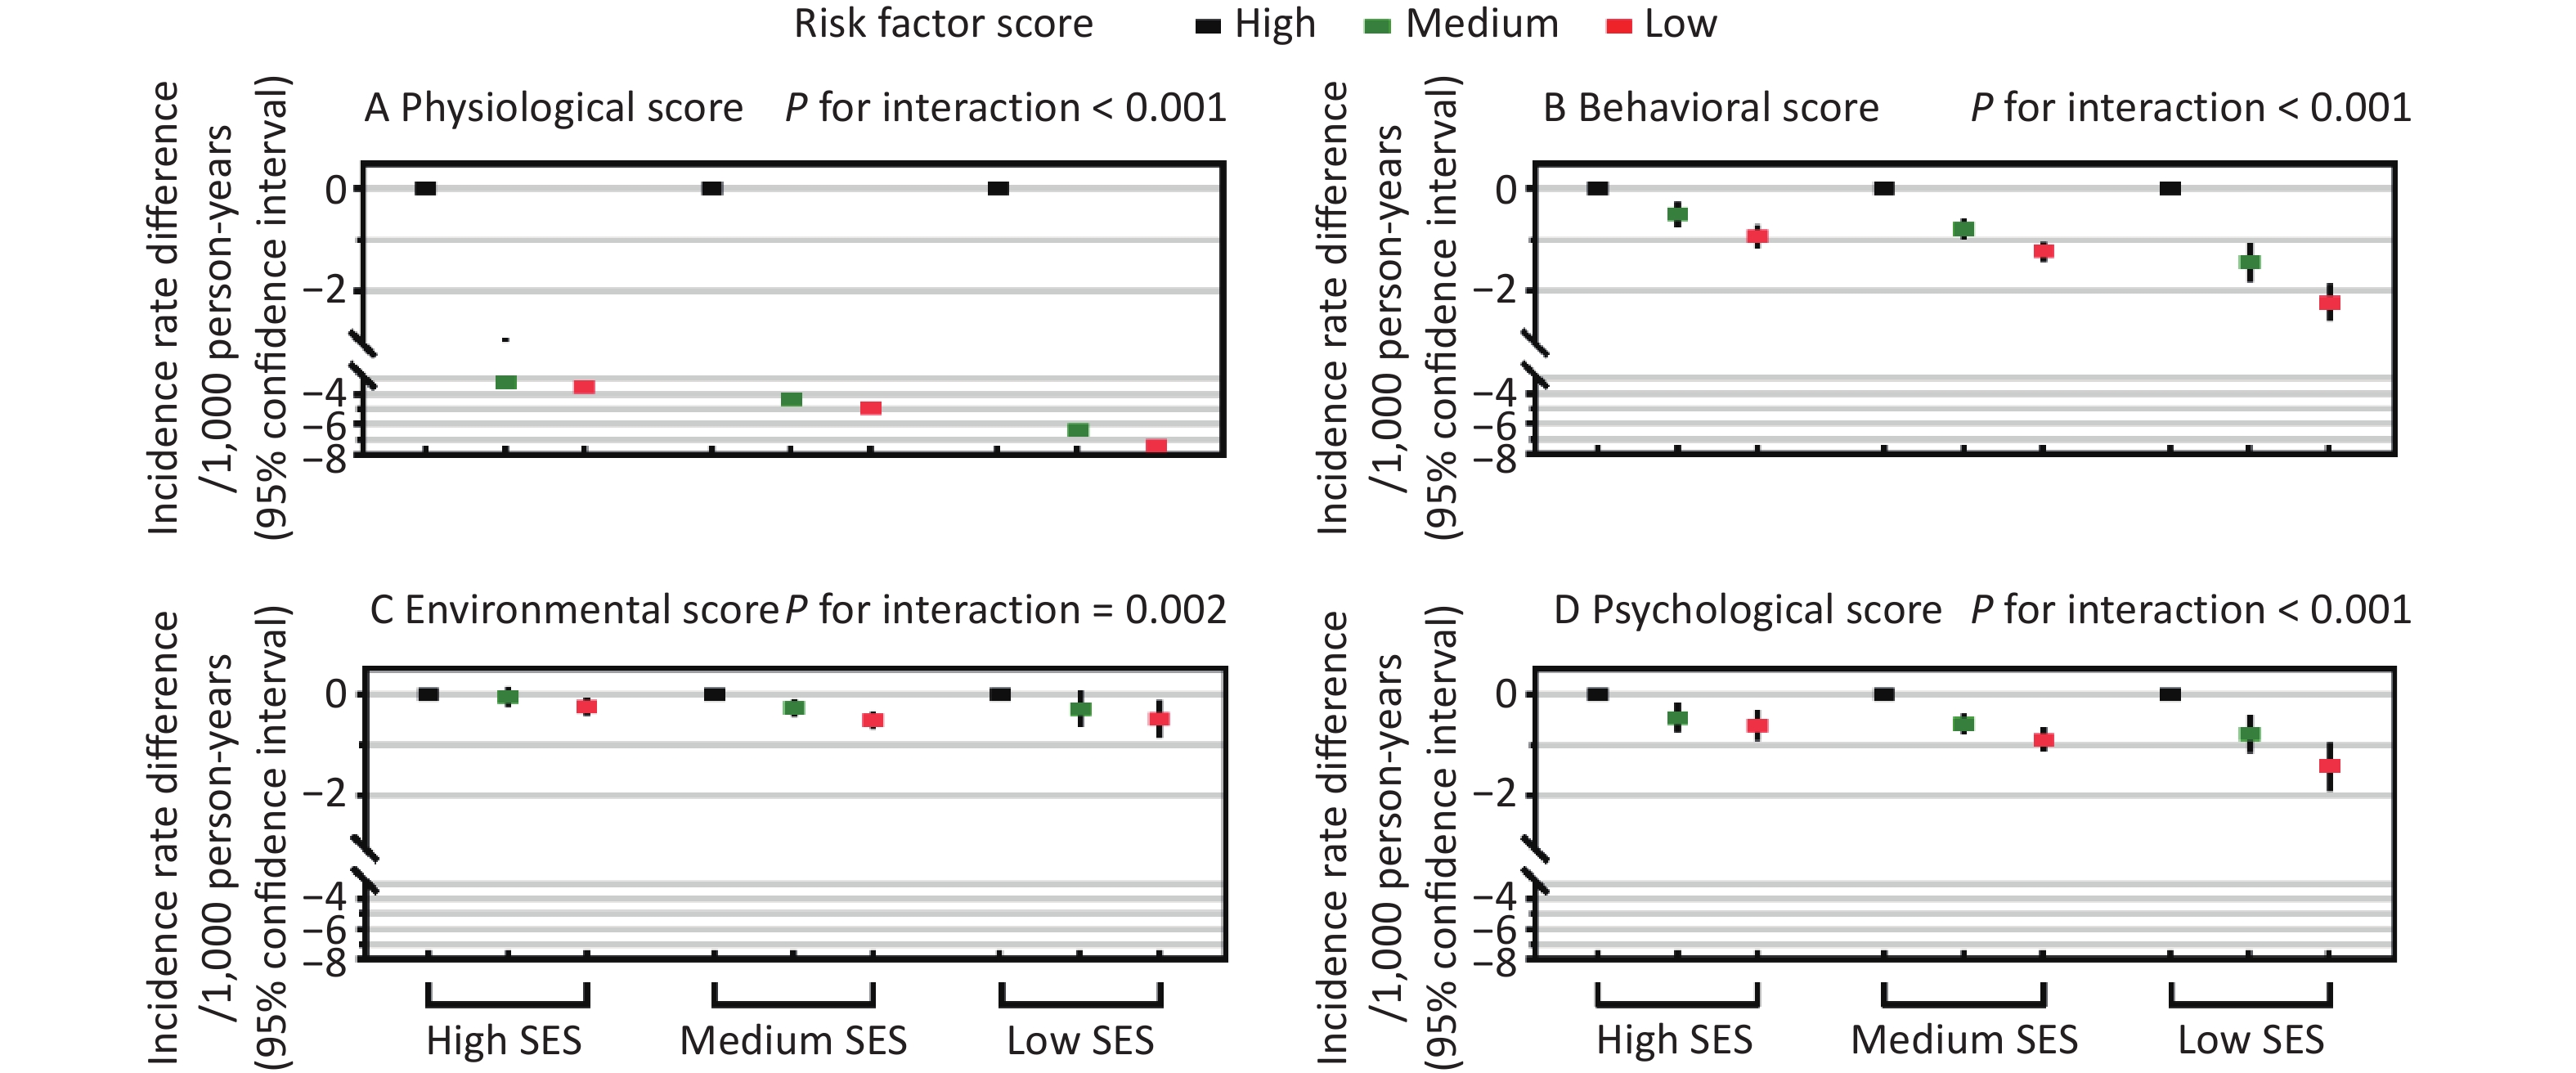
Additive interactions were found between all four risk factor scores and SES (P for interaction ≤ 0.002, Figure 1), and the IRDs for diabetes comparing the top versus bottom tertiles of all scores increased with decreasing SES. In the low SES group, the IRDs (95% CIs) for diabetes were –7.4 (–7.8 to –7.1) comparing top versus bottom tertiles of the physiological score, –2.2 (–2.6 to –1.9) for the behavioral score, –0.5 (–0.9 to –0.1) for the environmental score, and -1.4 (-1.9 to -1.0) for the psychological score, which were greater than the corresponding IRDs in the high SES group, i.e., –3.6 (–3.8 to –3.3), –0.9 (–1.2 to –0.7), –0.2 (–0.1 to –0.4), and –0.6 (–0.9 to –0.3), respectively. Additive interactions remained statistically significant in most sensitivity analyses (P for interaction ≤ 0.024, Supplementary Table S7), except that there were no significant additive interactions between income/education and the environmental score (P for interaction ≥ 0.10).
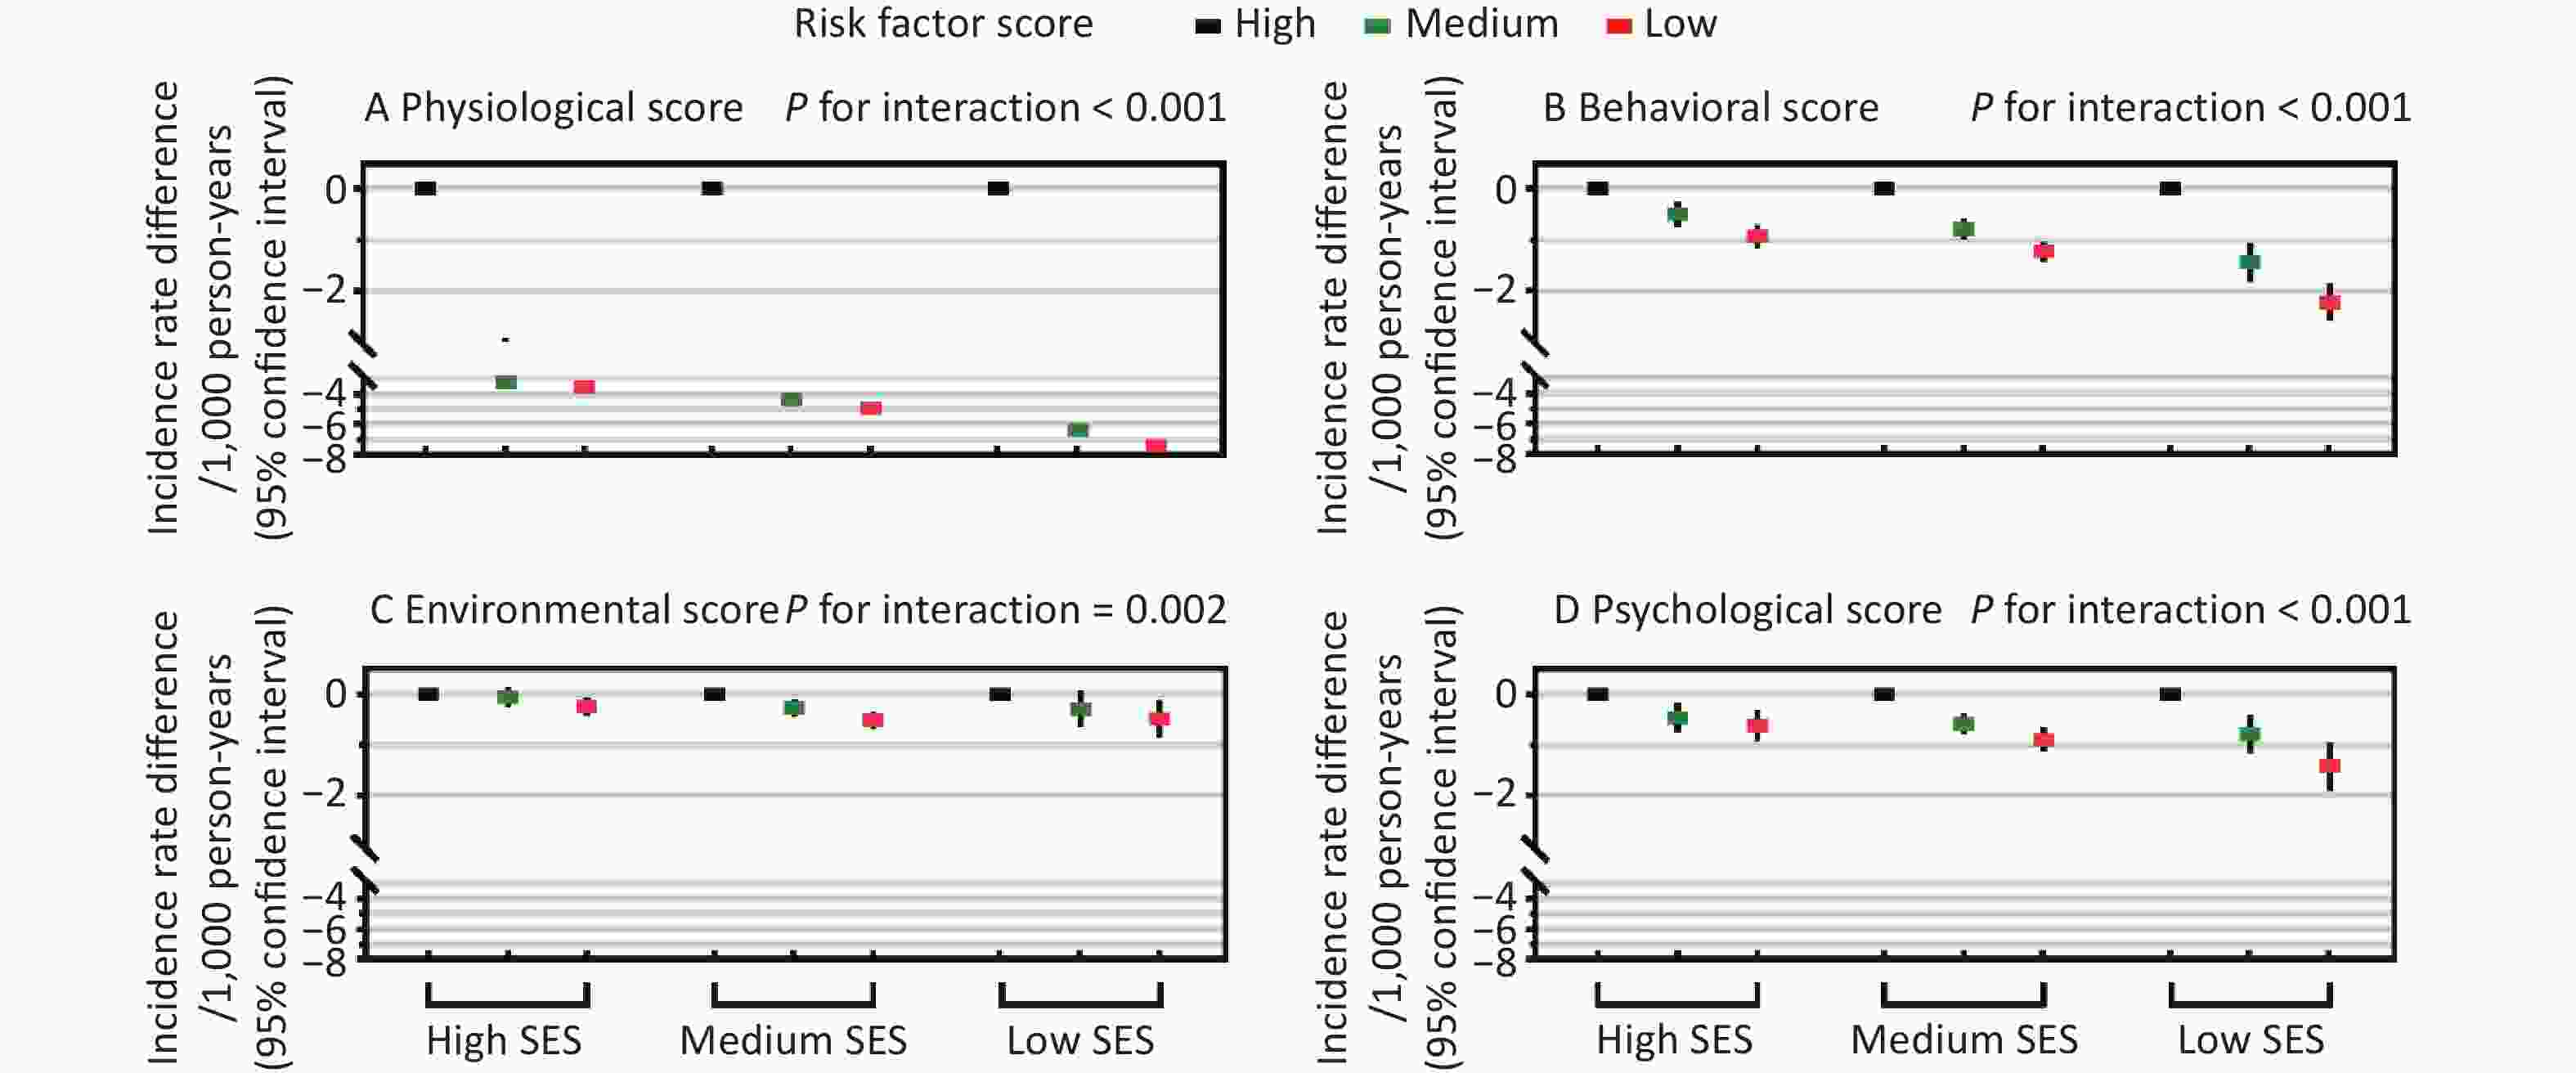
Figure 1. Additive interactions between socioeconomic status (SES) and modifiable diabetes risk factor scores in relation to incident diabetes. Incidence rate differences in diabetes are shown across three SES groups according to tertiles of physiological, behavioral, environmental, and psychological risk factor scores. Additive interaction evaluates whether the absolute reduction in diabetes incidence associated with favorable risk factor profiles differs across SES groups, thereby indicating which SES groups may have greater absolute benefit related to favorable risk factor profiles. Incidence rate differences and P values for additive interactions were estimated using additive hazard models adjusted for age, sex, race/ethnicity, family history of diabetes, and alcohol drinking. The four risk factor scores were mutually adjusted. The x-axis represents SES categories, and the y-axis represents incidence rate differences (per 1000 person-years). Black, green, and red rectangles indicate the top (most favorable; reference, incidence rate difference = 0.0), middle, and bottom tertiles of each risk factor score, respectively, with vertical lines indicating 95% confidence intervals.
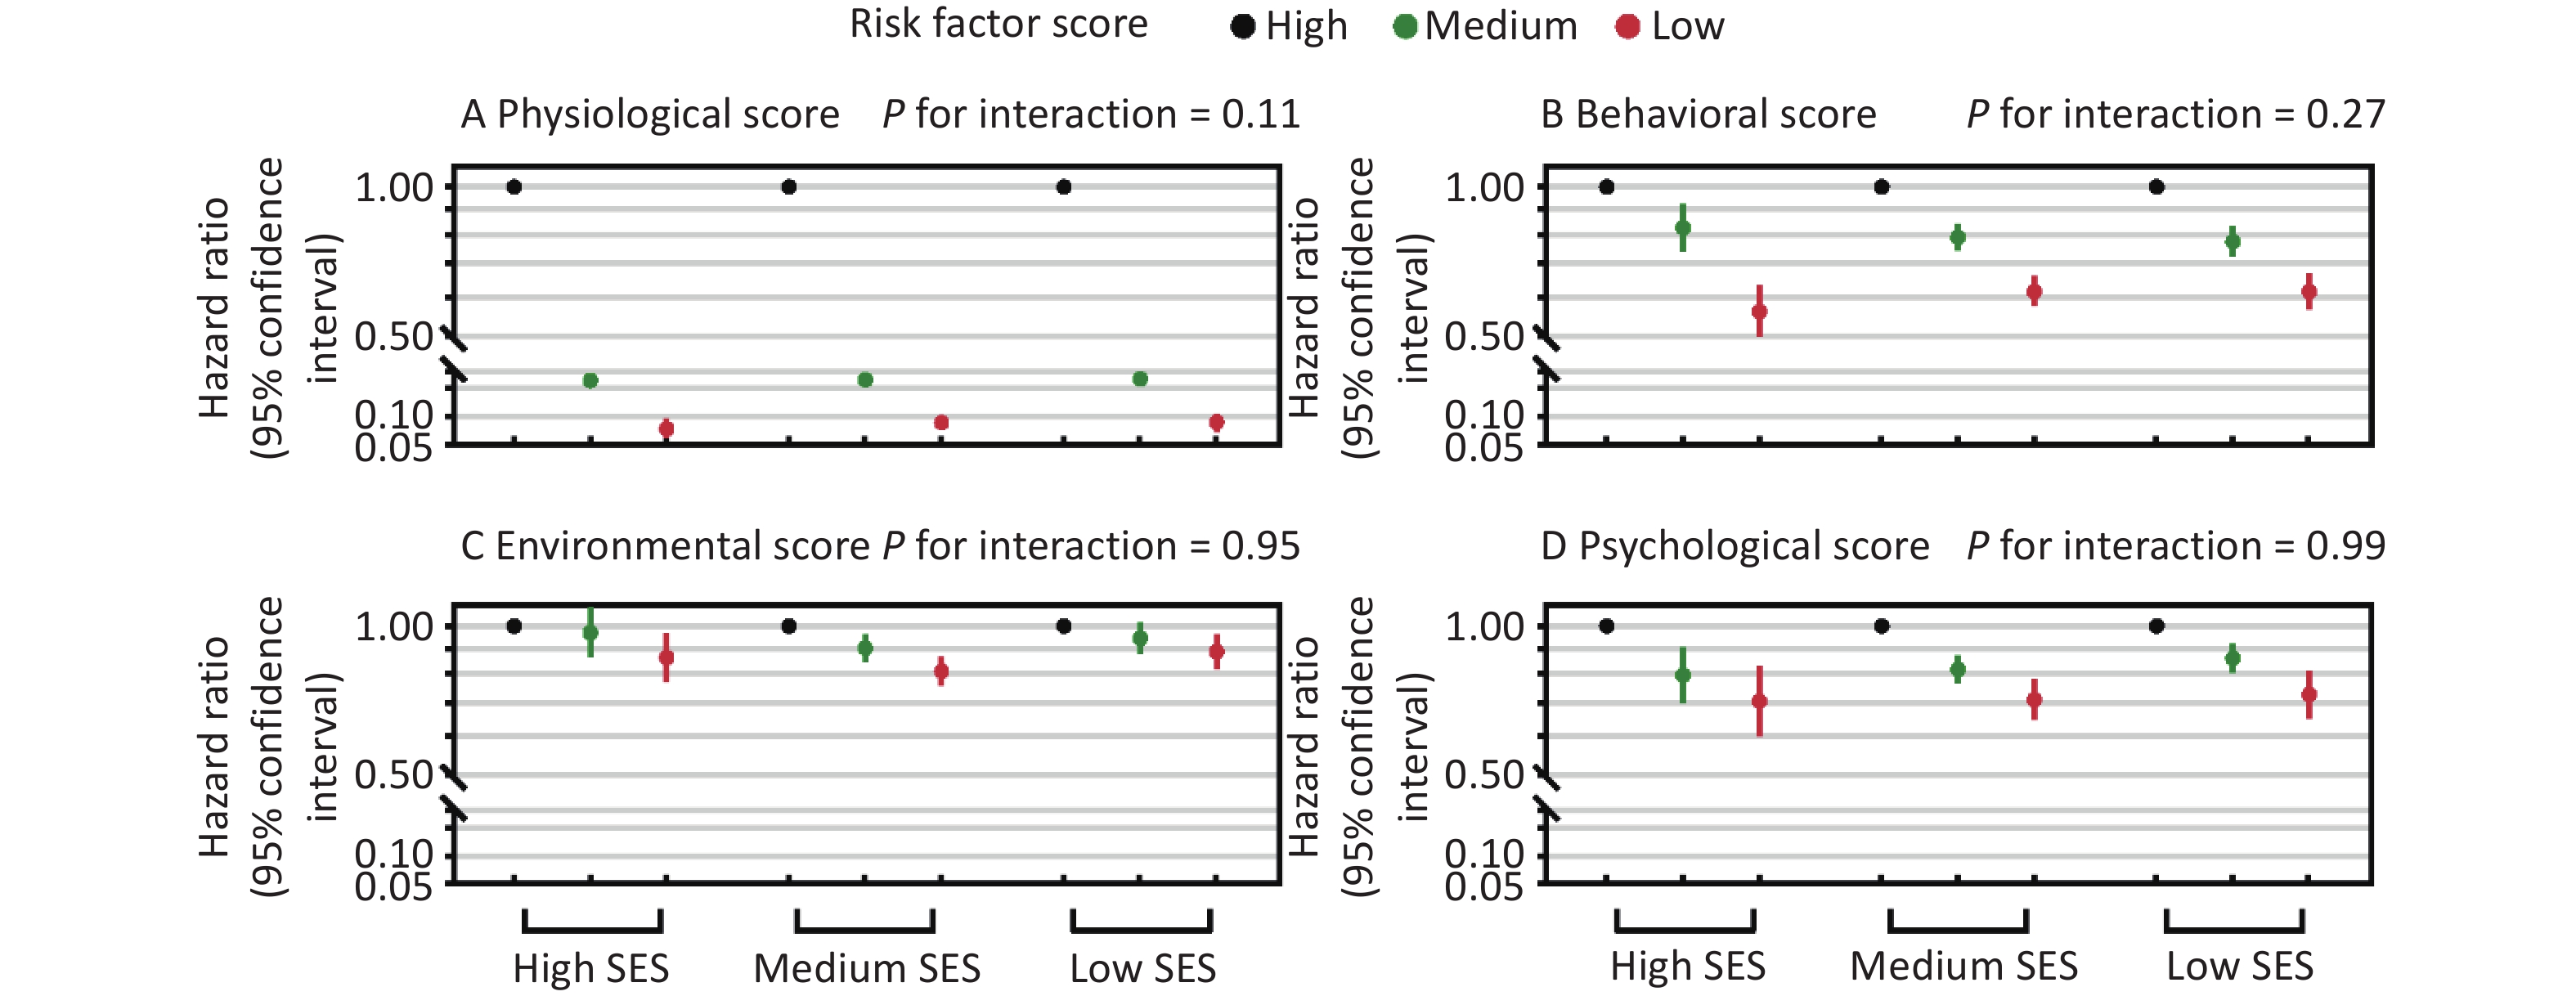
Multiplicative interactions between four risk factor scores and SES were also examined, and HRs comparing top versus bottom tertiles of all scores were similar across different SES groups (P for interaction ≥ 0.11, Figure 2). Across different SES groups, top tertiles of physiological (HRs range: 0.07-0.09), behavioral (0.56-0.62), environmental (0.81-0.89), and psychological scores (0.71-0.73) had lower risks of diabetes, compared to bottom tertiles.
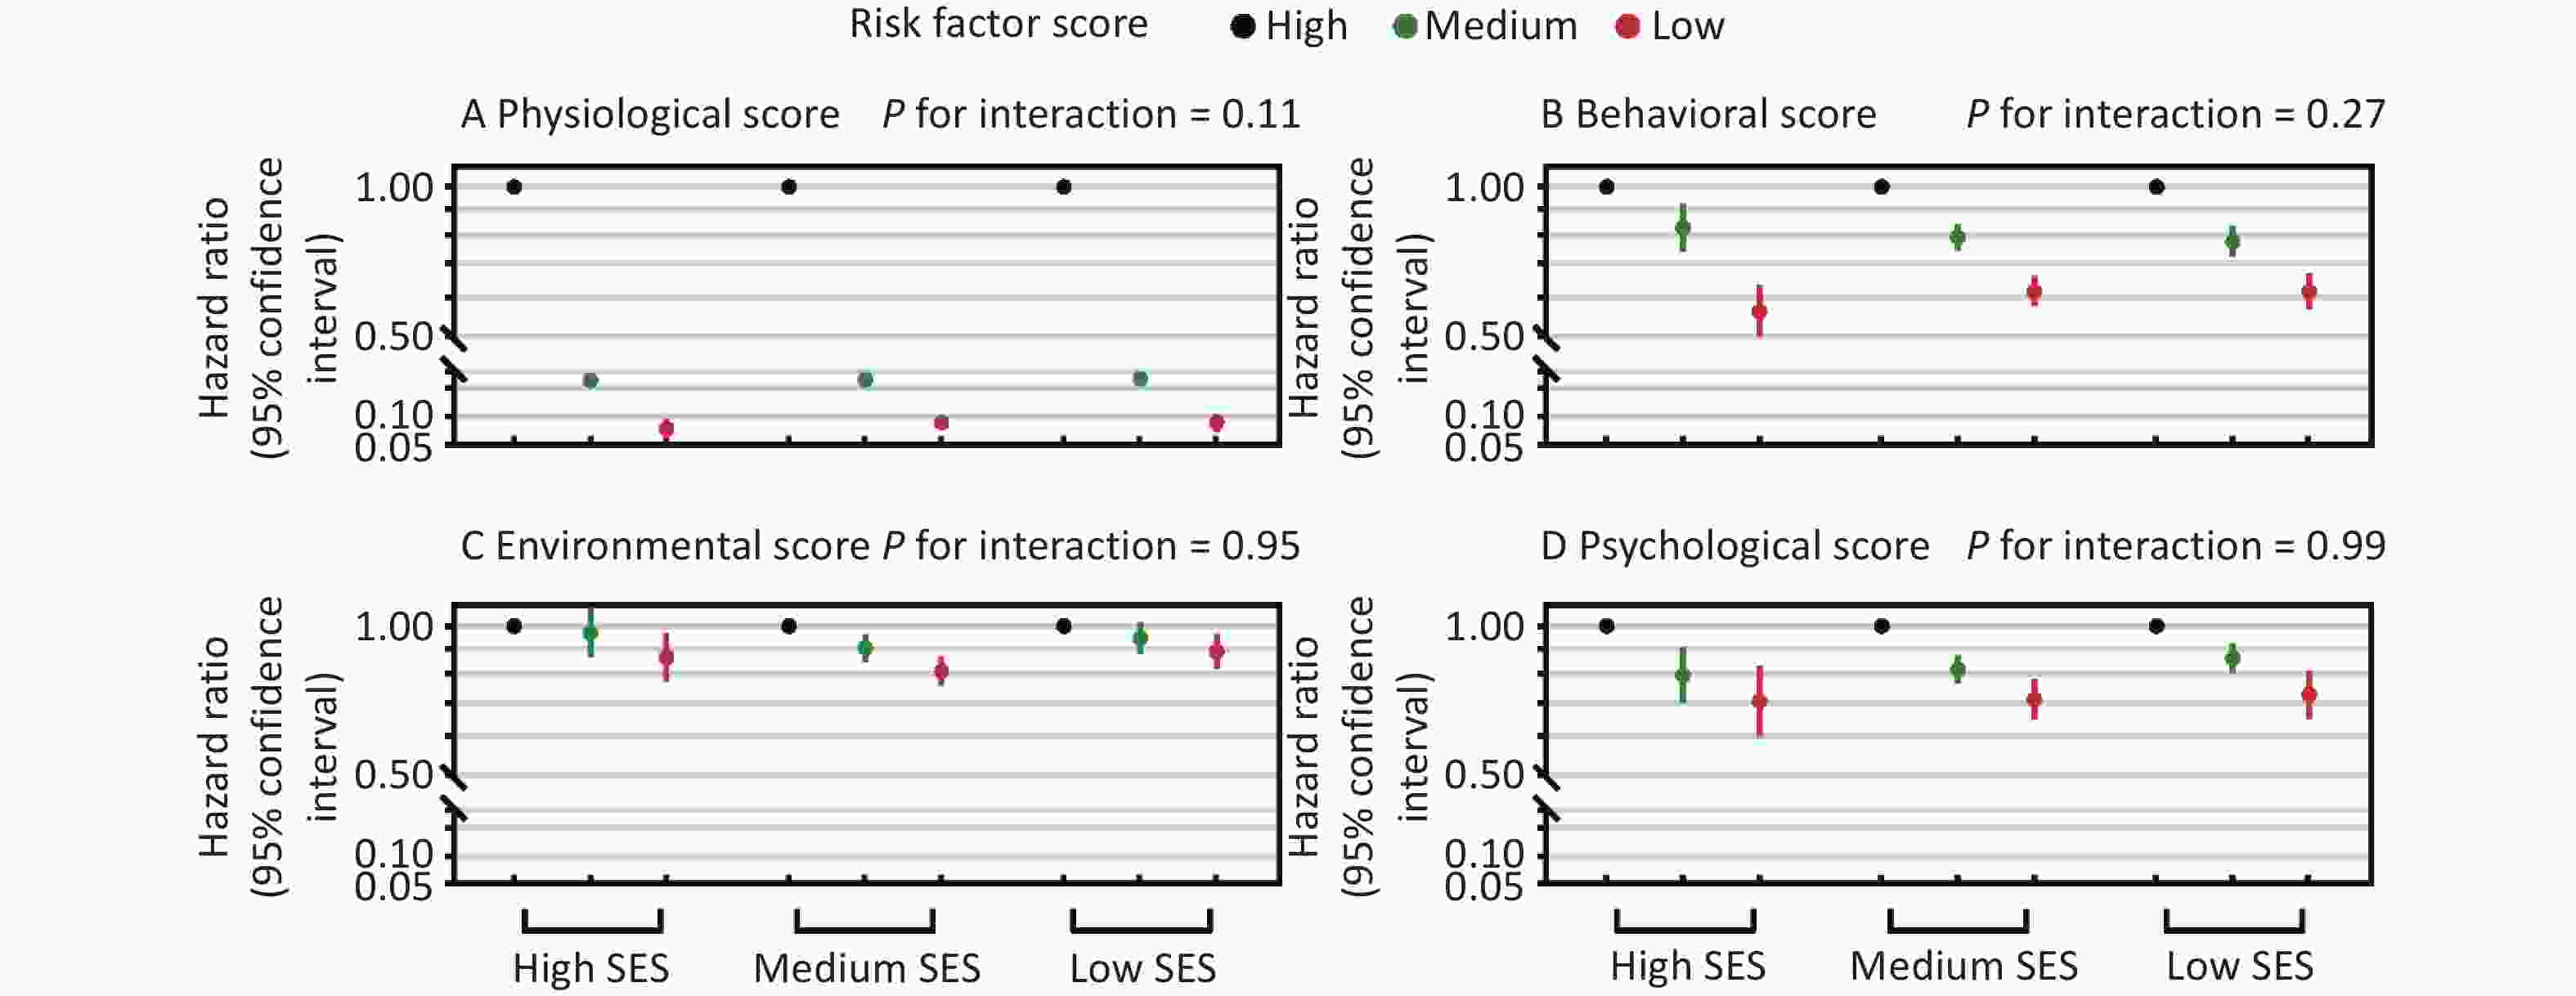
Figure 2. Multiplicative interactions between socioeconomic status (SES) and modifiable diabetes risk factor scores in relation to incident diabetes. Hazard ratios for diabetes are shown across three SES groups according to tertiles of physiological, behavioral, environmental, and psychological risk factor scores. Multiplicative interaction evaluates whether the associations between risk factor profiles and hazard ratios of diabetes differ across SES groups, thereby indicating which SES groups may have greater benefits related to favorable risk factor profiles on a relative scale (hazard ratio). Hazard ratios and P values for multiplicative interactions were estimated using Cox regression models adjusted for age, sex, race/ethnicity, family history of diabetes, and alcohol drinking. The four risk factor scores were mutually adjusted. The x-axis represents SES categories, and the y-axis represents hazard ratios. Black, green, and red circles indicate the top (most favorable; reference, hazard ratio=1.0), middle, and bottom tertiles of each risk factor score, respectively, with vertical lines indicating 95% confidence intervals.
-
Disadvantaged SES was associated with excess diabetes risk in UK adults. Participants with low SES had a 2.47-fold risk of diabetes and 2.7 more incident diabetes cases per 1000 person-years, compared to those with high SES. Physiological, behavioral, environmental, and psychological factors explained 54.4% of the association, with physiological factors making the largest contribution (39.1%), highlighting the possibility of reducing socioeconomic inequity in diabetes by comprehensively addressing diabetes risk factors. Additionally, we illustrated the additive interactions between overall modifiable diabetes risk profiles and SES, and diabetes risk reductions related to healthy physiological, behavioral, environmental, and psychological profiles were more pronounced among individuals with low SES compared to those with high SES.
SES is a multidimensional concept including economic, educational, and occupational status[4]; however, previous studies only focused on individual socioeconomic factors and cannot quantify the association between overall SES and incident diabetes[4,22]. For the first time, our study comprehensively used information on income, education, and occupation to evaluate individuals’ overall SES via latent class analysis, and found medium and low SES were associated with almost 50% and 150% higher risks of diabetes compared with high SES, respectively. Besides, the association between overall SES and incident diabetes was stronger than the associations of individual socioeconomic factors.
Given the increasing socioeconomic inequity in diabetes prevalence in the UK[3,23], addressing disparities related to socioeconomic status (SES) is increasingly urgent. Although SES shapes lifestyle and other health-related conditions that influence diabetes risk, evidence on the mediating role of lifestyle has been inconsistent, with reported mediation proportions ranging from none to 48.6%[6-9]. Only two studies investigated multiple types of mediators simultaneously: the Whitehall II cohort study constructed a cumulative SES score based on paternal occupation and participants’ occupation education, and reported that lifestyle and inflammatory markers jointly explained 40% of the SES-diabetes association, although income was not considered[8]; the English Longitudinal Study of Ageing reported that lifestyle, BMI, and psychological factors jointly explained 48.6%–87.6% of the associations of education, income, and occupation with diabetes risk among women, however, none of these socioeconomic factors were associated with incident diabetes among men[6]. These analyses did not mutually adjust for individual socioeconomic factors, and the estimated mediation proportion might be overestimated. To address these gaps, we constructed a latent class measure of overall SES incorporating income, education, and occupation, and systematically evaluated a broad set of potential mediators spanning physiological, behavioral, environmental, and psychological domains. We found that these factors jointly explained 54.4% of the association between SES and incident diabetes, suggesting that comprehensive risk factor management may help reduce socioeconomic disparities in diabetes. Notably, the joint mediation proportion of all four scores (54.4%) was smaller than the sum of the mediation proportions estimated for each score separately, suggesting overlap and interrelated pathways across physiological, behavioral, environmental, and psychological factors. Still, about half of the association between SES and incident diabetes was not mediated by these factors, and targeting socioeconomic inequality is essential to eliminate socioeconomic inequity in diabetes.
Another important public health question is whether diabetes risk reductions related to favorable modifiable risk factor profiles differ across SES groups, as identifying the groups that benefit most can inform more cost-effective prevention strategies. Our analysis showed that healthier physiological, behavioral, environmental, and psychological profiles were associated with larger reductions in diabetes incidence among individuals with low SES than among those with high SES. These findings are consistent with our previous UK Biobank analysis, which demonstrated stronger associations between overall lifestyle and risks of mortality and cardiovascular disease among individuals with low SES[11]. Together, these results suggest that prioritizing populations with low SES for comprehensive diabetes risk factor management may yield greater population-level benefits.
Whether two exposures interact depends on the scale on which effects are measured. Interaction on the additive scale does not necessarily imply interaction on the multiplicative scale[24]. We did not observe statistically significant multiplicative interaction between SES and risk factor scores, suggesting that the relative associations between modifiable risk factor profiles and diabetes risk were broadly similar across SES groups. In contrast, the observed additive interactions suggest that the absolute reductions in diabetes incidence associated with more favorable modifiable risk factor profiles might be greater among individuals with low SES. The additive interaction has greater public health implications, as it indicates that individuals with low SES should be prioritized for comprehensive diabetes risk factor management.
Our study has several advantages. We constructed a variable to comprehensively evaluate participants’ SES using latent class analysis. Also, exhausted participants’ modifiable risk factors of diabetes were exhausted from the UK Biobank database, and all potential modifiable mediators linking SES to diabetes risk were selected. Additionally, the large sample size and incident cases, as well as the long follow-up duration, provided us with sufficient power to perform the analyses, especially for the interaction tests.
Several limitations should be acknowledged. First, information on SES and risk factors for diabetes was only measured once and partially self-reported; thus, measurement errors were inevitable, and changes in SES and risk factors cannot be evaluated. Future studies with repeated and objective measurements are still needed. Besides, participants excluded due to missing SES could cause selection bias. Second, overall modifiable diabetes risk profiles were constructed according to available information collected by the UK Biobank, and the mediation proportion could be underestimated due to unmeasured factors (e.g., exposure to environmental chemicals, biomarkers such as interleukin, and chronic stress)[16] and biological susceptibility arising from gene-environment interaction. Third, due to the nature of the observational study, although we controlled for key demographic characteristics, alcohol drinking, and family history of diabetes, residual confounding (e.g., early-life SES) was still possible, and effect estimates (i.e., HR, IRD, interaction, and mediation proportions) should be interpreted with caution. Besides, given that both diabetes risk factors and SES variables were collected at the same time, the causation of the mediation analysis cannot be inferred, and it is possible that some participants with severe physiological conditions experienced subsequent declines in SES. Fourth, the participants were predominantly White British, and the results might not be directly extrapolated into other populations with different economic levels, ethnic backgrounds, health insurance systems, and cultures. Future studies using data from other populations are needed.
-
Low SES was associated with higher diabetes risk, with physiological, behavioral, environmental, and psychological profiles jointly mediating half of the association, suggesting that comprehensively addressing modifiable risk factors may help reduce socioeconomic disparities in diabetes. Moreover, reductions in diabetes incidence associated with favorable levels of these risk factors were greater among individuals with low SES than among those with high SES, highlighting the potential public health significance to prioritize populations with low SES for interventions targeting overall modifiable diabetes risk profiles. In clinical settings, evaluating socioeconomic context may help identify individuals at elevated diabetes risk due to a clustering of unfavorable modifiable risk factors. Comprehensive assessment and management of these risk factors tailored to individuals’ socioeconomic circumstances may improve the feasibility and effectiveness of diabetes prevention in routine care. At the policy level, strategies aimed at reducing structural barriers may facilitate healthier behaviors and physiological profiles, such as improving access to preventive healthcare, enhancing neighborhood environments, and strengthening social and economic supports, thereby reducing socioeconomic disparities in diabetes risk.
doi: 10.3967/bes2026.037
Modifiable Risk factors and Socioeconomic Inequity in Diabetes: A Prospective Analysis in the UK Biobank
-
Abstract:
Objective To examine the association between overall socioeconomic status (SES) and incident diabetes, to estimate how much of the SES-diabetes association is explained by modifiable diabetes risk factors, and to assess whether the benefits of favorable risk factor profiles differ by SES. Methods We analyzed 337,229 adults without diabetes at baseline from the UK Biobank. Overall SES was derived using latent class analysis based on income, occupation, and education. Modifiable diabetes risk factor scores were constructed across physiological, behavioral, environmental, and psychological domains. Cox proportional hazard models and additive hazard models were used to evaluate associations, mediation proportions, and interactions for incident diabetes. Results During a median follow-up of 12.5 years, 11,557 participants developed diabetes ascertained through linkage to registries. The low SES group had 2.13-fold (95% CI 2.01–2.25) diabetes risk and 2.7 (2.5–2.8) more incident diabetes cases per 1000 person-years compared to the high SES group, 54.4% of which was explained by all modifiable factors jointly, with physiological score contributing to the largest proportion (39.1%). Favorable risk factor profiles were associated with lower diabetes risk across all SES groups, and absolute risk reductions associated with favorable profiles were greatest among individuals with low SES (P for additive interaction ≤ 0.002). Conclusion More than half of the excess diabetes risk associated with low SES can be explained by modifiable risk factors. Improving these factors may contribute to greater reduction in diabetes incidence among socioeconomically disadvantaged populations, supporting targeted diabetes prevention strategies to reduce socioeconomic disparities. -
Key words:
- Diabetes /
- Environment /
- Interaction /
- Lifestyle /
- Mediation /
- Psychology /
- Socioeconomic status
The authors declare that they have no conflict of interest.
The UK Biobank was approved by the North West Multi-Centre Research Ethics Committee. All participants provided written informed consent.
Generated the hypotheses: Yanbo Zhang and An Pan; Contributed to the analytic strategy: Yanbo Zhang, Qi Lu, and Yue Li; wrote the manuscript: Yanbo Zhang; Contributed to data interpretation, edited the manuscript, read and approved the manuscript: All authors.
Not applicable.
注释:1) Funding: 2) Competing Interests: 3) Ethics: 4) Authors' Contributions: 5) Consent for Publication: -
Figure 1. Additive interactions between socioeconomic status (SES) and modifiable diabetes risk factor scores in relation to incident diabetes. Incidence rate differences in diabetes are shown across three SES groups according to tertiles of physiological, behavioral, environmental, and psychological risk factor scores. Additive interaction evaluates whether the absolute reduction in diabetes incidence associated with favorable risk factor profiles differs across SES groups, thereby indicating which SES groups may have greater absolute benefit related to favorable risk factor profiles. Incidence rate differences and P values for additive interactions were estimated using additive hazard models adjusted for age, sex, race/ethnicity, family history of diabetes, and alcohol drinking. The four risk factor scores were mutually adjusted. The x-axis represents SES categories, and the y-axis represents incidence rate differences (per 1000 person-years). Black, green, and red rectangles indicate the top (most favorable; reference, incidence rate difference = 0.0), middle, and bottom tertiles of each risk factor score, respectively, with vertical lines indicating 95% confidence intervals.
Figure 2. Multiplicative interactions between socioeconomic status (SES) and modifiable diabetes risk factor scores in relation to incident diabetes. Hazard ratios for diabetes are shown across three SES groups according to tertiles of physiological, behavioral, environmental, and psychological risk factor scores. Multiplicative interaction evaluates whether the associations between risk factor profiles and hazard ratios of diabetes differ across SES groups, thereby indicating which SES groups may have greater benefits related to favorable risk factor profiles on a relative scale (hazard ratio). Hazard ratios and P values for multiplicative interactions were estimated using Cox regression models adjusted for age, sex, race/ethnicity, family history of diabetes, and alcohol drinking. The four risk factor scores were mutually adjusted. The x-axis represents SES categories, and the y-axis represents hazard ratios. Black, green, and red circles indicate the top (most favorable; reference, hazard ratio=1.0), middle, and bottom tertiles of each risk factor score, respectively, with vertical lines indicating 95% confidence intervals.
Table 1. Baseline characteristics of participants across socioeconomic status groups
Socioeconomic status High Medium Low Total, n (%) 90,252 (26.8) 172,825 (51.2) 74,152 (22.0) Mean age (SD), y 51.9 (7.0) 55.2 (8.0) 59.5 (7.5) Men, n (%) 47,074 (52.2) 78,413 (45.4) 30,810 (41.6) Non-white, n (%) 3,338 (3.7) 8,073 (4.7) 4,179 (5.6) Family history of diabetes, n (%) 18,153 (20.1) 36,705 (21.2) 15,845 (21.4) Annual income of ≥ ₤31,000, n (%) 90,252 (100.0) 90,274 (52.2) 5,464 (7.4) Skilled job, n (%) 76,662 (84.9) 102,554 (59.3) 1,687 (2.3) College or university degree, n (%) 55,258 (61.2) 60,441 (35.0) 8,021 (10.8) Physiological factors Mean physiological score (SD) 18.5 (1.7) 18.1 (1.8) 17.5 (1.9) Serum glycated hemoglobin of < 39 mmol/moL, n (%) 77,825 (86.2) 141,605 (81.9) 56,709 (76.5) No prevalent dyslipidemia, n (%) 57,169 (63.3) 100,727 (58.3) 37,196 (50.2) Body mass index of < 30 kg/m2, n (%) 74,212 (82.2) 136,169 (78.8) 54,575 (73.6) Waist-to-hip ratio of < 0.90/0.85 for men/women, n (%) 52,373 (58.0) 93,981 (54.4) 34,839 (47.0) Serum uric acid of ≤ 7.6/6.6 mg/dL, n (%) 85,177 (94.4) 163,139 (94.4) 69,011 (93.1) C-reactive protein < 5 mg/L, n (%) 84,090 (93.2) 156,743 (90.7) 63,958 (86.3) Normal sex hormone binding globulin level, n (%) 75,924 (84.1) 145,178 (84.0) 62,192 (83.9) Platelet count of 169.06-397.10*103 cells/μL, n (%) 84,935 (94.1) 162,190 (93.9) 69,061 (93.1) No prevalent hypertension, n (%) 48,713 (54.0) 78,920 (45.7) 25,942 (35.0) No prevalent non-alcoholic fatty liver disease or liver malfunction, n (%) 73,490 (81.4) 143,498 (83.0) 61,103 (82.4) No prevalent chronic kidney disease, n (%) 80,688 (89.4) 151,808 (87.8) 62,984 (84.9) No prevalent hyperthyroidism or hypothyroidism, n (%) 86,474 (95.8) 163,092 (94.4) 68,498 (92.4) No severe peridontal disease, n (%) 88,052 (97.6) 166,338 (96.3) 69,791 (94.1) No prevalent asthma, n (%) 78,962 (87.5) 152,431 (88.2) 64,935 (87.6) No prevalent chronic obstructive pulmonary disease, n (%) 88,580 (98.2) 168,249 (97.4) 70,329 (94.8) No prevalent inflammatory bowel disease, n (%) 89,387 (99.0) 171,020 (99.0) 73,212 (98.7) No prevalent systemic autoimmune disorders, n (%) 89,921 (99.6) 171,782 (99.4) 73,481 (99.1) No prevalent rheumatoid arthritis, n (%) 89,726 (99.4) 171,081 (99.0) 72,710 (98.1) No prevalent psoriasis, n (%) 88,534 (98.1) 169,225 (97.9) 72,446 (97.7) No prevalent osteoarthritis, n (%) 84,724 (93.9) 154,849 (89.6) 60,501 (81.6) No prevalent atopic dermatitis, n (%) 88,554 (98.1) 169,373 (98.0) 72,567 (97.9) Behavioral factors Mean behavioral score (SD) 3.4 (1.1) 3.2 (1.2) 3.0 (1.1) Cardiovascular health diet score of ≥ 5 points, n (%) 14,458 (16.0) 31,015 (18.0) 14,100 (19.0) Healthy sleep score of 4–5 points, n (%) 61,092 (67.7) 115,532 (66.9) 47,578 (64.2) ≥ 150 minutes/week of moderate to vigorous leisure-time physical activity, n (%) 38,567 (42.7) 63,872 (37.0) 25,037 (33.8) Bottom two quintiles of sedentary time, n (%) 38,474 (42.6) 59,703 (34.6) 19,328 (26.1) No current active smoking, n (%) 86,449 (95.8) 160,513 (92.9) 64,903 (87.5) No current passive smoking, n (%) 67,887 (75.2) 120,762 (69.9) 49,367 (66.6) Current no or moderate alcohol drinking, n (%) 36,275 (40.2) 87,460 (50.6) 44,991 (60.7) Environmental factors Mean environmental score (SD) 2.6 (1.8) 2.3 (1.8) 2.0 (1.7) Bottom two quintiles of average sound level, n (%) 36,319 (40.2) 67,974 (39.3) 28,632 (38.6) Bottom two quintiles of nitrogen dioxide, n (%) 39,080 (43.3) 70,398 (40.7) 25,429 (34.3) Bottom two quintiles of PM10, n (%) 34,612 (38.4) 64,379 (37.3) 25,350 (34.2) Bottom two quintiles of PM2.5, n (%) 37,882 (42.0) 64,409 (37.3) 23,176 (31.3) Top two quintiles of the percentage of the home location buffer at 1 km classed as natural environment, n (%) 37,840 (41.9) 70,212 (40.6) 26,722 (36.0) Bottom two quintiles of health deprivation score, n (%) 53,069 (58.8) 67,278 (38.9) 17,319 (23.4) Psychological factors Mean psychological score (SD) 3.7 (1.0) 3.4 (1.1) 3.2 (1.2) Live with relatives or visit friends/family more than once a week, n (%) 86,971 (96.4) 154,262 (89.3) 62,163 (83.8) Attend social group activity once a week or more often, n (%) 65,345 (72.4) 123,345 (71.4) 49,163 (66.3) Confide in someone close to you more than once a week, n (%) 64,439 (71.4) 111,749 (64.7) 42,758 (57.7) No stress events in last 2 years, n (%) 55,506 (61.5) 97,656 (56.5) 39,908 (53.8) No depression, n (%) 61,211 (67.8) 104,235 (60.3) 39,693 (53.5) Note. Differences among socioeconomic groups were tested through analysis of variance and χ2 test for continuous and categorical variables, respectively, and all P values were < 0.001. SD, standard deviation.  下载: 导出CSV
Table 2. Associations of socioeconomic status with diabetes risk
Model Socioeconomic status, HR (95% CI) High Medium Low Mediation (%, 95% CI) Base model 1.00 1.49 (1.41 to 1.57) 2.47 (2.33 to 2.62) − Base model + physical mediators 1.00 1.32 (1.25 to 1.40) 1.74 (1.64 to 1.84) 39.1 (36.6 to 41.8) Base model + behavioral mediators 1.00 1.38 (1.30 to 1.45) 2.11 (1.99 to 2.24) 17.4 (16.2 to 18.6) Base model + environmental mediators 1.00 1.45 (1.37 to 1.53) 2.33 (2.19 to 2.47) 6.6 (6.0 to 7.3) Base model + psychological mediators 1.00 1.42 (1.34 to 1.50) 2.22 (2.09 to 2.36) 11.7 (10.8 to 12.7) Base model + all mediators 1.00 1.24 (1.17 to 1.31) 1.51 (1.42 to 1.61) 54.4 (50.9 to 58.0) Note. Base model adjusted for age, sex, race/ethnicity, alcohol drinking, and family history of diabetes. The mediation proportion is the proportion of the association between low (vs. high) socioeconomic status and diabetes risk that is explained by the mediators. CI, confidence interval; HR, hazard ratio.
下载: 导出CSV
-
[1] International Diabetes Federation. IDF diabetes atlas 2021. https://diabetesatlas.org/media/uploads/sites/3/2025/02/IDF_Atlas_10th_Edition_2021.pdf. [2022-08-13] [2] Nishino Y, Gilmour S, Shibuya K. Inequality in diabetes-related hospital admissions in England by socioeconomic deprivation and ethnicity: facility-based cross-sectional analysis. PLoS One, 2015; 10, e0116689. doi: 10.1371/journal.pone.0116689 [3] Wang J, Wild SH. Marked and widening socioeconomic inequalities in type 2 diabetes prevalence in Scotland. J Epidemiol Community Health, 2022; 76, 482−84. doi: 10.1136/jech-2021-217747 [4] Hill-Briggs F, Fitzpatrick SL. Overview of social determinants of health in the development of diabetes. Diabetes Care, 2023; 46, 1590−8. doi: 10.2337/dci23-0001 [5] Quaglia A, Lillini R, Mamo C, et al. Socio-economic inequalities: a review of methodological issues and the relationships with cancer survival. Crit Rev Oncol Hematol, 2013; 85, 266−77. doi: 10.1016/j.critrevonc.2012.08.007 [6] Demakakos P, Marmot M, Steptoe A. Socioeconomic position and the incidence of type 2 diabetes: the ELSA study. Eur J Epidemiol, 2012; 27, 367−78. doi: 10.1007/s10654-012-9688-4 [7] Ross NA, Gilmour H, Dasgupta K. 14-year diabetes incidence: the role of socio-economic status. Health Rep, 2010; 21, 19−28. [8] Stringhini S, Tabak AG, Akbaraly TN, et al. Contribution of modifiable risk factors to social inequalities in type 2 diabetes: prospective Whitehall II cohort study. BMJ, 2012; 345, e5452. doi: 10.1136/bmj.e5452 [9] Williams ED, Tapp RJ, Magliano DJ, et al. Health behaviours, socioeconomic status and diabetes incidence: the Australian Diabetes Obesity and Lifestyle Study (AusDiab). Diabetologia, 2010; 53, 2538−45. doi: 10.1007/s00125-010-1888-4 [10] Sudlow C, Gallacher J, Allen N, et al. UK biobank: an open access resource for identifying the causes of a wide range of complex diseases of middle and old age. PLoS Med, 2015; 12, e1001779. doi: 10.1371/journal.pmed.1001779 [11] Zhang YB, Chen C, Pan XF, et al. Associations of healthy lifestyle and socioeconomic status with mortality and incident cardiovascular disease: two prospective cohort studies. BMJ, 2021; 373, n604. [12] Harrison S, Davies AR, Dickson M, et al. The causal effects of health conditions and risk factors on social and socioeconomic outcomes: mendelian randomization in UK Biobank. Int J Epidemiol, 2020; 49, 1661−81. doi: 10.1093/ije/dyaa114 [13] Lee JJ, Wedow R, Okbay A, et al. Gene discovery and polygenic prediction from a genome-wide association study of educational attainment in 1.1 million individuals. Nat Genet, 2018; 50, 1112−21. doi: 10.1038/s41588-018-0147-3 [14] Lanza ST, Collins LM, Lemmon DR, et al. PROC LCA: a SAS procedure for latent class analysis. Struct Equ Modeling, 2007; 14, 671−94. doi: 10.1080/10705510701575602 [15] Zhang YB, Li Y, Geng TT, et al. Overall lifestyles and socioeconomic inequity in mortality and life expectancy in China: the China health and nutrition survey. Age Ageing, 2022; 51, afac167. doi: 10.1093/ageing/afac167 [16] Yuan S, Larsson SC. An atlas on risk factors for type 2 diabetes: a wide-angled Mendelian randomisation study. Diabetologia, 2020; 63, 2359−71. doi: 10.1007/s00125-020-05253-x [17] Zhao YM, Li YY, Zhuang ZH, et al. Associations of polysocial risk score, lifestyle and genetic factors with incident type 2 diabetes: a prospective cohort study. Diabetologia, 2022; 65, 2056−65. doi: 10.1007/s00125-022-05761-y [18] Lin DY, Ying ZL. Semiparametric analysis of the additive risk model. Biometrika, 1994; 81, 61−71. doi: 10.2307/2337050 [19] VanderWeele TJ. Mediation analysis: a practitioner's guide. Annu Rev Public Health, 2016; 37, 17−32. [20] Nevo D, Liao XM, Spiegelman D. Estimation and inference for the mediation proportion. Int J Biostat, 2017; 13, 20170006. doi: 10.1515/ijb-2017-0006 [21] Knol MJ, VanderWeele TJ, Groenwold RH, et al. Estimating measures of interaction on an additive scale for preventive exposures. Eur J Epidemiol, 2011; 26, 433−8. doi: 10.1007/s10654-011-9554-9 [22] Agardh E, Allebeck P, Hallqvist J, et al. Type 2 diabetes incidence and socio-economic position: a systematic review and meta-analysis. Int J Epidemiol, 2011; 40, 804−18. doi: 10.1093/ije/dyr029 [23] Imkampe AK, Gulliford MC. Increasing socio-economic inequality in type 2 diabetes prevalence—repeated cross-sectional surveys in England 1994-2006. Eur J Public Health, 2011; 21, 484−90. doi: 10.1093/eurpub/ckq106 [24] VanderWeele TJ. The interaction continuum. Epidemiology, 2019; 30, 648−58. doi: 10.1097/EDE.0000000000001054 -

 点击查看大图
计量
- 文章访问数: 25
- HTML全文浏览量: 10
- PDF下载量: 0
- 被引次数: 0

 Quick Links