


HTML
-
The aging of the population has become a serious global issue[1]. The Chinese population is aging at an increased speed, and a particularly rapid rate in Beijing. According to the Fourth nationwide census, the percentage of residents over 60 years of age in Beijing had already reached 14% in 1997 and is expected to reach 30% by the year 2025[2]. As like aging, overweight and obesity are also global health problems. The overweight and obese population in Beijing is increasing rapidly as well. Standardized rates of obesity among adult residents increased from 16.9% in 2005 to 21.1% in 2011, and overweight increased from 35.5% to 37.3%[3]. The association between body weight and health has received considerable attention. Some studies have focused on the association between increased body mass index (BMI) and mortality[4-5], while some have focused on low BMI[6-9]. These studies have mostly targeted adults. Older people are more likely to have a higher BMI. Since 2000, according to the accepted Chinese standard of BMI categories, more than half of the elderly population in China had a BMI beyond the normal range, which ranges from 18.5 kg/m2 to 24.0 kg/m2. There are some unique factors that impact BMI, such as the decreased height and muscle, which in return result in relatively higher body fat percentages. Moreover, changes in hormone secretions and reduced activity after retirement can impact BMI[10]. A survey based on a large contemporary Danish population showed that the association between BMI and mortality is decreasingly U-shaped, with BMI increasing for those aged 70-95 years[11]. Studies that explore BMI and BMI changes to mortality based on elderly Chinese people are sparse. Beijing, as the capital of China, is regarded as an example for other developing cities in China. Therefore, the relationship between BMI or BMI changes and mortality among the elderly in Beijing can have important implications for other cities. This paper aims to explore the relationship of BMI and BMI changes with all-cause mortality among aging people in Beijing.
-
The population in our study was from the Beijing multidimensional longitudinal study of aging (BLSA), acommunity-based cohort study begun in August 1992 and hosted by Xuanwu Hospital. The sample was selected using a three-stage stratification random clustering procedure. First, Xuanwu (urban), Daxing (suburban) and Huairou (rural) districts were selected to represent the 18 administrative districts in Beijing. Second, among these three districts, specific neighborhoods (streets or villages) were randomly selected. Third, the subjects were selected from these neighborhood units and villages using a systematic sampling method. In total, 2090 individuals were included in our study and their weight, height and follow-up measurements were recorded.
-
Weight and height were first measured at baseline in 1992; the second measurements were taken in 2000 by medical staff. BMI was defined as weight (kg) divided by the square of height (m) and was classified into the following categories according to the accepted Chinese BMI standard: underweight (BMI < 18.5 kg/m2), normal weight (18.5≤BMI < 24.0 kg/m2), overweight (24.0≤BMI < 28.0 kg/m2), and obese (BMI≥28.0 kg/m2). In the BMI-mortality curve, BMI was also divided into 8 intervals, each containing an equal number of subjects. This division was conducted to ensure that each interval included enough subjects in the different gender and age subgroups. Mortality was defined as the sum of death divided by the sum of survival time in each interval. The dots of the abscissa values were the mean of the BMI for each interval.
-
The baseline measurement was conducted in 1992, and follow-ups were conducted seven times at approximately 2-3 year intervals. The observation period began in August 1992, and ended in August 2012. If any deaths occurred, the dates and causes of deaths were recorded; causes of deaths were obtained from official death certificates, supplemented. If necessary, relevant medical records were reviewed. Underlying causes of deaths were coded according to the 9th International Classification of Diseases (ICD-9).
-
Among the variables from the original studies, the covariates selected a priori as potential confounders included age at baseline, gender, smoking status, drinking status, and disease status [such as hypertension, coronary heart disease, rheumatic heart disease and chronic obstructive pulmonary disease (COPD)]. Gender and age were required to fill in the questionnaire. Smoking status was obtained through the question 'do you usually smoke?' in the questionnaire and the answer choices were 'yes or no'; drinking status was obtained through the question 'do you usually drink?', and further questions asked about consumption in more detail. Disease status was obtained through questions such as 'do you have hypertension?', 'do you have coronary heart disease or rheumatic heart disease?', or 'do you have COPD?' Similar questions were asked about other diseases.
-
Characteristics of subjects were presented as the means±SDs for continuous variables and absolute and relative numbers of subjects for ordinal categories. The significance level was set at P < 0.05; t-tests were used to compare continuous variables. The distributions of BMI and follow-up measurements are shown; chi-square tests were used to determine whether the differences were statistically significant. A BMI-mortality curve was drawn with BMI values divided into ten intervals.
We calculated the hazard ratios (HRs) for all-cause mortality associated with the different BMI categories. Four different Cox models were used: model 1 was not adjusted; model 2 was adjusted for gender and age; model 3 additionally adjusted for smoking status and drinking status; and model 4 was further adjusted for pre-existing diseases such as hypertension, coronary heart disease, rheumatic heart disease and COPD. The curve was performed in Excel 2013, and the other calculations were performed using SPSS 21.0.
Target Population
Body Mass Index
Outcomes and Follow-up
Covariates
Statistical Analysis
-
There were 2090 individuals in our cohort study. The characteristics for the whole population and for different BMI categories were shown in Table 1. The mean age was 69.25±8.58 years old, and the mean BMI was 23.25±3.98 kg/m2 at baseline. In total, 11.39% of the population was underweight, 45.55% were normal weight, 31.63% were overweight and 11.43% were obese. Participants who were male and who reported smoking and drinking were expected to have a lower BMI; and BMI was expected to decline with advancing age. At baseline, a higher BMI was associated with a higher prevalence of pre-existing diseases, including hypertension, coronary heart disease, rheumatic heart disease and COPD.
Characteristic All, n (%) BMI (kg/m2), n (%) P Value < 18.5 18.5-23.9 24.0-27.9 ≥28 Gender Female 1059 (50.70) 119 (50.00) 418 (43.91) 369 (55.82) 153 (64.02) < 0.01 Male 1031 (49.30) 119 (50.00) 534 (56.09) 292 (44.18) 86 (35.98) Age (y) 55-64 719 (34.00 53 (22.27) 278 (29.20) 267 (40.39) 121 (50.63) < 0.01 65-74 745 (36.00) 73 (30.67) 338 (35.50) 250 (37.82) 84 (35.15) 75-95 626 (30.00) 112 (47.06) 336 (35.30) 144 (21.79) 34 (14.22) Smoking No 1469 (70.00) 138 (57.98) 629 (66.07) 511 (77.31) 191 (79.92) < 0.01 Yes 621 (30.00) 100 (42.02) 323 (33.93) 150 (22.69) 48 (20.08) Drinking No 447 (21.00) 30 (12.61) 217 (22.79) 151 (22.84) 49 (20.50) < 0.01 Yes 1643 (79.00) 208 (87.39) 735 (77.21) 510 (77.16) 190 (79.50) Disease# No 1485 (71.00) 215 (90.34) 728 (76.47) 401 (60.67) 141 (59.00) < 0.01 Yes 605 (29.00) 23 (9.66) 224 (23.53) 260 (39.33) 98 (41.00) Note. #Disease: pre-existing diseases, including hypertension, coronary heart disease, rheumatic heart disease and COPD. Table 1. Basic Characteristic of Participants by BMI Category
The outcomes of the participants are shown in Table 2. During the 20-year follow-up, 1164 deaths, accounting for 55.96% of the total population, were recorded. Among the causes of death, the top three were cardiovascular disease, cerebrovascular disease and tumor. The prevalence of all-cause mortality was 71.4% in the underweight group, 60.3% for the normal weight group, 45.7% for the overweight group, and 49.4% for the obese group.
Outcomes All BMI (kg/m2) < 18.5 18.5-23.9 24.0-27.9 ≥28 n (%) n (%) n (%) n (%) n (%) Survival 926 44.31 68 28.57 378 39.71 359 54.31 121 50.63 Cardiovascular disease 253 12.11 40 16.81 123 12.92 65 9.83 25 10.46 Cerebrovascular disease 240 11.48 30 12.61 118 12.39 60 9.08 32 13.39 Tumor 129 6.17 17 7.14 57 5.99 39 5.90 16 6.69 Respiratory disease 101 4.83 20 8.40 57 5.99 18 2.72 6 2.51 Digestive disease 27 1.29 1 0.42 11 1.16 13 1.97 2 0.84 Harm & poisoning 26 1.24 2 0.84 17 1.79 2 0.30 5 2.09 Kidney disease 14 0.67 1 0.42 4 0.42 5 0.76 4 1.67 Diabetes mellitus 13 0.62 1 0.42 3 0.32 8 1.21 1 0.42 Other reason 133 6.36 13 5.46 66 6.93 38 5.75 16 6.69 Natural death 183 8.76 40 16.81 93 9.77 42 6.35 8 3.35 Total 2090 100.00 238 100.00 952 100.00 661 100.00 239 100.00 Table 2. Description of Outcomes Including Survival and Specific Disease Mortality by BMI Category
-
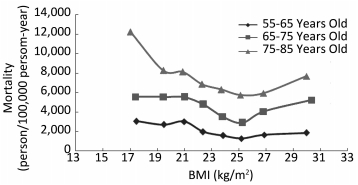
To determine the relationship between BMI and mortality, a BMI-mortality curve was drawn and is presented in Figure 1, showing that people with a BMI of approximately 25 kg/m2had the lowest mortality. The figure also indicated that, for lower ranges of BMI, the mortality of men was higher than that of women; but for higher BMI ranges, the difference narrowed. BMI-mortality curves stratified by age are shown in Figure 2; the ranges of BMI associated with the lowest mortality in different age groups were closed to each other. Furthermore, as age increased, the mortality increased, and there is much higher mortality in the range of 75-95 years old, regardless of age, an underweight status was associated with a high mortality. Overall, the slope of the BMI-mortality curvesincreased with advancing age.
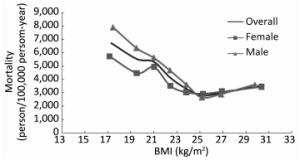
Figure 1. BMI-mortality curve in overall and different gender population.

Figure 2. BMI-Mortality curve in different age groups.
-
Cox model and HRs for the overall population are shown in Table 3. The normal weight group was regarded as the comparison group; HRs were calculated using different Cox models, in which different confounding factors were adjusted. The HR in the unadjusted model, i.e., model 1, was 1.45 (95% CI: 1.20-1.72) for the underweight group; and 0.65 (95% CI: 0.57-0.75) for the overweight group.
BMI Model 1 Model 2 Model 3 Model 4 HR (95% CI) HR (95% CI) HR (95% CI) HR (95% CI) 18.5-23.9 1 1 1 1 < 18.5 1.45*** (1.20-1.72) 1.41*** (1.19-1.67) 1.37*** (1.15-1.63) 1.39*** (1.16-1.65) 24.0-27.9 0.65*** (0.57-0.75) 0.76*** (0.66-0.88) 0.77*** (0.67-0.88) 0.76*** (0.66-0.88) ≥28 0.78*** (0.61-0.91) 1.01 (0.82-1.23) 1.02 (0.83-1.25) 1.01 (0.82-1.24) Note. ***P < 0.01; model 1 no adjusted; model 2 adjusted for gender and age; model 3 additionally adjusted for smoking status and drinking status; model 4 additionally adjusted for pre-existing disease like hypertension, coronary heart disease, rheumatic heart disease and COPD. Table 3. HRs of All-cause Mortality for BMI Categories in the Overall Population
In model 2, which adjusted for gender and age, the HR was 1.41 (95% CI: 1.19-1.67) for the underweight group and 0.76 (95% CI: 0.66-0.88) for the overweight group; the HR for the group with obesity was not statistically significant. When further adjusted for smoking status, drinking status, and pre-existing diseases such as hypertension, coronary heart disease, rheumatic heart disease and COPD, the HRs were closer to the results in model 2, as shown in Table 3.
The HRs of all-cause mortality for different BMI groups, stratified by gender, age, smoking status, drinking status and pre-existing disease, are shown in Table 4; the HRs for the same BMI group were different in different variable stratifications. Being underweight seemed to be a risk factor in the population aged over 75 years but not in the younger population. Overweight seemed to be a strong protective factor in men but not in women.
Characteristic BMI (x±s) HR (95% CI) < 18.5 24.0-27.9 ≥28 Gender Female 23.71±4.22 1.30** (1.00-1.68) 0.93 (0.76-1.14) 1.18# (0.90-1.54) Male 22.76±3.66 1.38*** (1.09-1.74) 0.64*** (0.52-0.80) 0.94## (0.68-1.29) Age (y) 55-64 24.25±3.93 1.10## (0.71-1.72) 0.67*** (0.50-0.90) 0.86 (0.59-1.27) 65-74 23.42±3.93 1.12## (0.82-1.53) 0.74*** (0.59-0.92) 1.14## (0.84-1.54) 75-95 21.87±3.71 1.55*** (1.22-1.98) 0.83 (0.66-1.05) 1.04 (0.68-1.58) Smoking No 23.69±3.98 1.31** (1.05-1.64) 0.78*** (0.66-0.92) 0.99## (0.78-1.26) Yes 22.19±3.80 1.38** (1.05-1.82) 0.75** (0.57-0.98) 1.33## (0.88-1.99) Drinking No 23.61±3.88 1.84** (1.15-1.95) 0.81 (0.59-1.12) 0.85 (0.50-1.45) Yes 23.14±4.01 1.27** (1.05-1.53) 0.76*** (0.64-0.89) 1.09### (0.87-1.36) Disease No 22.65±3.94 1.48*** (1.17-1.70) 0.82** (0.69-0.97) 1.09## (0.84-1.41) Yes 24.71±3.70 1.04 (0.60-1.81) 0.67*** (0.58-0.86) 0.96## (0.69-1.36) Note. **P < 0.05; ***P < 0.01 (compared with the normal weight group). #P < 0.1; ##P < 0.05;###P < 0.01 (significant in overweight group comparison but not in normal weight group comparison). Table 4. BMI and HRs of All-cause Mortality for BMI Categoriesin Subgroups
The HRs of all-cause mortality for BMI (1 kg/m2 increase) differed in each BMI group. In the underweight group, the HR for a 1 kg/m2increase was 0.817 (95% CI: 0.709-0.940); in the normal weight group, the protective effect weakened, with an HR of 0.904 (95% CI: 0.857-0.955); and in the overweight group the corresponding HR was 1.050 (95% CI: 0.948-1.162). When BMI reached the obese range, the HR was 1.150 (95% CI: 1.054-1.255), which turns out to be a risk factor.
-
Until the year 2000, there were 694 deaths and 1, 396 surviving individuals. Among the 1, 396 survivors, 1, 128 individuals took the second measurement. Missing values were filled according to a linear fitting in which the existing second BMI measurement values were regarded as dependent variables. Other factors, such as the first BMI measurement values, gender, age, smoking status, and drinking status were regarded as independent variables. The mean of the second BMI measurement was 23.81±3.64 kg/m2. BMI change per year was defined as (BMI2-BMI1)/8; BMI2 was the BMI in 2000 and BMI1 was the BMI in 1992. BMI change per year was divided into three intervals: a BMI change per year of less than-0.05 kg/m2was regarded as a BMI drop, a BMI change per year of more than 0.05 kg/m2 was regarded as a BMI rise, a BMI change per year between-0.05 kg/m2and 0.05 kg/m2 was regarded as stable BMI. In the overall population model after adjusting for BMI, gender, age, smoking status, drinking status, and pre-existing diseases, the HR for a BMI drop was 1.576 (95% CI: 1.209-2.054), for a BMI rise was 1.700 (95% CI: 1.311-2.205). The HRs for a BMI drop and rise in specific weight groups are shown in Table 5.
Changes HR (95% CI) BMI Drop BMI Stable BMI Rise Underweight 3.245* (0.824-12.772) 1 1.531 (0.631-3.714) Normal weight 1.892*** (1.291-2.773) 1 1.795*** (1.243-2.591) Overweight 1.434 (0.904-2.277) 1 1.962*** (1.202-3.203) Obese 0.525 (0.211-1.306) 1 0.402 (0.125-1.289) Note. *P < 0.1, *** P < 0.01. Table 5. HRs for BMI Change in Different Weight Groups
-
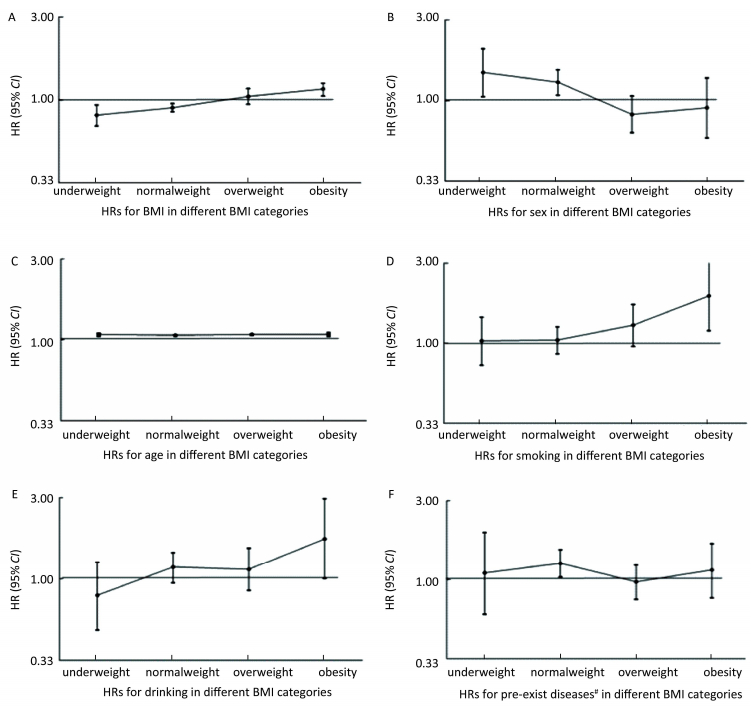
To further study the impact of BMI on factors related to mortality, we used a Cox model in each BMI group to calculate the HRs for factors such as gender, age, smoking, drinking and pre-existing diseases. The results were shown in Figure 3. The HRs for smoking and drinking showed an increasing trend in the four BMI groups, while the HR for the males declined as BMI increased, and the HR for age (1-year increase) seemed to be unchanged in each BMI group.
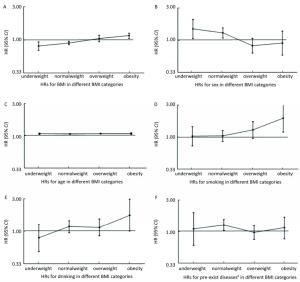
Figure 3. HRs for BMI (A), gender (B), age (C), smoking (D), drinking (E) and pre-exist diseases (F) in different BMI categories. Pre-existing diseases, including hypertension, coronary heart disease, rheumatic heart disease and chronic obstructive pulmonary disease.
Characteristics of the Sample and Mortality of BMI Groups
BMI-mortality Curves
Outcomes of Survival Analyses
Baseline BMI and All-cause Mortality
BMI and BMI Changes to All-cause Mortality
HRs for Other Factors in Overall Population and in Different BMI Groups
-
China has a large population of people with a BMI above 25 kg/m2, and this number is increasing[12]. BMI can be a useful indicator of general adiposity[13-14], and a greater adiposity is harmful to our metabolism[15-16], and China has stepped into an aging society, the aging population is increasing fast, it is important to study the relationship between BMI and mortality in China among aging people, to better understand the underlying relationship.
The data in our study were from the BLSA cohort, which may, to a large extent, represent the aging population in Beijing. The lowest mortality was found for those with a BMI of approximately 25 kg/m2, which is in the overweight range. This result is in line with the results of the Cox model, which shows that the overweight group has the lowest mortality. However, Zhengming Chen's study in 2012 showed that the association between BMI and all-cause mortality was U-shaped, with the lowest mortality for a BMI ranging from 22.5-25 kg/m2[17]. The main reason may be that the population in their study was adults over 19 years of age, while the age of our population is over 55 years old. The difference of BMI range associated with the lowest mortality between our study and Chen's also reveals that age is an important factor influencing the relationship between BMI and all-cause mortality.
Many previous studies have suggested that people with pre-existing diseases have unusually high risks of mortality at low BMIs but relatively low risks at high BMIs[18-23], likely because of disease-induced weight loss[18-20]. However, the reason remains debatable; it could be that those who are underweight were in sub-optimal health and were susceptible to disease. Although the Cox model results showed that the underweight group had a high risk of all-cause mortality even when adjusting for age, gender, smoking status, drinking status and some pre-existing diseases, the Cox model also showed that the HR for pre-existing diseases was not statistically significant. This lack of significance may be because people with pre-existing diseases were more careful about their health and tended to obtain more medical care. Among the underweight group, deaths from external causes may be mainly responsible for the increased risk of death[9], which means that diseases and injuries were more frequent to happen and more likely to cause death in underweight individuals than in individuals in other BMI categories.
As shown in Table 2, the percentage of under weight individuals who died of cardiovascular disease, respiratory disease and natural death was much higher than the mean. This finding may indicate that older people who are underweight are more likely to develop cardiovascular and respiratory diseases than upper weight groups. The HR for the overweight group was 0.76, and for the group with obesity the difference was not statistically significant when compared with the normal weight group. This finding indicates that although an appropriately high BMI may be beneficial, when BMI exceeds a certain beneficial range it can be harmful to health. Although our results for the obese group did not show a significant difference, this may have been because the media BMI for this group is 29.64 kg/m2, which is not truly a high value.
Except for model 1, the HRs in the same BMI group in model 2, model 3, and model 4 were similar to each other. These finding may indicate that the relation between BMI and all-cause mortality is mainly affected by gender and age.
A survey conducted in a European town indicated that the WHO's BMI cut-off point of 25 kg/m2 for overweight might be too low for older age groups[23]. Some suggestions about BMI cut-off points to define overweight and obesity in Chinese and other Asian populations have been proposed[24-28]. These proposals have mostly been based on laboratory studies and cross-sectional surveys[29] rather than on prospective studies. In our study, the lowest mortality was found in the overweight group rather than the normal weight group. This finding may suggest that the cut-off points used to define overweight and obesity for older people in China should be increased to a higher level compared to the accepted Chinese standard for BMI categories.
Previously published papers have also aimed to determine the relationship between BMI and all-cause mortality among the elderly in China. Yao He obtained the BMI measurements twice respectively in 1976 and 1994 and conducted a follow-up to the year 2011, in a cohort of 1696 Chinese in Xi'an China, aiming to explore the BMI and BMI changes before and during China's economic development and the subsequent risk of cardiovascular disease and total mortality[30]. While our study took the BMI measurements in 1992 and 2000, which could be considered to reflect BMI and BMI changes at a further stage of economic development. Additionally, because the relationship between BMI and all-cause mortality is u-shaped or J-shaped, we calculated the HRs of BMI and BMI changes in different BMI categories rather in the overall BMI group. Chen-Yi Wu's study took a BMI measurement at the baseline in 2006 and conducted a follow-up until 2010 of a cohort of 77, 541 Taipei residents over 65 years of age. The results of HR of all-cause mortality for the underweight and overweight groups based on the baseline BMI are consistent with the result of our study, which showed that underweight was related with increased all-cause mortality and overweight is related with reduced all-cause mortality compared with normal weight, while in Chen's study obesity was divided into two groups: grade 1 obesity (30≤BMI < 35 kg/m2), and grade 2-3 obesity (BMI≥35 kg/m2), and heterogeneous effects of grades 1 and 2-3 obesity on mortality were observed, specifically, grade 1 obesity is related with reduced all-cause mortality and grades 2-3 obesity was related with increased all-cause mortality[31]. The results of our study showed that although an obesity status with a median BMI of 29.64 kg/m2did not show a relation with increased all-cause mortality when compared with normal weight, but there was an association when compared with overweight. Additionally, our study took the pre-existing diseases into account and obtained measurements for BMI twice, which enabled us to analyze the effect of BMI changes on all-cause mortality. Furthermore, the BMI classification standards the studies used are differed from each other.
The strengths of our study included the use of data from the BLSA cohort study, which provided a good sample of the elderly in Beijing, the number of participants and the long duration of follow-up with a total of 28151.5 person-years of follow-up, which enabled us to explore the effect of BMI in certain subgroups. The repeated measurement of BMI in 1992 and in 2000 allowed us to examine the relationship between BMI changes and mortality at stage of further economic development. Furthermore, confounding factors such as gender, age, smoking status, drinking status, and pre-existing disease were taken into consideration, but data on regular exercise and dietary habits were not collected.
Our study included only two measurements of BMI. However, changes in BMI over time may be of great significance to health[32]. To better clarify the relationship between BMI and mortality, a long-term follow-up study of younger birth cohorts, with BMI measured across the life course and combined with more detailed body composition measures, is needed[33].
-
The BMI-Mortality curve is U-shaped with the lowest mortality at approximately 25 kg/m2. Although being underweight is associated with increased all-cause mortality, while being overweight is related to reduce all-cause mortality, keeping BMI stable contributes to reduced mortality. The morbidity of different BMI groups and the interaction between BMI and other factors on mortality should be concerned.
-
We thank the staff of the Beijing Geriatric Healthcare Center, Xuanwu Hospital, for conducting the survey and collecting the epidemiological data. We also thank those who did the follow-ups and maintained the database.
-
WANG Yun Feng: Analyzed the data and wrote the paper; GUO Jin, TAO Li Xin: Prepared and maintained the data; LIU Long, LI Hai Bin, LI Di Tian: Contributed to the discussion; TANG Zhe, GUO Xiu Hua: Conceived and designed the study; YANG Xing Hua: Designed the study and revisedthe paper.

 Quick Links
 DownLoad: