


HTML
-
Diabetic nephropathy is a major complication of type 2 diabetes. Characteristics of diabetic nephropathy include: an elevated urinary albumin excretion rate and blood pressure, as well as a decline in renal function[1-4]. In a previous study, more than 95% of renal diseases were observed in people with diabetes[5-6]. However, the prevalence of renal disease in patients with type 2 diabetes mellitus (T2DM) was previously not acknowledged[7]. Recent evidence has suggested that DN is becoming the leading cause of end-stage renal disease (ESRD) in diabetic patients. Furthermore, diabetes plays a major role in the development of cardiovascular events, which can in turn aggravate renal dysfunction[8-10]. Several studies conducted in other countries have identified risk factors and subsequently developed risk equations for predicting DN among people with T2DM[2, 11-13]. However, due to the complex pathogenesis of DN and the variation among people from different countries, the results may not be directly applicable. In China, researchers from Shanghai and Beijing have studied the prevalence and risk factors of chronic kidney disease (CKD) in Chinese people with T2DM[14]. In 2006, the Hong Kong Diabetes Registry developed risk equations for predicting ESRD in clinical settings[15]. However, those studies were limited to the determination of prevalence through examination of end stage renal dysfunction in clinical participants or in those with renal disease at baseline. Therefore, the main objective of the current study was to evaluate both incidence and associated risk factors of DN in people with T2DM. Using this, we aimed to develop a model for risk prediction of DN among patients with T2DM.
-
We used data from the baseline dataset of the project, 'Comprehensive Research on the Prevention and Control of the Diabetes (CRPCD)'. The CRPCD project is a large community-based, ongoing study aimed at exploring an applicable technology for comprehensive intervention in people with T2DM (Details of the project can be found in Tables S1-S2 in Supplementary materials in www.besjournal.com). The primary outcome was the patients' first diagnosis of diabetic nephropathy, after the diagnosis of T2DM. Baseline date referred to the date of diagnosis of T2DM. A clinical diagnosis of DN was made on the basis of persistent albuminuria, diabetic retinopathy, and the absence of any clinical or laboratory evidence of other kidney or urinary tract disease[11]. Information about DN events was obtained, following a comprehensive medical record review, physical examination, or questionnaire survey. Participants were retrospectively followed from baseline until the day of the survey (December 31, 2013) or first occurrence of final events. Patients with missing information, necessary for the diagnosis of DN, or who had already been diagnosed with nephropathy before the baseline assessment were excluded. We also excluded individuals above the age of 80, and those below the age of 30.
In the end, 11, 771 participants were recruited, with 5, 705 participants (including 45 patients with DN) from Huai'an city. These were treated as the training set. A total of 6, 066 participants (including 32 patients with DN) were from Suzhou city and these were treated as the test set. Information from the two groups was used for model development and evaluation respectively.
-
Information on demographics, lifestyle, and disease history was derived from the questionnaires administered. Smoking status during the follow-up period was ascertained through self-reporting. Baseline values of physical examination and laboratory tests were obtained from the medical records of participants or through self-reporting. The actual age was recorded as age of participant at the time of the study, whilst the date of diagnosis of the disease was obtained from the medical records. Smoking status was categorized as 'yes' and 'no' in response to the question 'Have you ever smoked 100 cigarettes in the past?' Physical activity levels by taking the product of the metabolic equivalent (MET) and the amount of time used for each activity. Physical activity was then categorized into low (MET < 31.22) and high (MET > 31.22). Duration of T2DM was defined as the time interval between the date of diagnosis and time of survey. Family history of diseases was recorded on the basis of any of the family members having the disease. Dietary habits were obtained from the questionnaire. Participants with diet control referred to those modifying their dietary habits according to doctors' advice. Antidiabetic treatment included oral hypoglycemic agent or insulin administration. Patients who took their medication as prescribed were classified as demonstrating 'good compliance' while patients who did not take drugs according to the prescription were classified as demonstrating 'poor compliance.' All variables were time varied.
-
After confirming that the assumption of proportionality of hazards was met, we used the Cox proportional hazards regression model to estimate the parameters separately for men and women. Covariates in the baseline model included age at diagnosis, location, culture degree, smoking status, body mass index (BMI), creatinine, high-density lipoprotein (HDL) cholesterol, systolic blood pressure, hypertension, dyslipidemia, cardiovascular disease and retinopathy during follow-up, family history of cardiovascular disease, renal disease, and T2DM, antidiabetic treatment after diagnosis, treatment compliance, physical activity, and diet control. The estimated risks of DN for 5 years, 10 years, and 20 years were calculated for each participant using the test set. Observed risks were assessed by Kaplan-Meier method using a tenth of sex-specific predicted risk.
To address missing values for smoking status, BMI, and creatinine, we carried out multiple imputations based on each conditional density given other variables. Five copies of the original data were generated with sensible values randomly imputed based on their conditional distribution. The final results were obtained by combining the analysis of five data sets using Rubin's rules[16]. To derive the correct linear scale for continuous variable, we used the multiple fractional polynomial method for model development[17].
Model performance was evaluated by discrimination and calibration. Discrimination refers to the ability to distinguish between individuals who do and do not develop an event during the follow up period; it was evaluated by Harrell's C-index[18-19]. Statistics of R2 and Somers' D were also calculated[20-21]. Calibration was assessed by comparing observed risks versus predicted risks based on deciles of the predicted risk. All the statistical analyses were performed using Stata (Version 13.0) and the imputation procedure was carried out by the user-written program ICE in Stata[22].
Study Design and Data Source
Description of Variables
Statistical Analysis
-
Baseline characteristics of the 11, 771 participants are shown in Table 1. Details of the proportion of observations with missing information on risk factors can also be found in this table. More than 90% of the participants had complete data on BMI, HDL-cholesterol, smoking status, and creatinine. The training set and test set contributed 28, 542 and 40, 580 person-years respectively, during the follow-up time. Final events were observed in 45 participants from Huai'an city and 32 participants in Suzhou.
Variables Training Set (N=5, 705) Test Set (N=6, 066) Men, n (%) 2, 319 (40.65) 2, 749 (45.32) Age at diabetes diagnosis, y 55.42±9.82 55.47±9.00 Urban, n (%) 1, 596 (27.98) 3, 329 (54.88) Smoking status Current or ex-smoker, n (%) 1, 546 (27.71) 1, 775 (29.51) Nonsmoker, n (%) 4, 033 (72.29) 4, 239 (70.49) Smoking status not recorded, n (%) 126 (2.21) 52 (0.86) Clinical values BMI recorded, n (%) 5, 700 (99.01) 6, 056 (99.84) BMI (kg/m2) 25.68 (3.47) 24.69 (3.13) HDL recorded, n (%) 5, 685 (99.65) 6, 062 (99.93) HDL (mmol/L) 1.48±0.48 1.50±0.40 Creatinine (mmol/L) 73.26±27.09 72.18±25.95 Systolic blood pressure recorded, n (%) 5, 679 (99.54) 6, 017 (99.19) Systolic blood pressure, mmHg 143.79±20.45 148.42±19.58 Clinical condition Hypertension or dyslipidemia, n (%) 2, 377 (41.67) 3, 074 (50.68) Coronary heart disease, n (%) 305 (5.35) 178 (2.93) Stroke, n (%) 444 (7.78) 237 (3.91) Family history of kidney disease, n (%) 30 (0.53) 30 (0.49) Family history of T2DM, n (%) 1, 156 (20.26) 1, 699 (28.01) Family history of CVDs, n (%) 271 (4.75) 207 (3.41) Diet control or physical activity, n (%) 1, 985 (34.79) 1, 486 (24.50) Antidiabetic treatment, n (%) 4, 022 (70.50) 5, 085 (83.83) Note. Continuous data are presented as means±standard deviation; categorical data are shown as n (%). Table 1. Baseline Characteristics of the Participants in the Training and Test Sets
The crude incidence of DN in all patients was 9.95 cases/10, 000 person-years (95% CI 8.66-11.43) for women and 11.28 cases/10, 000 person-years (95% CI 9.77-13.03) for men. The difference in incidence between the two cohorts was not statistically significant (P=0.087).
-
Table 2 shows the variables remaining in the final risk model after forward stepwise selection. High creatinine level, hypertension, dyslipidemia, and retinopathy were all associated with increased risk of DN. The highest risk of DN occurred in men with high serum creatinine levels. Interestingly, both BMI and diet control/physical activity were significant predictors in men but not in women.
Variables Hazard Ratio (95% CI) Women Men Agea 0.85 (0.76-0.92) 0.89 (0.79-0.99) BMIb n/af 0.91 (0.79-0.97) Creatininec 4.11 (2.78-6.07) 11.27 (7.67-16.56) HDL cholesterolb 0.27 (0.15-0.46) 0.28 (0.17-0.47) Locationd 0.35 (0.24-0.53) 1.78 (1.18-2.69) Hypertension or dyslipidemiae 1.52 (1.02-2.28) 1.99 (1.25-2.73) Retinopathye 5.80 (3.89-8.94) 4.00 (2.74-5.86) Diet control or physical activitye n/af 1.85 (1.25-2.73) Note. Fractional polynomial terms are defined as following: aAge/5 for both men and women; bVariables were centered in model; cln 'creatinine' for women, ln 'creatinine/100' for men. dPeople in rural areas compared with those in urban areas. eCompared with people without the condition during follow-up. fHazard ratio without statistical significance (P > 0.05). Table 2. Estimated Hazard Ratios for Risk Factors in the Final Model
-
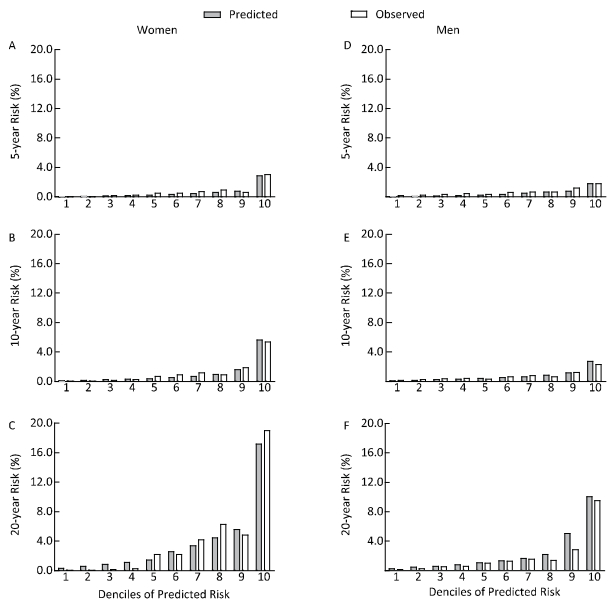
Using the model fashioned from the training set, the prediction in Table 3 shows the model's performance with different indicators. In men, the index values were larger. Figure 1 shows the calibration plots of our risk model. The graph shows good agreement between the observed risks and predicted risks at both 10-years and 20-years follow-up. However, a small degree of under-prediction of the estimated risk was observed at 5-years follow-up. The top quartiles of predicted risk identified 86.36% of women and 86.96% of men who developed DN over 10-years follow-up (sensitivity). The proportion of participants without DN who were not in the top quartile of the predicted risk was up to 80.41% for women and 80.67% for men (specificity).
Model R2 (95% CI) DaStatistic (95% CI) C-index (95% CI) Chi-square P Value Women Training set 75.48 (68.61-82.61) 0.82 (0.68-0.96) 0.84 (0.80-0.88) 10.45 0.11 Test set 75.00 (60.43-78.45) 0.79 (0.69-0.89) 0.79 (0.74-0.84) 11.20 0.08 Men Training set 83.10 (79.56-90.61) 0.81 (0.70-0.91) 0.80 (0.74-0.86) 14.25 0.08 Test set 86.47 (80.77-95.05) 0.89 (0.83-0.96) 0.85 (0.81-0.90) 14.56 0.07 Note. aSomers' D statistic. Table 3. Model Performance with Different Indexes for Men and Women

Figure 1. Calibration Plots for the Risk model using the Test Set. (A) 5-year risk for women; (B) 10-year risk for women; (C) 20-year risk for women; (D) 5-year risk for men; (E) 10-year risk for men; (F) 20-year risk for men.
Baseline Characteristics and Incidence of DN
Risk Factors for DN
Model Performance
-
On the basis of a large-scale community-based study, we developed a risk model for predicting the risk of developing DN in people with T2DM in China. In both discrimination and calibration, the model performed well with independent validation. Under these circumstances, the implementation of our model may lead to better management of high-risk patients with diabetes.
In agreement with many previous studies, participants with a high creatinine level, retinopathy, hypertension, and dyslipidemia showed a higher incidence of DN[13, 23-24]. The BMI, which may increase the risk of cardiovascular disease, is not frequently considered in risk models of renal disease. In our study, the association between BMI and incidence of DN was significant only in men, which may explain the complex pathophysiology behind DN. In addition, this may also be caused by data issues.
Interestingly, women from urban areas were at higher risks than women from rural areas. However, the result was the opposite in men. This may be attributed to the actual situation in China. With the implementation of the CRPCD project, the community health centers or township hospitals were tasked with responsibility of carrying out health interventions. Compared with women from urban areas, women from rural areas are easily managed by doctors in the villages. In addition, an increasing number of men from rural areas have left home and worked in urban areas, which has increased the difficulty of management. Although the basis of these paradoxical results is not clear, the discordance between their respective risk factor profiles may hint towards adopting different parameters for urban and rural people.
In our study, we did not find a significant association between smoking and incidence of DN. Thus, the effect of smoking on the development of DN remains controversial. In addition, the Reduction of Endpoints in Non-insulin-dependent diabetes mellitus with Angiotensin Ⅱ Antagonist Losartan (RENAAL) study reported that smoking at baseline was not a risk factor for renal outcome[25]. Another previous study found that heavy smokers had an increased risk of ESRD[26]. As the smoking status information in our study was collected through self-reporting, for some participants, the number of cigarettes was not quantified, whilst for others, they may have stopped smoking during the follow-up period. Furthermore, it is possible that smokers may die prior to reaching the renal endpoints, and this was not taken into consideration[25].
Results from previous studies have demonstrated that antihypertensive treatment can reduce the incidence of DN and slow its progression to ESRD[27-29]. The effect of antihypertensive treatment was not evaluated owing to unavailable information on those therapies. It would therefore have difficulties to differentiate between which drugs participants were receiving during follow-up, and which drugs would be in use for future treatment. However, antihypertensive treatments would need to be considered in further studies.
-
The strengths of our study include the large community-based sample, which provided a realistic population to assess disease risk. The final risk model was validated using another data set and obtained strong discrimination and calibration. Currently, there are no widely accepted renal risk models for patients with T2DM, and the predictors used in many reported models are variable and often not available in such large-scale studies. Our model's easily obtainable values increase its potential feasibility.
However, the present study has several limitations. Firstly, the retrospective setting may increase the level of bias compared with prospective studies. Secondly, some clinical variables were unavailable and some information was self-reported. Additionally, the endpoint of this study was defined to represent the status or quality of patients' health alone, which Is too simple. Therefore, an endpoint that can comprehensively evaluate the progression, intervention, and prognosis remains to be discussed further. In addition, as the UKPDS 68 study reported, diabetes-related complications including congestive heart failure, ischemic heart disease, myocardial infarction, stroke, amputation, renal failure and eye disease were interrelated and have similar risk factors[13], the objective of this study may be extended to explore the risks of other diabetes-related complications simultaneously.
Strengths and Limitations
-
We have developed and validated a risk model for predicting the risk of DN among people with T2DM. With its potential to identify high-risk people, this model may be used by associated institutions to provide a basis for better public health policy and clinical practice guidelines in patients with DN. However, further studies are still needed to verify these findings, and we hope that this study may shed light on any further research focusing on diabetic nephropathy.
-
This research used data from the survey organized by Jiangsu Provincial Center for Disease Control and Prevention. We also thank the following organizations for their data collection expertise: Changshu City Center of Disease Control and Prevention, Huai'an District Center of Disease Control and Prevention in Huai'an city, Qing-he District Center of Disease Control and Prevention in Huai'an city.
-
PAN En Chun and WU Ming designed the study and take responsibility for all the entire process. ZHANG Qin, QIN Yu, WU Ming, and PAN En Chun performed the interviews for data and sample collections; MIAO Dan Dan, SUN Zhong Ming, and ZHANG Qin analyzed the data. MIAO Dan Dan and PAN En Chun drafted the paper. All authors have read and approved the final paper.
-
The study 'Comprehensive Research on the Prevention and Control of the Diabetes' (CRPCD) used stratified cluster sampling method in the 65 townships of three areas, in which 39, 564 T2D people had registered and received management of the 2012 National Basic Public Health Service (Changshu, Suzhou City & Huaiyin and Chuzhou, Huai'an City, Jiangsu Province, China). Townships that conducted other health care programs were excluded. Totally 29, 705 registered T2D patients in 44 townships were selected and 23, 240 individuals were recruited. Finally 20, 340 subjects undertook the questionnaire survey and physical examination (detailed consents were displayed in Table S1). All the examinations were performed within two months (from Dec, 2013 to Jan, 2014). Laboratory tests were done among 20, 053 participants respectively. The study protocol was approved by the Ethic Board of Jiangsu Provincial Center for Disease Control and Prevention (No. 2013026). All patients were well informed and signed a written consent before participating in this study.
Baseline Survey Physical Examination Laboratory Test Demography Height HbA1c, fasting plasma glucose Lifestyle Weight Fasting lipid profile: total cholesterol, TG, HDL-C and LDL-C Tobacco and alcohol history Waist and hip circumstance Disease history Blood pressure Serum creatinine Medications and adherence Heart rate ALT and AST Family history GOT, BUN and UA Note.ALT, Alanine Transaminase; AST, Aspartate Transaminase; BUN, Blood Urea Nitrogen; GOT, Glutamic Oxaloacetic Transaminase; HbA1c, glycated hemoglobin; HDL-C, High-Density Lipoprotein Cholesterol; LDL-C, Low-Density Lipoprotein Cholesterol; TG, Triglyceride; UA, Uric Acid. Table Table S1. Details of Baseline Survey, Physical Examination and Laboratory Test
Criteria/Variable Definition T2DM FPG≥7.0 mmol/L or previous diagnosis in medical record or having a self-reported T2DM history (ICD-9, code 250.x). Non-fatal CVDs Determined according to patients' medical records or self-report that judged by staffs. it referred to a history of coronary heart disease or stroke CHD A history of hospitalization for myocardial infarction or a surgical history of coronary balloon angioplasty, or coronary stent implantation or coronary artery bypasses (ICD-9, codes 410-414). Stroke A history of language or physical dysfunction continuing for more than 24 h and ischemic or hemorrhagic stroke diagnosed using imaging examination (ICD-9, codes 430-438). Hypertension Average blood pressure between the two measurements≥140/90 mmHg, or a previous diagnosis of hypertension. (ICD-9, codes 401-405) Dyslipidemia TG≥1.7 mmol/L or LDL-C≥3.2 mmol/L or HDL-C < 0.9 mmol/L in males, or HDL-C < 1.0 mmol/L in females Note. CHD, Coronary Heart Disease; CVD, Cardiovascular Disease; FPG, Fasting Plasma Glucose; HDL-C, High-Density Lipoprotein Cholesterol; LDL-C, Low-Density Lipoprotein Cholesterol; ICD-9, International Classification of Disease, 9th Revision; TG, Triglyceride; T2DM, Type 2 Diabetes Mellitus. Table Table S2. Definition of Diagnosis of Disease
Description of the CRPCD project
grants from Jiangsu Provincial Medical Innovation Team Program K201105
Jiangsu Provincial Fourth '333 Project' BRA2013107

 Quick Links
 DownLoad: