


HTML
-
The tendency to be overweight and obesity is increasing rapidly in China and represents one of today's most important public health issues[1]. According to the 2010 National Behavior Risk Factor Surveillance, 30.6% Chinese adults were estimated to be overweight and another 12% were considered obese[2]. Obesity is a chronic disease that involves multiple causes including social, behavioral, environmental, and genetic factors. The past decades have seen a rapid change in lifestyle in the Chinese population. The traditional dietary pattern, which is rich in rice, pork, and vegetables, is generally decreasing and a modern dietary pattern, which includes a high intake of fruit, fast food, and processed meat, is increasing. Studies have demonstrated that the traditional dietary pattern is beneficial in preventing obesity in the Chinese population[3]. Adding to the issue of obesity is the fact that physical inactivity is dominant in Chinese adults, and levels of physical fitness have deteriorated overtime[4]. In the past few years, a growing body of evidence has shown that sleep duration may be a novel risk factor for subsequent weight gain and obesity[5-10]. While the mechanism of sleep duration and obesity has not yet to be clarified, sleep duration is hypothesized to cause obesity by affecting the energy balance equation of both energy intake and expenditure. Sleep disorders may link to obesity by altering levels of metabolic hormone that regulate appetite and affect food selection[5, 11-12]. Short sleep durations may also cause feelings of fatigue and hamper physical activity[12].
Several anthropometric measures to define obesity have been proposed, and body mass index (BMI) is the most widely used of these measures. Several researchers, however, argue that using BMI as a surrogate of body fatness may be insufficient to detect body adiposity[13]. A meta-analysis study, for example, reported that half of the people found to be with excessive percent body fat (%BF) could not be identified as obese by the commonly used BMI cutoff values[14]. Previous studies examining the relationship between sleep duration and obesity mostly used BMI or weight gain as outcomes, and few studies have measured abdominal obesity or body fat[7, 15-16]. Moreover, only a limited number of studies have controlled the dominant confounders of dietary intake and physical activity to investigate the role of sleep duration on the obesity[6, 8].
Previous studies mostly analyzed the association between sleep duration and body weight measure within the framework of ordinary least-squares (OLS)[7-8, 16]. In these works, estimates of OLS regression were averaged over the conditional distribution. This method may mask the correlation in the sense that the tails and center location of the conditional distributions vary differently. To solve this, the quantile regression (QR) method was developed to investigate heterogeneous associations on the conditional distribution. This method was subsequently introduced to BMI-related studies but was sparsely adopted in sleep and obesity studies[17-19]. Research has revealed the heterogeneous link of sleep and BMI by gender on account of body composition and relevant lifestyle factors. Longer sleep durations have been reported to be associated with obesity in women but not in men, while short sleep durations have been associated with higher BMI in men but not in women[20].
We assumed that sleep duration is associated with obesity in Chinese adults and that this association may be more significant in women than men. The OLS and QR methods were applied to investigate the relationship between sleep duration and obesity as reflected by BMI, waist circumference, and %BF in a general Chinese population. This relationship was examined by gender and adjusted for multiple confounding variables including dietary intake and physical activity.
-
A multistage cluster sampling method was used to select the study population in Beijing (north of China) and Zhejiang Province (south of China) from April to July in 2010. First, we randomly selected 1 urban and 1 rural area in Beijing (districts of Haidian and Shunyi, respectively) and Zhejiang (Jiaxing City and Tongxiang County, respectively). Then, 2 local streets/towns in each selected area were randomly selected. One community/village in each street/town was further randomly selected. Study sample candidates were selected from local residents aged between 35 and 60 years. A total of 8, 000 local residents were invited to participate in our survey, and a final total of 7, 177 residents attended (response rate, 89.7%). The participants completed a face-to-face questionnaire, anthropometric measurements, and fasting blood collection. Among respondents, 51 did not attend the body fat measurement, 6 did not participate in weight measurement, and 26 did not undergo blood sampling; thus, only 7, 094 respondents participated in this study.
-
The selected participants were invited to attend a standard questionnaire survey administered by trained staff and were overseen by the study investigators. Information regarding age, gender, marital status, occupation, educational attainment, smoking, and alcohol consumptions was collected. Participants who had accumulatively smoked at least 100 cigarettes were classified as smokers, and alcohol drinkers were defined as participants drinking any kind of alcoholic liquid at least once a week in the past 1 year.
-
Sleep duration was determined in terms of self-reported habitual sleep times during a whole day in a regular week, including daytime siest as and night time sleep. Sleep duration was categorized into five groups (< 6, 6-7, 7-8, 8-9, and ≥ 9 h), stratified by gender. Participants with sleep times of < 6 h/d were classified as short sleepers, while those who slept ≥ 9 h were classified as long sleepers[16].
-
A simplified questionnaire with select food categories was used to collect information on food consumption during the past year[21]. Food items used in this analysis included staple food (rice, wheat flour) and potatoes, fresh vegetables, and fruits. Three steps were used to collect dietary intake information. First, participants were asked to recall whether they had eaten the listed food category in the past 1 year. If a participant answered yes, he/she was asked how often this food was eaten; otherwise, participants moved to the next food category. In the last step, participants were asked to recall the average amount of food they ate at each meal. Food models were displayed at the interview center to help the participant quantify the food amount reported. The amount of food intake for each item was estimated by multiplying the number of meals consumed each day and the amount of food consumed each time.
-
The adapted Global Physical Activity Questionnaire (GPAQ) was used to collect the sedentary activity and physical activity, details of the adapted GPAQ was described elsewhere[22]. The participant was asked to recall his/her occupational, leisure time, transportation, and domestic related physical activities in a typical week. He/She would be asked to recall how many days in a week he/she would be involved in the listed physical activity, then would recall how many hours and minutes each day on average he/she would be occupied. The total time spent on television watching, reading, computer game playing and computer using in the leisure time was used as sedentary activity. The metabolic equivalents (METs) of the physical activity were assigned according to the Compendium of Physical Activities and GPAQ, the activity volume (MET-min/week) for each physical domain was calculated: activity volume = minutes performed × METs value × days[23-24]. We classified physical activity volume into 4 groups by quartiles.
-
Height, weight, and waist circumference were measured by trained workers using standardized methods. BMI was calculated by weight divided by the square of the height (kg/m2). Participants were categorized as underweight (BMI < 18.5), normal (BMI 18.5-23.9), overweight (BMI 24.0-27.9) and obese (BMI ≥ 28) according to Chinese guidelines[25]. Abdominal obesity defined as a waist circumference ≥ 85 cm in males and ≥ 80 cm in females[25].
Body fat was measured through bioelectrical impedance analysis (BIA, Omron v-body HBF-350, Japan) using measurements of lower extremity impedance. %BF was determined by an equation combining height, weight, age, and gender, which were entered into the BIA system prior to the assessment. Participants with high %BF were defined as men with %BF > 25% and women with %BF > 35%[26].
-
Venous blood was drawn from each participant in the morning and centrifuged within 2 h after collection. Participants with a fasting blood glucose ≥ 6.1 mmol/L were invited to return for an oral glucose tolerance test (OGTT) on another day to determine their 2 h postload blood glucose (2hPBG). Total cholesterol was also assessed.
-
Health status, such as the presence of hypertension, diabetes, or hypercholesterolemia was assessed. Blood pressure was measured with participants in a sitting position three times every 5 min on one occasion using an electronic sphygmomanometer (HEM-7071, Omron Corporation, Japan); the average of the three measures was defined as an individual's blood pressure. Hypertension was defined as a systolic blood pressure (SBP) ≥ 140 mmHg, diastolic blood pressure (DBP) ≥ 90 mmHg, or self-reported taking of anti-hypertensive medications[27].
Diabetes was diagnosed according to the criteria of the American Diabetes Association (2003)[28]. Participants were defined as having type 2 diabetes if they had a fasting serum glucose ≥ 7.0 mmol/L, 2hPBG ≥ 11.1 mmol/L, or validated history of diabetes as diagnosed by a physician. Hyperlipidemia was defined as elevated serum concentrations of total cholesterol (TC) ≥ 6.1 mmol/L as described by the American National Cholesterol Education Program (Adult Treatment Panel III)[29].
-
Demographic and clinical characteristics are presented as means (SD) or percentages. Chi-square tests were used to compare categorical variables among the five sleep duration groups in different genders. Comparison of continuous variables was made by analyzes of variance among groups, and Dunnett's test was used for multiple comparisons. Nonparametric tests were performed for skewed distributed variables. Two stages of regression analysis were involved. We first used OLS regression to examine whether self-reported sleep durations were associated with the prevalence of obese as classified by BMI, WC, and %BF in different genders. We then calculated odds ratios (OR) and 95% confidence intervals (95% CI) to estimate the risk of obese prevalence associated with different predictors of interest. In the second stage of our analysis, quantile regression was used to explore the association of sleep duration with the 5th, 10th, 25th, 50th, 75th, 90th, and 95th percentiles of BMI, WC, and %BF in different genders. During the OLS and QR analysis, 2 sets of covariate-controlling models were applied and potential confounders were progressively adjusted. In Model 1, we adjusted for age; in Model 2, we adjusted for age, education, occupation, marital status, smoking, alcohol consumption, sedentary behavior, hypertension, diabetes, dietary intake, and physical activity. Since the BMI is correlated with WC and %BF, we also adjusted BMIs during regression analysis of sleep duration with WC and %BF. Because we found significant interactions of gender for the association between sleep duration and BMI (P = 0.007 for the 50th percentile of BMI and P = 0.02 for the 75th percentile of BMI), we performed all of the regression analyzes by gender.
All analysis were performed using the Statistical Analysis System (SAS) statistical software package version 9.2 for Windows (SAS Institute, Cary, NC, USA). All tests were two-sided, and the significance level was set to 0.05.
-
The average age of the participants was 47.3 y (SD = 6.7); 36% of the participants had hypertension and 7.2% had diabetes. The mean BMI of this population was 24.9 kg/m2 and 18.8% were generally obese. Over half (56.4%) of the participants were abdominally obese and 32.5% had high %BF. The average sleep duration reported was 7.3 h (SD = 1.3) for men and 7.5h (SD = 1.3) for women; men tended to show less sleep times than women (P < 0.001). Among men, 18.27% were obese, 58.9% were abdominally obese, and 40.21% had a high %BF. Among women, 19.21% were obese, 54.55% were abdominally obese, and 26.56% had a high %BF.
Table 1 shows the clinical characteristics of participants with different intervals of sleep duration by gender. Short sleepers and longer sleepers tended to be older than normal sleepers (P < 0.001). Among women, the prevalence of obesity, abdominal obesity, and high %BF was higher in long sleepers than in short and normal sleepers (P all < 0.01). Among men, the prevalence of abdominal obesity differed across sleep duration groups (P = 0.005).

Table 1. Descriptive Characteristics of Participants by Sex and Sleep Duration (n=7,094)a
The results of logistic regression analysis of the relationship between sleep duration and obesity, abdominal obesity, and high %BF in men and women are summarized in Table 2. The association between sleep duration and obesity was attenuated by adjusting for additional confounding factors. In women, longer sleepers (≥ 9 h) demonstrated a higher prevalence of obesity (OR = 1.30, 95% CI: 1.02-1.67) and higher %BF (OR = 1.43, 95% CI: 1.04-1.96) with all covariates adjusted but shorter sleepers (< 6 h) did not. In men, subjects who slept 8-9 and ≥ 9 h daily presented a reduced frequency of abdominal obesity, with ORs of 0.71 (95% CI: 0.53-0.95) and 0.79 (95% CI: 0.44-0.99) respectively.
Model Men Women Obeseb Abdominal
ObesebHigh %BFb Obeseb Abdominal
ObesebHigh %BFb Model 1c < 6 h 0.90 (0.61, 1.33) 0.76 (0.56, 1.03) 0.99 (0.72, 1.35) 0.93 (0.65, 1.34) 0.95 (0.71, 1.26) 0.92 (0.66, 1.27) 6-7 h 0.99 (0.76, 1.30) 1.01 (0.81, 1.26) 1.02 (0.82, 1.27) 1.06 (0.81, 1.39) 1.15 (0.93, 1.42) 1.09 (0.86, 1.40) 7-8 h ref ref ref ref ref ref 8-9 h 0.91 (0.72, 1.15) 0.74 (0.62, 0.89)* 0.93 (0.77, 1.12) 1.00 (0.82, 1.24) 1.09 (0.93, 1.28) 1.01 (0.83, 1.22) ≥ 9 h 1.06 (0.77, 1.44) 0.81 (0.63, 1.04) 1.16 (0.90, 1.49) 1.47 (1.16, 1.87)* 1.44 (1.18, 1.76)* 1.76 (1.41, 2.19)* Model 2c < 6 h 0.93 (0.61, 1.40) 0.73 (0.45, 1.20) 1.09 (0.74, 1.61) 0.96 (0.66, 1.40) 1.13 (0.74, 1.72) 0.92 (0.58, 1.47) 6-7 h 0.98 (0.74, 1.31) 0.95 (0.67, 1.35) 1.05 (0.76, 1.33) 1.06 (0.80, 1.40) 0.93 (0.68, 1.27) 1.00 (0.71, 1.42) 7-8 h Ref Ref Ref Ref Ref Ref 8-9 h 0.98 (0.77, 1.25) 0.71 (0.53, 0.95)* 1.02 (0.80, 1.29) 0.97 (0.78, 1.20) 0.95 (0.76, 1.21) 0.88 (0.67, 1.16) ≥ 9 h 1.04 (0.75, 1.45) 0.79 (0.44, 0.99)* 1.18 (0.86, 1.63) 1.30 (1.02, 1.67)* 0.99 (0.73, 1.34) 1.43 (1.04, 1.96)* Note.a, Logistic regression was used to estimate the odds ratio between groups of sleep duration and obesity prevalence. Obesity was defined as a BMI ≥ 28 kg/m2or waist circumference ≥ 85 cm in men and ≥ 80 cm in women. High %BF was defined as %BF > 25% for men and > 35% for women. b, Obesity was defined as BMI ≥ 28 kg/m2or waist circumference ≥ 85 cm in men and ≥ 80 cm in women. High %BF was defined as %BF > 25% for men and > 35% for women. c, Model 1 was adjusted for age, and Model 2 was adjusted for age, education, occupation, marital status, smoking, alcohol consumption, sedentary behavior, hypertension, diabetes, dietary intake, and physical activity. BMI was adjusted in the abdominal obesity and high %BF regression model. *, P< 0.05. Table 2. Odds Ratios among Groups of Sleep Duration and Obesity Classified by BMI, Waist Circumference, and Percent Body Fat from Ordinary Least-Squares (OLS) Regressiona
QR regression indicated that, in men, the negative association of sleep duration and WC could be observed in the median percentile of the WC distribution (Table 3). No striking association was found between any number of sleep hours and BMI and %BF in men.

Table 3. Association of Sleep Duration with percentiles of BMI, Waist Circumference, and Percent Body Fat Estimatde by Quantile Regression in Mena
Women who slept ≥ 9 h showed BMI values higher by about 0.54-0.59 kg/m2 in the 10th to 75th percentile of the BMI distribution compared with those who slept 7-8 h (Table 4). An association between long sleep hours and increased %BF was found only in the 50th percentile of the %BF distribution. However, the association of long sleep hours with WC disappeared after BMI and other cofounders adjusted.

Table 4. Association of Sleep Duration with Percentiles of BMI, Waist Circumference, and Percent Body Fat Estimatde by Quantile Regression in Womena
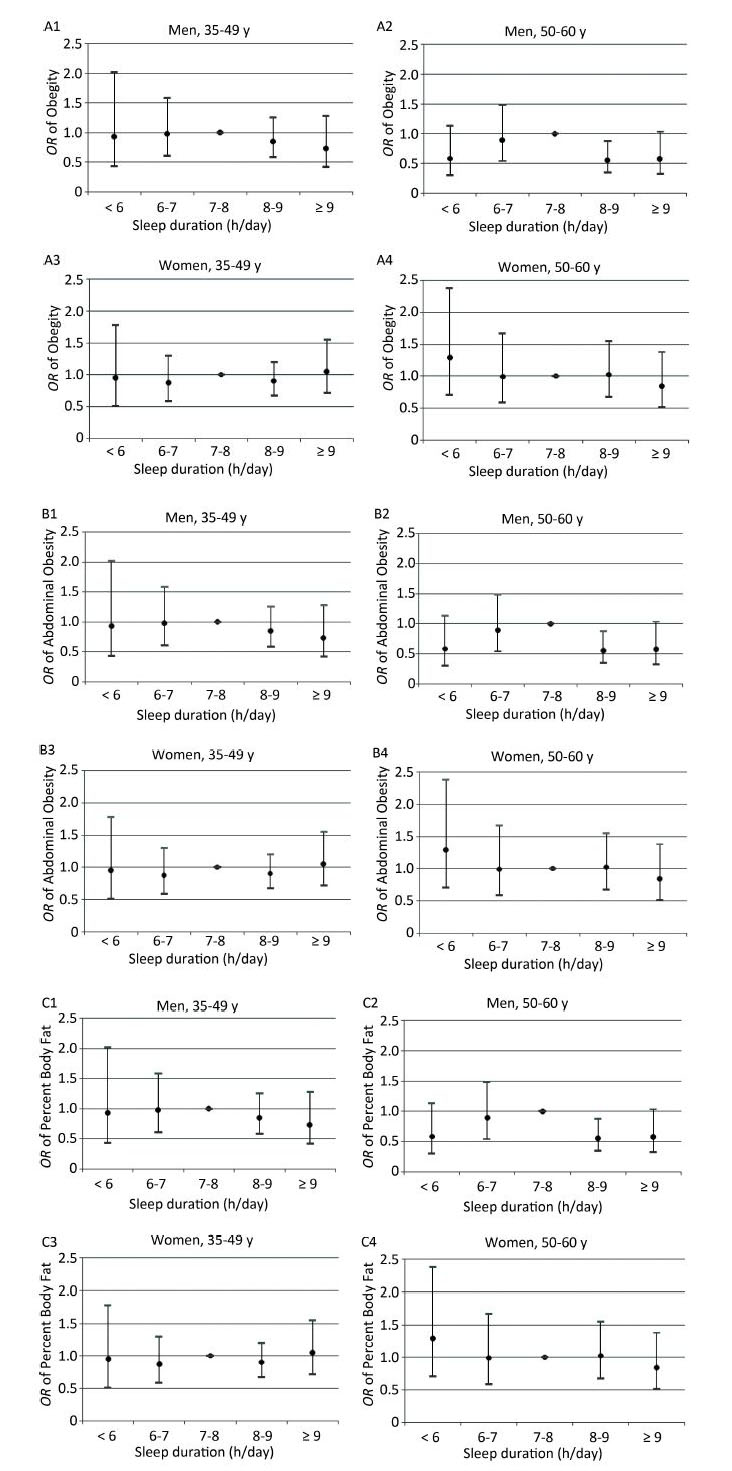
The association between sleep duration and obesity by gender was determined by age group, and we observed fairly similar association patterns between younger and older participants (Figure 1).
Figure 1. Adjusted odds ratio (OR) of obesity, abdominal obesity, and percent body fat (%BF) by age and sex from ordinary least-squaresreg ression. (A) OR of obesity by age and sex. (B) OR of abdominal obesity by age and sex. (C) OR of %BF by age and sex. Obesity was defined as BMI ≥ 28 kg/m2, abdominal obesity was defined as waist circumference ≥ 85 cm in men and ≥ 80 cm in women, and high %BF was defined as % BF > 25% for men and > 35% for women. The adjusted variables include age, education, occupation, marital status, smoking, alcohol consumption, sedentary behavior, hypertension, diabetes, dietary intake, and physical activity. BMI was adjusted in the abdominal obesity and high %BF regression model.
-
Our cross-sectional study provided epidemiological evidence that long sleepers have significantly higher BMIs than short sleepers among Chinese women, in agreement with the previous literature[8, 18-19]. A Swedish study of 40, 197 adults showed that female participants with longer sleep durations displayed linear higher BMI values than those with shorter sleep durations across the BMI distribution[18]. A Taiwanese study observed an inverse U-shaped relationship at the 30th percentile in women but not in other BMI distributions[19]. In our study, women with longer sleep showed higher BMI values across the central location (10th-75th percentile) of the BMI distribution than in the tails (bottom 5th and beyond the 90th percentiles) of the distribution.
The potential mechanism responsible for the relationship between longer sleep durations and higher BMIs lacks clear evidence. A plausible explanation is that long sleepers, compared to, reported higher daily caloric intakes and fat consumption than short- and normal-duration sleepers[30]. Long sleepers spend more time in bed and tend to be less physically active; thus, long sleepers have lower energy expenditures, which could promote increases in body weight. The relationship between sleep duration and BMI remained significant after controlling for physical activity and caloric intake, as demonstrated in some previous studies as well as in the present one[7, 31]. Emotional stress, depression, and low socioeconomic status may also explain the relationship between long sleep duration and obesity[31].
The published literature supports the belief that either habitual short or long sleep durations are a risk factor for central obesity[8, 16, 34]. However, we found in the present study that long sleep is a factor protecting against abdominal obesity in men. A possible explanation for this finding is that the men in this study who slept over 8 h reported less alcohol consumption and, therefore, may be considered to have less energy intake from alcohol. Energy consumed as alcohol adds to that from the other dietary sources and will ultimately promote the energy balance and weight gain[35]. While drinking status was adjusted in our analysis, the frequency and quantity of alcohol consumption were not. The effects of alcohol consumption on sleep duration and obesity require further investigation.
Previous studies have shown related associations between short sleep duration and obesity in adults[36]. In cross-sectional studies, obese subjects were shown to have shorter sleep durations than their non-obese counterparts[34, 37]. In a 10-year follow up of non-pregnant Swedish women, those who self-reported short sleep durations had 30% higher risk of becoming subsequently obese compared with habitual normal sleepers[8]. Yet, in a longitudinal population-based study where sleep was objectively measured, short sleep durations were not associated with a significantly increased risk of obesity incidence[9]. Adjustment of confounding variables and the method of sleep duration measurement should be considered when interpreting the results. In this study, we did not observe associations between self-reported short sleep durations and any of the obesity indicators among men nor women across the entire distribution of BMI, WC, and %BF. Further studies are warranted to examine the association between short sleep durations and obesity in Chinese adults.
Our findings reveal that long sleep durations are associated with general obesity in women but not in men. Gender differences in the relationship between sleep duration and obesity have been reported[37-38]. Women have been suggested to be more vulnerable to the impacts of reduced sleep on weight gain than men because of differences in metabolic hormones and socioeconomic status[39]. In a 15-year follow up study, sleep duration was shown to be a significant negative predictor for BMI in women but not in men[38]. A population study in US adults also showed a U-shaped relationship between sleep duration and BMI in women but a negative linear relationship in men. A recent study found that long sleep durations are related to obesity in Chinese women[37]. We are currently unaware of the biological mechanisms that could explain sex-specific associations between sleep pattern and obesity as these mechanisms are sparsely reported. A plausible explanation is that longer sleep durations may contribute to less emotional stress, and stress may have higher contributions to weight in women than men. Yang, in an interaction study of stress, sleep duration, and sleep quality on the distribution of BMI, found that sleep quality is a much more important factor for weight gain among women than men[17].
What are the public health implications that could be drawn from our findings in recent China? The associations we observed suggest that longer sleep durations may be a novel risk factor for obesity in women. Based on the QR results, obesity intervention policies targeting sleep could be better designed and implemented in populations with median BMI, not in the groups of underweight or extremely obese adults.
-
The strengths of this study include the use of multiple anthropometric measurements of obesity reflecting general and abdominal fat. Accounting for potential confounding factors related to dietary patterns and physical activity is another strength. Our study examines, for the first time, associations across the entire distribution of BMI, WC, and %BF in mainland Chinese residents through sleep-body weight research. Despite these strengths, however, some limitations must also be noted. First, the cross-sectional design precludes causal relationships between sleep duration and obesity. Second, sleep duration was self-reported and may not be as accurate as when objectively measured[40]. Because only the whole-day sleep time was collected and used to define the sleep duration, this information may be unable to clarify the impact of daytime siestas and nighttime sleep on obesity. Finally, we measured only the quantity of sleep, not its quality; therefore, we are unable to control the impact of sleep quality on the relationship between sleep duration and obesity.
-
Long sleep durations were associated with a moderate increase in general obesity in Chinese women. Moderate sleep durations may be necessary to maintain healthy body weights. Prospective studies are warranted to demonstrate whether adults with longer sleep durations are more likely to be obese or gain weight later in life than those with shorter sleep durations.
This project was supported by China's Ministry of Science and Technology 2008BA I56B04

 Quick Links
 DownLoad: