


HTML
-
Subarachnoid hemorrhage (SAH), which is due to the rupture of an intracranial aneurysm, occurs with a frequency of between six and eight cases per 100, 000 people in most western populations[1]. Aneurysmal subarachnoid hemorrhage (aSAH) is a devastating illness that causes high disability and mortality rates[2]. It accounts for approximately 75% of SAH cases. Although better treatment methods have been used recently, the long-term mortality of aSAH patients still reaches 10%-24%[3-4]. It is crucial for us to find novel and accurate predictors of aSAH prognosis.
Gamma-glutamyl transferase (GGT), which is a plasma membrane enzyme and is involved in glutathione metabolism, has been shown to be involved in oxidative events associated with atheroma plaque formation[5-6]. Several studies have shown that a higher level of GGT is a risk factor for cardiovascular and cerebrovascular disease incidence regardless of alcohol consumption[7-9]. In addition, GGT is considered to be a predictive biomarker for stroke and acute coronary syndrome prognosis[10-11]. However, there have been no studies that have specifically evaluated the relationship between GGT and aSAH prognosis. It is unclear whether elevated GGT levels could increase the risk of poor prognosis in aSAH patients. Our objective is to explore this potential association in a Chinese population.
-
From September 2007 to February 2015, 558 patients with aneurysmal SAH, confirmed by computerized tomography (CT) angiography with or without digital subtraction angiography, who were admitted to the affiliated hospital of Nantong University, were evaluated in this study. Patients were excluded from the study if they had any one of the following criteria: (1) age < 18 years; (2) admission time of more than 72 h since onset of symptoms; (3) without available GGT data upon admission; (4) without a 6-month follow-up after aSAH episode; (5) have hepatobiliary and non-alcoholic fatty liver diseases; and (6) not eligible for either surgical clipping or endovascular coiling. Based on these exclusion criteria, a total of 386 aSAH patients were retrospectively included in this study. This study was approved by the ethical committee of the affiliated hospital of Nantong University.
-
Baseline data were collected at admission via interviews with the patients or their family members. Data on demographic characteristics, life-style risk factors and medical history were documented. Alcohol consumption was defined as consuming any type of alcoholic beverage at least once per week during the last year. The Hunt-Hess grade, Fisher scale and Glasgow Coma Score (GCS) were used to evaluate severity upon admission[12]. According to a common protocol that was adapted from procedures recommended by the American Heart Association, three baseline blood pressure measurements were obtained with a standard mercury sphygmomanometer while the study participants were in the supine position. The diameter and location of aneurysms were recorded by 3-dimensional CT angiography. We analyzed the CT images for the presence of delayed cerebral ischemia and recorded the time that any delayed cerebral ischemia occurred after the aneurysm treatment. All patients underwent daily serial neurological evaluations to detect any delayed cerebral ischemia. Delayed cerebral ischemia was defined as the occurrence of focal neurological impairment (such as hemiparesis, aphasia, apraxia, hemianopia, or neglect), or a decrease of at least 2 points on the Glasgow Coma Scale [either on the total score or on one of its individual components (eye, motor on either side, verbal)]. This should last for at least 1 h, is not apparent immediately after aneurysm occlusion, and cannot be attributed to other causes by means of clinical assessment, CT or MRI scanning of the brain, and appropriate laboratory studies[13] .
Blood specimens were collected from all subjects within 24 h of hospital admission (with subjects fasting for at least 8 h). The glucose oxidase-peroxidase method was used to determine plasma glucose levels[14]. The serum GGT levels were measured by an enzymatic colorimetric method (Roche Modular P; Roche Diagnostics, Mannheim, Germany)[15], and total bilirubin (tbil) was determined by the 2, 5-dichlorophenyldiazonium (DPD) method[16].
-
The outcome assessed in this study was a combination of mortality and major disability determined 6 months after the aSAH episode. Patients were contacted over the telephone for survival and functional outcome information, which was scored with the modified Rankin Scale (mRS)[17] by trained research interviewers who were blind to the baseline GGT data. A score of 0 to 2 on the mRS indicated a good outcome; a score of 3 to 5 indicated major disability; and a score of 6 indicated death.
-
Patients were divided into three groups according to their baseline serum GGT levels as follows[18]: (1) < 30 U/L; (2) 30-50 U/L; and (3) ≥ 50 U/L. Baseline characteristics of the participants were compared using a Student's t-test, Wilcoxon rank-sum test or chi-square test as appropriate. Ordinal logistic regression analysis was performed with the mRS score as the dependent variable and the GGT category as the independent variable to determine a dose-dependent relationship. Adjusted rates of poor outcome in the three groups were calculated by direct method and compared by a multivariable logistic model. A multivariable logistic regression analysis was also used to estimate the association between serum GGT and poor prognosis using GGT as a continuous independent variable. The odds ratios (ORs) and 95% confidence intervals (CIs) of poor outcomes were also calculated for each of the upper two categories of GGT levels compared to the lowest category. Linear trend was tested by entering categorical variables as continuous parameters in the model. All statistical analyses were performed using SAS (version 9.3; SAS Institute, Cary, NC, USA) and R software (version 3.0; The R Foundation for Statistical Computing, Vienna, Austria).
-
By the 6-month follow-up, a total of 31 patients had died, and 50 patients had experienced a major disability (mRS score of 3-5). Table 1 shows the baseline characteristics among patients in the different GGT categories. Compared to the patients with lower GGT levels, subjects with higher GGT levels were more likely to be male, drinkers and to have more aneurysms in circle of willis and fewer aneurysms in anterior circulation. They also tended to have higher diastolic blood pressures, higher admission severity and larger aneurysm diameters.
Characteristics GGT < 30 U/L
18 (14-23)#30 U/L ≤ GGT < 50 U/L
37.5 (33-43) #GGT ≥ 50 U/L
71.5 (59.5-108.5) #P Value N 276 62 48 Age, (y) 57 ± 11.8 55.7 ± 10.8 53.6 ± 11 0.17 Male, n (%) 69 (25.0) 41 (66.1) 33 (68.8) < 0.01* Systolic blood pressure, (mmHg) 146 ± 23.9 153 ± 23.5 152 ± 28.1 0.07 Diastolic blood pressure, (mmHg) 86 ± 14.2 92 ± 17.3 91 ± 13.9 < 0.01* Blood glucose, (mmol/L) 7.9 ± 3.2 7.4 ± 2.2 8.4 ± 2.9 0.24 Aneurysm diameter, (mm) 5.4 ± 3.0 6.1 ± 2.9 7.1 ± 4.8 < 0.01* Drinking, n (%) 41 (14.9) 13 (21.0) 15 (31.3) 0.02* Hunt-Hess grade ≥ 3, n (%) 72 (26.1) 20 (32.3) 23 (47.9) 0.01* Fisher scale ≥ 3, n (%) 89 (32.3) 24 (38.7) 26 (54.2) 0.01* GCS ≤ 8, n (%) 33 (12.0) 8 (11.9) 13 (27.1) 0.02* Endovascular coiling, n (%) 232 (84.1) 52 (83.9) 39 (81.3) 0.89 Delayed cerebral ischemia 16 (5.8) 4 (6.5) 3 (6.3) 0.98 Interval from onset to admission#, (h) 8 (4-24) 8.5 (5-24) 10 (5-31) 0.79 Total bilirubin#, (μmol/L) 14.5 (11-18.5) 14.8 (11.4-20.3) 14.7 (10.5-19.5) 0.64 Location Anterior circulation, n (%) 198 (71.7) 38 (61.3) 23 (47.9) 0.003* Posterior circulation, n (%) 14 (5.1) 5 (8.1) 5 (10.4) 0.33 Circle of Willis, n (%) 64 (23.2) 19 (30.7) 20 (41.7) 0.02* Note. #was expressed by median (interquartile range); other continuous variables were expressed by mean ± standard deviation. *represented statistically significance (P < 0.05). Table 1. Baseline Characteristics of Participants According to Different GGT Levels
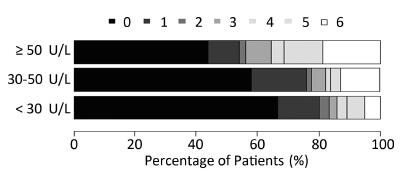
The graph in Figure 1 shows the relationship between functional recovery and each of the three GGT levels. The category with the lowest GGT had a median mRS score of 0 (interquartile range: 0-1), whereas the highest GGT category had a median mRS score of 1 (interquartile range: 0-5; P < 0.001). This figure reveals a stepwise, dose-dependent relationship between GGT levels and functional outcome (P < 0.01).

Figure 1. The ranges of the modified Rankin Scale scores are shown for each GGT category.
At the 6-month follow-up, the poor outcome rates after adjusting for age, sex and admission severity in the three groups, GGT < 30 U/L, 30 U/L ≤ GGT < 50 U/L and GGT ≥ 50 U/L were 16.7%, 19.6%, and 34.4%, respectively (P < 0.01) (Figure 2).
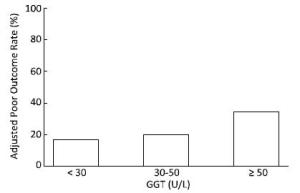
Figure 2. The adjusted poor outcome rates at the 6-month follow-up among the different GGT categories.
As shown in Table 2, among all patients, a per unit increase in GGT level was associated with a 1.03-fold increased risk of poor prognosis in the multivariable adjusted model (P < 0.05). Compared to the patients with GGT < 30 U/L, those with GGT ≥ 50 U/L had a higher risk of poor prognosis [OR (95% CI): 5.76 (2.74-12.13)] in the age-sex adjusted model. After further adjusting for blood pressure, fasting glucose, aneurysm diameter, aneurysm location, Hunt-Hess grade, Fisher scale, GCS, delayed cerebral ischemia, treatment and interval from onset to admission, this association was strengthened as the adjusted OR (95% CI) was 6.64 (2.05-21.52). After further adjustment for drinking status and total bilirubin, this association remained significant [OR (95% CI): 6.36 (1.92-21.02)]. A linear trend was observed in both the age-sex and multivariable adjusted models. This significant relationship between the level of GGT and aSAH prognosis was not substantially altered when we restricted the analysis to nondrinking patients.
GGT (U/L) Outcome Event/Total Number Model 1 Model 2 Model 3 Total patients Per unit increase 81/386 1.02 (1.01-1.03) 1.03 (1.01-1.04) 1.03 (1.01-1.04) < 30 46/276 1.00 (ref) 1.00 (ref) 1.00 (ref) 30-50 14/62 1.89 (0.90-3.93) 1.82 (0.59-5.67) 1.76 (0.57-5.51) ≥ 50 21/48 5.76 (2.74-12.13) 6.64 (2.05-21.52) 6.36 (1.92-21.02) P value for linear trend < 0.01 < 0.01 < 0.01 < 0.01 Nondrinking patients Per unit increase 67/317 1.02 (1.01-1.03) 1.02 (1.00-1.04) 1.02 (1.00-1.04) < 30 42/235 1.00 (ref) 1.00 (ref) 1.00 (ref) 30-50 11/49 1.55 (0.69-3.47) 1.44 (0.42-5.00) 1.44 (0.42-5.01) ≥ 50 14/33 4.94 (2.09-11.70) 5.56 (1.42-21.75) 5.55 (1.43-21.63) P value for linear trend < 0.01 < 0.01 0.02 0.02 Note. Model 1: adjusted for age and sex. Model 2: adjusted for model 1 plus blood pressure, blood glucose, aneurysm diameter, location, Hunt-Hess grade, Fisher scale, GCS, delayed cerebral ischemia, treatment and interval from onset to admission. Model 3: adjusted for model 2 plus total bilirubin and drinking status among total patients or adjusted for model 2 plus total bilirubin among nondrinking patients. Table 2. Adjusted Odds Ratios (95% CI) of Poor Outcome at 6-month Follow-up for Different GGT Levels
-
To our knowledge, this is the first cohort study to examine the relationship between baseline serum GGT levels and clinical outcome in aSAH patients. Patients with higher GGT levels at admission tended to have a poor prognosis, a finding that was true for all patients and also specifically for nondrinkers. Serum GGT can be a predictor of functional outcome after aSAH.
Previously, some studies have indicated that GGT plays an important role inthe progression of cardiovascular disease (CVD). A prospective cohort study of 14, 874 Finnish men and women suggested that serum GGT concentration was associated with risk of total and ischemic stroke in both sexs. A higher level of GGT was associated with a 1.91-fold increased risk of intracerebral hemorrhage risk among men and a 2.08-fold increased risk of subarachnoid hemorrhage among women[19]. Additionally, Ulus et al.[11] reported that acute coronary syndrome patients with higher serum GGT levels were more susceptible to major adverse cardiac events during follow-up in the coronary care unit and over 1- and 6-month periods.
Several mechanisms could explain the association between serum GGT and CVD progression. The pro-oxidant and pro-inflammatory activities of GGT could have promoted the atherosclerotic process[20]. GGT could be directly involved in the formation of atheromatous plaques[21]. Recently, four GGT fractions (big-, medium-, small-, and free-GGT) were described in humans[22]. Among them, the big-GGT fraction has been proven to correlate with conventional CVD markers and has been detected in atherosclerotic plaque[23-24]. In fact, GGT can catalyze the oxidation of LDL in the presence of iron, which is a process implicated in the pathogenesis of atherosclerosis[25-26]. Available evidence also supports a pathogenetic role for GGT activity in the evolution and instability of atherosclerotic plaques in different vascular areas[7]. Furthermore, atherosclerosis impairs endothelial dependent vasodilatation and may change the diameter and plasticity of cerebral vessels. A previous study showed that the atherosclerosis index was positively associated with the risk of poor functional outcomes among aSAH patients, a finding that was not caused by an increase in the frequency of delayed cerebral ischemia[27]. This finding was consistent with our study, as we found that the association between GGT level and aSAH prognosis was also independent of this important confounding variable.
Serum GGT is a sensitive marker that indicates alcohol consumption and abuse[28-29]. Therefore, it is important to determine whether serum GGT is an independent risk factor for CVD or simply a biological marker of excessive alcohol consumption. Although Jousilahti et al.[19] attributed the association between GGT and stroke to excessive alcohol consumption, they did not observe any direct relationship between drinking and stroke risk in the general population. Emdin et al.[7] further interpreted this result by attributing a role for GGT self-function in the atherosclerotic progress. Moreover, Fraser et al.[8] observed a similar detrimental effect of increased GGT levels on stroke among nondrinkers. In our study, we controlled for alcohol consumption to avoid biasing our results. Furthermore, we excluded alcohol consumers and still demonstrated that GGT predicts aSAH prognosis in nondrinkers. Therefore, we believe that increased serum GGT is an important predictor of functional outcomes after aSAH and not merely a biological marker of alcohol consumption.
This study has several strengths that deserve mentioning. This is the first cohort study to evaluate the association between serum GGT levels and the functional outcome of aSAH patients. The baseline and follow-up outcome data were collected with strict quality control. Furthermore, our findings were robust across main and sensitivity analyses. However, there are also some limitations that should be mentioned. First, this is a retrospective study based on a single-center cohort from a tertiary hospital, which may limit the external validity of the results. Second, the statistical power of our study is relatively low because of the small sample size. Third, GGT levels were determined with a single measurement at baseline, so there is an unavoidable risk that patients might have been misclassified based on these baseline GGT level measurements, however, this risk is probably low because previous studies have shown serum GGT stability over time[30-31]. Furthermore, some factors such as intracerebral hemorrhage, intraventricular hemorrhage, presence of hydrocephalus and the use of antiepileptic drugs were not included in this study. These variables maybe confounded the association between serum GGT and aSAH functional outcome.
In summary, patients with higher GGT levels were more likely to have a poor prognosis. Serum GGT can be considered to be a predictor of functional outcomes in aneurysmal subarachnoid hemorrhage patients. Decreasing the serum GGT levels during baseline may improve aneurysmal subarachnoid hemorrhage prognosis.
This study was supported by the Jiangsu Provincial Medical Youth Talent of the Project of Invigorating Health Care through Science, Technology and Education QNRC2016694
Technology Innovation Programme of Nantong University YKS14017
Six Talents Peak Project of Jiangsu Province 2015-WSN-061
fifth ‘226' High Level Talent Training Project of Nantong City, the National Natural Science Foundation of China 81502867

 Quick Links
 DownLoad:
