


HTML
-
Epidemiological studies have demonstrated that cigarette smoking (CS) is an independent risk factor for the development of atherosclerotic cardiovascular disease (ASCVD) and significantly contributes to the morbidity and mortality[1-3]. The effects of CS on cardiovascular system were reported to be doserelated[4], but fortunately, it has also been reported that smoking cessation can diminish the risk and improve the outcomes of ASCVD[5-6]. Importantly, the deleterious impact of CS on the cardiovascular system has been intensively examined, and its potential role has been suggested through multiple interrelated mechanisms, such as inflammation, vasomotor dysfunction, and lipid modifications[7-8]. For example, with regard to lipid metabolism, evidence shows that smokers always have an atherogenic lipid profile, with elevated levels of total cholesterol (TC), low-density lipoprotein (LDL) cholesterol (LDL-C) and triglyceride (TG) and attenuated levels of high-density lipoprotein (HDL) cholesterol (HDL-C)[9-12], suggesting a key role for smoking in lipid metabolism and ASCVD.
Recently, it has been proposed that lipoprotein particles can more accurately capture the atherogenic properties compared with cholesterol concentrations contained in the lipoproteins[13-16]. Previous studies have already indicated a negative impact of smoking on lipoprotein subfraction profiles, especially on HDL subfractions[17-19], even if there was no significant change in the serum levels of cholesterols[19]. The reversal impact of smoking cessation on lipid profile has also been documented in a meta-analysis[20]. However, there is not much information regarding the impact of smoking on lipoprotein subfractions, especially in individuals with smoking cessation. In addition, the mortality and morbidity of coronary artery disease (CAD) have rapidly increased in the young, which is paralleled with the elevated rate of current smoking in Chinese population[21]. This is also a reason due to which we performed the present study focusing on the impact of smoking status on the lipoprotein subfractions.
Apparently, intensive studies on the relationship between smoking and lipoprotein subfractions deepen the current understanding of the link between smoking and the risk of ASCVD[17]. Therefore, in the present study, we consecutively enrolled a relatively large Chinese cohort who were not under a lipid-lowering drug treatment and investigated the impact of current smoking on the distribution of lipid profile and lipoprotein subfractions.
-
The present study fully complied with the Declaration of Helsinki and was approved by the Ethics Committee of FuWai Hospital and Cardiovascular Institute, Beijing, China. All included patients provided prior written consent.
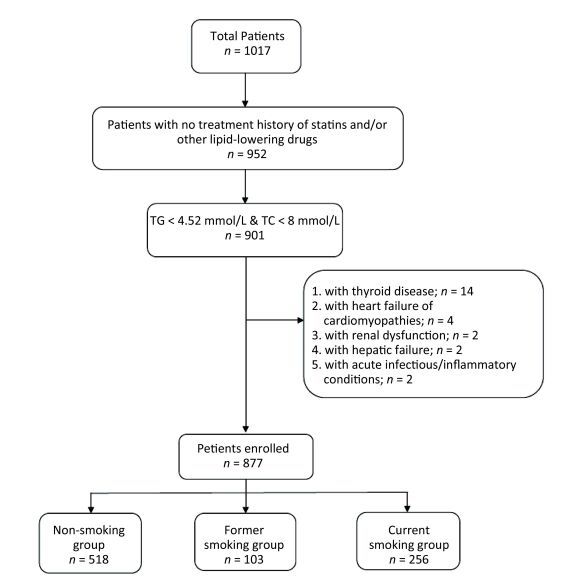
This study recruited consecutive 1017 patients with angina-like chest pain. The exclusion criteria: 1) aged < 18 years; 2) with a treatment history of statins and/or other lipid-lowering drugs prior to entering the study; 3) severe end-stage diseases, such as renal and/or liver dysfunction, heart failure, and malignant carcinoma; 4) systematic inflammatory disease or severe infection; 5) thyroid disorder; and 6) pregnancy. The flow chart of patient recruitment is shown in Figure 1.
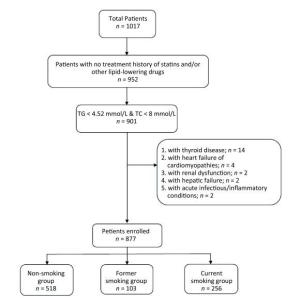
Figure 1. Flow chart showing stepwise exclusion patients
Patients with complete data were assessed for medical history, baseline clinical features, and traditional cardiovascular risk factors, and the final 877 eligible patients were subjected to analysis. Smoking status was confirmed using a questionnaire at the lipid clinics and/or during hospitalization[22]. Current smoking was defined as people who smoked at least 100 cigarettes in lifetime and were continuing smoking at the time of interview. Former smoking was defined as those who smoked at least 100 cigarettes in lifetime but had quit smoking at the time of interview. Never smoking was defined as people who never smoked or who have smoked less than 100 cigarettes in lifetime[23]. Type 2 diabetes was diagnosed if the repeated fasting blood glucose (FPG) level was ≥ 7.0 mmol/L and/or non-FPG level was ≥ 11.1 mmol/L or if the subject was currently taking oral hypoglycemic agents or receiving insulin therapy. CAD was diagnosed by elective coronary angiography as least one major epicardial coronary artery (≥ 2 mm) having a diameter of stenosis ≥ 50%. Hypertension was defined as blood pressure measurement of ≥ 140/90 mmHg in multiple determinations under different environments or patients taking antihypertensive drugs although the blood pressure was normal. Patients were divided into nonsmoking (n = 518), former smoking (n = 103), and current smoking (n = 256) groups.
-
Fasting venous blood was obtained and collected into ethylenediaminetetraacetic acid (EDTA)-containing tubes and subsequently stored at-80 ℃ for the measurement of lipoprotein subfractions. Concentrations of traditional lipid parameters (TG, TC, LDL-C, and HDL-C) and glucose levels were measured by an automatic biochemistry analyzer (Hitachi 7150, Tokyo, Japan). Using the Lipoprint System (Quantimetrix Corporation, Redondo Beach, CA, USA) and referencing the manual that was described previously[8], electrophoretic technology was performed to analyze the lipoprotein subfractions. The HDL was divided into 10 sorts of subfractions, while the LDL was divided into 7 by this analysis[24]. For HDL, 1-3 subfractions indicate large HDL particles, 4-7 subfractions represent intermediate particles and 8-10 subfractions mean small particles[24]. Meanwhile, LDL subfraction 1 indicates large LDL particles, subfraction 2 represents intermediate particles and subfractions 3-7 mean small particles. Subsequently, the concentration (mg/dL) of each of the lipoprotein subfraction cholesterol and the proportion (%) of the lipoprotein subfractions besides the mean LDL particle size (Å) were determined.
-
SPSS version 19.0 (SPSS Inc., Chicago, IL, USA) was used for analyzing the present data. Continuous variables were presented as mean ± SD and categorical variables as number (percentage). The independent sample t-test or the Mann-Whitney U test was performed to analyze the differences in the clinical characteristics and lipid profiles between the two groups, wherever appropriate. Linear logistic regression analyses were performed for assessing the independent contributors from all lipoprotein subfractions. Statistical significance was defined as a two-tailed P value < 0.05.
Study Design and Population
Laboratory Analysis
Statistical Analysis
-
The characteristics of the enrolled subjects are shown in Table 1. Compared with nonsmoking individuals and former smoking subjects, a significantly higher proportion of current smoking patients had the habit of alcohol consumption (40.2% vs. 21.4% vs. 10.1%, P < 0.001, Table 1). There were also significant differences among the three groups in terms of age, body mass index (BMI), gender, and morbidity of CAD (age: 55 ± 10 vs. 59 ± 10 vs. 56 ± 12 years, P = 0.003; BMI: 26.09 ± 3.48 vs. 26.03 ± 3.31 vs. 25.06 ± 3.56 kg/m2, P = 0.001; rate of male gender: 93.0% vs. 96.1% vs. 41.3%, P < 0.001; morbidity of CAD: 73.0% vs. 83.5% vs. 55.8%, P < 0.001; respectively, Table 1). Moreover, the HDL-C levels of CS patients were substantially low (1.01 ± 0.26 vs. 1.06 ± 0.32 vs. 1.17 ± 0.36 mmol/L, P < 0.001, Table 1), and the difference was significant (adjusted P value = 0.006) even after adjusting for traditional risk factors consisting of gender, age, BMI, alcohol consumption history, family history of CAD, systolic blood pressure, hemoglobin A1C (HbA1C), and CAD. The level of TG was elevated in current smoking patients (1.82 ± 0.81 vs. 1.64 ± 0.68 vs. 1.64 ± 0.79 mmol/L, P = 0.002, Table 1), but the increasing tendency disappeared after adjusting for traditional risk factors (adjusted P = 0.094). The difference in TC levels among the current smoking, former smoking, and nonsmoking groups was not statistically significant even after adjusting for traditional risk factors; in addition, the levels of LDL-C were almost equal among the three groups.
Variables Non Smoking (n = 518) Former Smoking (n = 103) Current Smoking (n = 256) P Value Adjusted P Value Clinical Characteristics Male Gender [n (%)] 214 (41.3%) 99 (96.1%) 240 (93.0%) < 0.001 - Age (years) 56 ± 12 59 ± 10 55 ± 10 0.003 - BMI (kg/m2) 25.06 ± 3.56 26.03 ± 3.31 26.09 ± 3.48 0.001 - Drinking [n (%)] 52 (10%) 22 (21.4%) 103 (40.2%) < 0.001 - FH of CAD [n (%)] 81 (15.6%) 18 (17.5%) 46 (18.0%) 0.336 - Dislipidemia [n(%)] 281 (54.2%) 58 (56.3%) 148 (57.8%) 0.803 - Hypertension[n (%)] 279 (53.9%) 63 (61.2%) 155 (60.5%) 0.307 - Diabetes [n (%)] 95 (18.3%) 26 (25.2%) 56 (21.9%) 0.113 - CAD [n (%)] 289 (55.8%) 86 (83.5%) 187 (73%) < 0.001 - ACEI/ARB [n (%)] 97 (18.7%) 23 (22.3%) 42 (16.4%) 0.415 - β-blocker [n (%)] 84 (16.2%) 27 (26.2%) 57 (22.3%) 0.056 - CCB [n (%)] 93 (18.0%) 28 (27.2%) 54 (21.2%) 0.173 - Lipid Profiles TG (mmol/L) 1.64 ± 0.79 1.64 ± 0.68 1.82 ± 0.81 0.002 0.094 TC (mmol/L) 4.83 ± 0.92 4.65 ± 0.95 4.70 ± 0.87 0.046 0.554 HDL-C (mmol/L) 1.17 ± 0.36 1.06 ± 0.32 1.01 ± 0.26 < 0.001 0.006 LDL-C (mmol/L) 3.18 ± 0.87 3.12 ± 0.88 3.19 ± 0.87 0.707 - HDL subfractions Large HDL-C (mg/dL) 15.11 ± 7.84 13.10 ± 5.26 11.34 ± 5.19 < 0.001 0.002 Medium HDL-C (mg/dL) 21.22 ± 5.95 20.39 ± 6.73 19.47 ± 4.59 < 0.001 0.005 Small HDL-C (mg/dL) 7.85 ± 2.66 7.64 ± 3.09 8.40 ± 2.90 0.019 0.032 Large HDL (%) 32.85 ± 8.42 31.37 ± 6.95 28.21 ± 7.29 < 0.001 0.009 Medium HDL (%) 48.81 ± 5.25 49.75 ± 4.37 49.91 ± 4.17 0.063 0.552 Small HDL (%) 18.31 ± 5.67 18.86 ± 5.70 21.85 ± 6.21 < 0.001 0.001 LDL subfractions Large LDL-C (mg/dL) 27.82 ± 9.53 27.60 ± 9.35 26.51 ± 8.17 0.415 - Medium LDL-C (mg/dL) 17.84 ± 8.05 18.80 ± 7.98 20.19 ± 8.13 0.002 0.029 Small LDL-C (mg/dL) 6.24 ± 6.51 6.21 ± 6.55 8.22 ± 8.18 0.042 0.283 Large LDL (%) 14.93 ± 3.99 15.28 ± 3.83 14.69 ± 3.96 0.302 - Medium LDL (%) 9.43 ± 3.49 10.23 ± 3.12 10.87 ± 3.25 < 0.001 0.003 Small LDL (%) 3.27 ± 3.27 3.30 ± 3.36 4.27 ± 3.84 0.013 0.355 Mean LDL particle size (Å) 267.83 ± 4.90 267.60 ± 4.66 266.44 ± 4.89 0.008 0.285 Note. The data shown are the mean ± SD or n (%). Adjusted traditional risk factors include gender, age, BMI, alcohol consumption history, family history of CAD, systolic blood pressure, HbA1C, and CAD. BMI = body mass index; CAD = coronary artery disease; ACEI = angiotensin converting enzyme inhibitors; ARB = angiotensin receptor blockers; CCB = calcium channel blockers; FH = family history; HbA1C = hemoglobin A1C; TG = triglyceride; TC = total cholesterol; HDL-C = high-density lipoprotein cholesterol; LDL-C = low-density lipoprotein cholesterol. Table 1. Baseline Characteristics, Lipid Parameters, and Lipoprotein Subfractions in the Current Smoking and Nonsmoking Patients
-
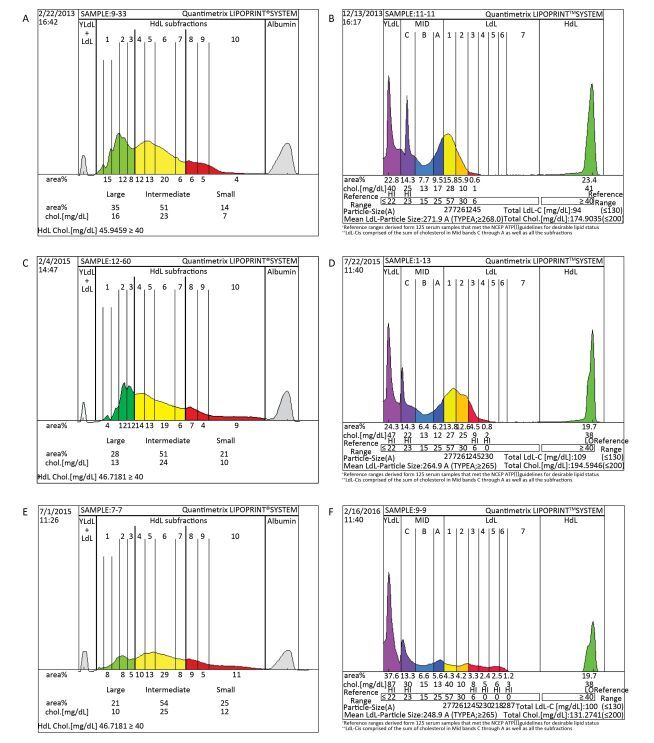
Lipoprotein subfractions were measured in 256 current smoking patients, 103 former smoking patients and 518 nonsmoking individuals. To demonstrate the changes clearly, we elected the typical figure of HDL and LDL subfractions from nonsmoking group, former smoking group, and current smoking group respectively (Figure 2).
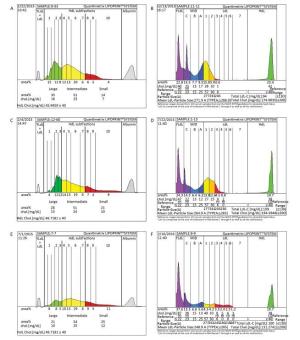
Figure 2. The distribution of lipoprotein subfractions in typical patients from the nonsmoking group (A: HDL subfractions; B: LDL subfractions), former smoking group (C: HDL subfractions; D: LDL subfractions), and current smoking group (E: HDL subfractions; F: LDL subfractions)
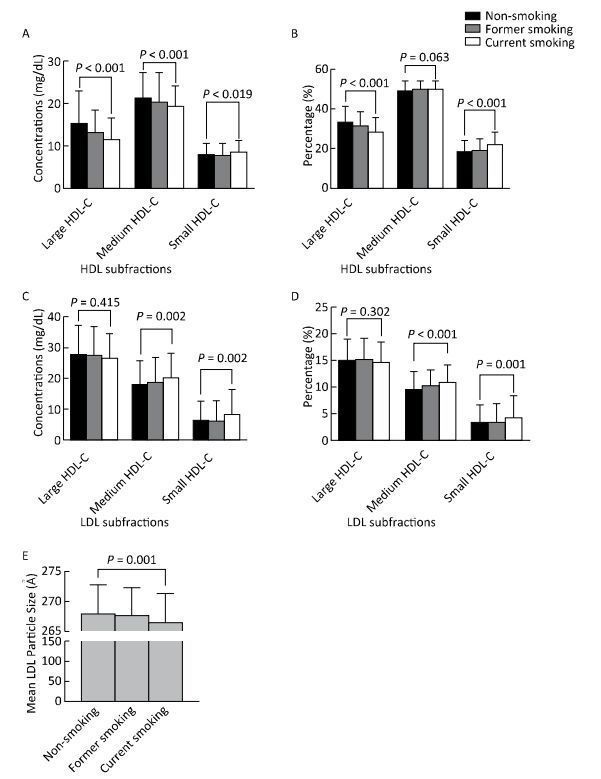
As shown in Table 1 and Figure 3, compared with the nonsmoking and former smoking groups, in the unadjusted analysis, the current smoking group presented a significant reduction in large HDL-C subfraction concentration and percentage and in medium HDL-C concentration (15.11 ± 7.84 vs. 13.10 ± 5.26 vs. 11.34 ± 5.19 mg/dL, P < 0.001, after adjusted P = 0.002; 32.85% ± 8.42% vs. 31.37% ± 6.95% vs. 28.21% ± 7.29%, P < 0.001, after adjusted P = 0.009; 21.22 ± 5.95 vs. 20.39 ± 6.73 vs. 19.47 ± 4.59 mg/dl, P < 0.001, after adjusted P = 0.005; respectively); nevertheless, the small HDL subfraction concentration and percentage were distinctly higher (7.85 ± 2.66 vs. 7.64 ± 3.09 vs. 8.40 ± 2.90 mg/dL, P = 0.019, after adjusted P = 0.032; 18.31% ± 5.67% vs. 18.86% ± 5.70% vs. 21.85% ± 6.21%, P < 0.001, after adjusted P = 0.001, respectively). Table 1 also indicates that compared with nonsmoking individuals and former smoking subjects, the medium LDL-C concentration and percentage were significantly higher in the current smoking patients (17.84 ± 8.05 vs. 18.80 ± 7.98 vs. 20.19 ± 8.13 mg/dL, P = 0.002, after adjusted P = 0.029; 9.43% ± 3.49% vs. 10.23% ± 3.12% vs. 10.87% ± 3.25%, P < 0.001, after adjusted P = 0.003; respectively). Moreover, the results demonstrate that the mean LDL particle size of current smoking patients showed a decreasing tendency (267.83 ± 4.90 vs. 267.60 ± 4.66 vs. 266.44 ± 4.89 Å, P = 0.008) while the small LDL-C concentration and small LDL percentage showed increasing tendencies (6.24 ± 6.51 vs. 6.21 ± 6.55 vs. 8.22 ± 8.18 mg/dL, P = 0.042; 3.27% ± 3.27% vs. 3.30% ± 3.36% vs. 4.27% ± 3.84%, P = 0.013; respectively), but these tendencies disappeared after adjusting for traditional risk factors. However, no significant difference was observed among the other lipoprotein subfractions in the three groups.
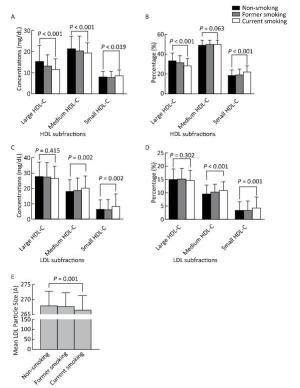
Figure 3. Lipoprotein subfractions of the nonsmoking group, former smoking group and current smoking group. (A) Concentrations of HDL-C subfractions, (B) percentages of HDL subfractions, (C) concentrations of LDL-C subfractions, (D) percentages of HDL subfractions, and (E) mean LDL particle size.
Clinical Characteristics and Traditional Lipid Parameters
Lipoprotein Subfractions in the Nonsmoking, Former Smoking, and Current Smoking Patients
-
The changes in the lipoprotein subfractions, the influencing factors, and interventions are of novel interest in lipid-related research field. The present relatively large cross-sectional study demonstrated a significant increase in medium LDL subfraction percentage, medium LDL-C and small HDL-C concentrations, and small HDL subfraction percentage but a notable decrease in large HDL-C concentration, medium HDL-C concentration, and HDL subfraction percentage among CS individuals, which were closer to the atherogenic subfraction pattern compared with the nonsmoking and former smoking individuals. More interestingly, the analysis also suggested that smoking cessation could attenuate the above mentioned worse pattern of lipoprotein subfractions but not completely reverse these changes (not shown in table). Thus, our data highlight an important pathophysiological role of smoking in the changes of lipoprotein particles, which may be valuable for future prevention and intervention of ASCVD.
Previous studies have suggested that lipoprotein subfractions composed of lipoprotein particles were heterogeneous; in other words, and groups of subfractions had different size, density, and functions[25-26]. Thus, the lipoprotein related risks might be explained more clearly by the lipoprotein subfractions. The features and functions of lipoprotein subfractions were found to be changed in the status of ASCVD, diabetes, hypertension, or inflammation[22, 27-29]. In a recent study on 413 Chinese Han subjects with CAD, the authors found that small HDL and LDL subfractions were positively associated with the presence of CAD[24].
Although the relationship between smoking and ASCVD has been well documented, the mechanisms by which smoking increases ASCVD risk seems to be multifactorial and incompletely understood. Based on the previous studies and clinical trials[7-8], the potential links between smoking and the increased risk of ASCVD cover the pathways, including inflammation, systemic hemostatic and coagulatory dysfunctions, oxidative stress, and dyslipidemia (in particular, lipoprotein and lipoprotein subfractions). Indeed, a previous study strongly suggested that CS was associated with reductions in HDL-C and mild increase in TG[9]. In the present study, coincident with the previous study, the data indicated that CS patients showed a significant decrease in HDL-C levels and an elevated tendency of TG levels compared to those in nonsmoking individuals. In addition to the changes in HDL-C and TG levels, CS patients had frequently higher plasma levels of TC and LDL-C[10-11], although our study failed to test this change due to unknown reasons, but the result was similar to a study on male subjects with chronic smoking[19].
Moreover, few studies have focused on the impacts of current smoking on lipoprotein subfractions. Beauchamp A et al. studied 612 participants using nuclear magnetic resonance spectroscope techniques and found that the mean total LDL particle concentration was higher, while the total HDL and large HDL particle concentrations were lower in female smokers than in nonsmokers. They concluded that female smokers have a more atherogenic lipoprotein profile than that of nonsmokers, but they did not observe any significant difference among males[19]. Another small sample size study (n = 46) from Japan on the effects of smoking on HDL-C subfractions in young women showed significantly lower HDL2-C levels[30], which was similar to the observation reported by Moffatt RJ et al[31]. In our large sample size study, on untreated patients, the data suggested that CS patients had attenuated medium-and elevated small-HDL particles besides the lower levels of large HDL and higher levels of medium LDL subfractions. This change in the lipoprotein subfractions in our study may be more important for triggering ASCVD because the large HDL subfractions have been supposed to be antiatherosclerotic agents, whereas the small subfractions were supposed to be atherogenic agents[32]. Based on these findings including ours, the data strongly indicated that CS was an overt trigger for the perturbation of lipoprotein subfractions, which might increase the atherogenic potential.
Several studies have demonstrated that smoking cessation could reverse the lipid changes, in particular, the changes in HDL-C levels[17-20]. However, only two studies had examined the effects of smoking cessation on the distribution of lipoprotein subfractions. A prospective study carried out by Beauchamp A et al. indicated that former smokers had larger HDL and lower medium LDL particle concentrations than those of current smokers in female subjects[19]. Gepner AD et al.[17] found that smoking cessation could improve large HDL particles especially in women. Apparently, these studies suggested reverse effects of smoking on these lipoprotein subclasses. Similarly, the present study, using the Lipoprint System, showed remarkable reversing effects on the distribution of lipoprotein subfractions after smoking cessation. Though a non significant increase in the level of HDL-C in smoking cessation subjects was found, an increase in large HDL particles and a decrease in small particles were detected, suggesting a potential attenuation in ASCVD risk. More importantly, the present data clearly showed that the reversions of HDL subfractions by smoking cessation were partial. Furthermore, the data showed that the small LDL subfractions were lower and the mean size of LDL particles were larger in former smoking patients than those in current smoking subjects but were similar to those in nonsmokers.
In this cross-sectional study on untreated patients with angina-like chest pain, we illustrated the changes in the lipoprotein subfractions in different smoking status. Compared with nonsmokers and former smokers, current smoking patients manifested a more atherogenic lipoprotein subfraction profile that was primarily reflected by the decrease in large HDL particles and the increase in small particles. The negative effects of smoking on lipoprotein subfractions could be reversed to some degree by smoking cessation. Hence, our data provided additional information concerning the relationship between CS and ASCVD and strongly suggested a benefit on lipoprotein subfractions through smoking cessation.
-
The present study certainly exhibit several limitations. First, since this was a cross-sectional study on the Chinese Han cohort who were not under a lipid-lowering therapy from a single center, a long-term follow-up should be carried out. Second, smoking was self-reported, and other behaviors such as sedentary and unhealthy dietary habits were not considered in this study, which might cause a bias. In additional, there are different measurements of lipoprotein subfractions; thus, other methods might produce different results. Moreover, the subjects enrolled in the present study included only a small proportion of women, and thus the sexual differences cannot be delineated in our data. Furthermore, we did not analyze the dose-dependent effect of smoking and time course of smoking cessation, which is also another limitation of our study. Finally, selecting the subjects with angina-like chest pain in this study might increase the potential confounding factor, thereby influencing results.
Capital Health Development Fund 2016-1-4035
Beijing Natural Scientific Foundation 7131014
Capital Health Development Fund 2011400302
This study was partly supported by National Natural Scientific Foundation 81241121
Capital Special Foundation of Clinical Application Research Z121107001012015

 Quick Links
 DownLoad: