


HTML
-
Physical inactivity is a well-established, behavioural lifestyle risk factor for non-communicable chronic disease (NCD)[1]. Many community-based projects to prevent NCD focus on low-cost lifestyle modifications and community participation, and improving physical activity has been a key point of the community-based interventions[2-3]. As a result, the measurement of physical activity (PA) at the community level is essential in health promotion.
Three types of PA assessment methods can be distinguished as follows: 1) criterion methods: a double-labelled water measurement, indirect calorimetry and direct observation; 2) objective methods: activity monitors (pedometers and accelerometers) and heart rate monitoring; and 3) subjective methods: questionnaires and PA logs[4]. Although with better reliability and accuracy, the criterion and objective methods are impractical when considered in large-scale epidemiological studies.
As a feasible and practical option, many questionnaire instruments have been developed to measure PA in various age groups[5]. The International Physical Activity Questionnaire (IPAQ), including the long form (IPAQ-L), and the short form (IPAQ-S), which is targeted to assess adult PA, has become one of the most commonly used questionnaires. Although the short IPAQ is a good questionnaire to estimate general moderate-to-vigorous PA (MVPA), the IPAQ-L assesses more detailed information on various domains or intensities of PA[6]. The IPAQ-L has been translated into Chinese and tested in Beijing[7], Chengdu[8], and Hong Kong[9-10]. However, these study subjects were limited to specific age/gender groups: college students[7, 9], urban women[8], and older adults[9]. The IPAQ-L was specifically modified for the Cantonese-speaking group of Chinese who live in the most southern regions of China for two Hong Kong studies[9-10], where the dialects and written characters differ from those commonly used in mainland China. Thus, the reliability and validity of the IPAQ-L performed in the general population in mainland China still remain unknown.
In this study, we used the improved version of IPAQ-L developed in a previous Beijing study in 2004[7] and examined its test-retest reliability and criterion validity using the pedometer as the reference in a general population in Hangzhou, China.
-
This study was conducted in Hangzhou from October to December in 2011. The city of Hangzhou, which is the capital of Zhejiang Province, is situated in the southeast coastal area of China. It is an economically developed city in China, and its comprehensive economic strength ranked eighth among all large-and medium-sized cities in China in 2011[11]. Two districts located in a central geographic location of Hangzhou were included for testing the reliability and validity of IPAQ-L.
All administrative planning units in these two districts are classified into five categories[12] based on the degrees of land-use mix and public service capacity. The type Ⅰ unit is characterized by fully developed commercial and residential areas and a high degree of land-use mix. The type Ⅱ unit has developed but scattered public buildings and lacks comprehensive service capacity. The type Ⅲ unit features partly developed and single functional public buildings. Type Ⅳ and type Ⅴ units are mainly composed of farmland and industrial storage warehouses and lack community-dwelling adults; these were excluded from this study. Two neighbourhoods were selected from each of the three types of units, and a convenience sample of 28 permanent residents aged 25-59 years from each neighbourhood (i.e., a total of six neighbourhoods with 168 people from type Ⅰ-Ⅲ category) were included in this study. The 28 participants in each neighbourhood were further sampled so that we had equal numbers of men and women and equal numbers of people in seven five-year age groups. People aged 18-24 years were not eligible for this study because most of them were university students who lived on campus or were studying in other cities. People aged older than 60 years were also excluded, as this population is usually regarded as elderly in society.
-
The IPAQ-Long form was developed to measure the frequency and duration of walking, moderate and vigorous intensity of PA, for leisure, transportation, housework, and occupational purposes as well as the sitting time during the past 7 days. The Simplified Chinese-character version of IPAQ-L used in our study was developed by LI KJ in 2004, with translation and back-translation following the instructions given in the IPAQ manual[6]. Minor revisions on sentence expressions and cultural adaptation were conducted for better understanding and communication between local subjects and investigators in Hangzhou. The IPAQ-L data were converted to metabolic equivalent task (MET) scores for each dimension or intensity of PA following the IPAQ scoring procedure. To calculate the weekly physical activity (MET-min/week), the number of total minutes dedicated to each activity class was multiplied by the specific MET score for that activity, with 3.3 METs for walking, 4 METs for moderate activity, 6 METs for cycling, and 8 METs for vigorous activity[12].
Three levels of PA were created according to the recommended categorical score[13]: (1) Low: no PA is reported or some PA is reported but not enough to meet categories (2) or (3). (2) Moderate: 3 or more days of vigorous-intensity PA of at least 20 min per day; or 5 or more days of moderate-intensity PA and/or walking of at least 30 min per day; or 5 or more days of any combination of walking, moderate-or vigorous-intensity PA achieving a minimum of at least 600 MET-min/week. (3) High: vigorous-intensity PA on at least 3 days and accumulating at least 1, 500 MET-min/week; or 7 or more days of any combination of walking, moderate-or vigorous-intensity PA accumulating at least 3, 000 MET-min/week.
-
The pedometers (Omron HJ-302, Omron, Japan) used in our study respond to accelerations of the human body such as walking or running. With the advanced 3-dimensional motion sensing technology, the Omron pedometers can be worn on the waistband or carried in a pocket by the residents. The pedometers record PA after it has started at least 4 s to prevent any miscount. Any PA detected was recorded as a 'step' taken. With step length entered at the initial setting, 'steps' were automatically converted to 'Walking Distance' (km) at the end of the week. PA intensity ranging from 2 to 4 MET were monitored and displayed by the pedometer at all times. PA above 3 METs and lasting at least 10 min were recorded as 'effective steps' and automatically converted to 'Exercise' (Ex for short) at the end of the week to reflect the PA levels of the residents. Ex means the PA amounts, which is equal to the monitoring value of PA intensity (MET) × hours in a week (Ex = MET × hours/week). The reliability and validity of Omron pedometer HJ-302 have been tested in China[14].
-
Test-retest reliability was assessed by comparing the first (Day 1) and the second (Day 9) survey of IPAQ-L, with a 7-day interval in between. After the first survey, half of the subjects (one man and one woman from each of seven five-year age groups in each neighbourhood) were handed pedometers to wear day 2 to day 8 to objectively record their physical activities on a voluntary basis. Pedometer-based PA level measure 'Ex' data were used as the primary reference to test criterion validity by comparing with the data of the second survey of IPAQ-L on day 9. 'Walking distance' was the secondary criterion measure as it can't reflect the total PA amounts with various intensity. In addition to a pedometer, booklets were handed to participants to record daily physical activities in the event that they forgot or it was inconvenient to wear a pedometer. Information on demographic characteristics and social economic status (SES) were also collected in the first survey.
We used face-to-face interviews to collect our data, and all the participants provided written informed consent before the interview. The study was approved by the Peking University Institutional Review Board (Certificate Number: IRB00001052-11030).
-
Demographic or SES information used means ± standard deviations or percentages. Body mass index (BMI) was calculated as weight in kilograms divided by the square of height in metres. Waist-to-height ratio (WHtR) was calculated using waist circumference (midway between the iliac crest and the lower rib margin at the end of normal expiration) divided by height. Physical activities and Ex were reported as median and inter-quartile range for their skewed distributions with the unit MET-min/week. After the log10 transformation of the MET-min score, an independent samples t-test was used to compare PA in different dimensions and intensities between men and women.
In the present study, each participant completed the face-to-face interviews twice with a different independent rater, and these raters were considered representative of a larger population of similar raters. As a result, a single-measure intra-class correlation coefficient (ICC, one-way random-effects model) was used to assess the test-retest reliability between the first and second survey. All PA data were added by 1 and converted into logarithm scores to improve normality to meet the ICC requirements. Percentage of agreement and kappa statistic was used to assess the repeatability of the distribution of low, moderate and high PA levels. Fisher's r-to-z transformation was used to test the difference of test-retest reliability between age and gender groups after Spearman's rank correlation coefficient was calculated[15].
Spearman's rank correlation coefficient of the IPAQ-L with objectively measured Ex and Walking Distance were calculated to measure criterion validity. Partial correlation was applied to control the effects of age, gender, BMI, education attainment and job status on PA. The variables used for the Bland Altman analysis were weekly MET-min spent in total PA and walking behaviour according to IPAQ versus pedometer. The PASW version 18.0.0 (IBM Corporation, Somers, NY, USA) was used for data analysis[16].
Study Area and Participants
Physical Activity Assessment (IPAQ-Long Chinese Version)
Pedometer
Outcome Measurement
Data Analysis
-
A total of 158 participants aged 25-59 years were eligible for analysis. Ten subjects (3 men and 7 women) were excluded from our study because of incomplete data. Demographic and SES information of study participants are shown in Table 1. According to our sampling procedure, participants were almost evenly split by gender, with similar age distribution between the sexes. Women tended to have lower BMI (P = 0.002) and WHtR (P= 0.030) than men. As for socioeconomic status, education attainment and income were not significantly different between genders. The percentage of unemployed was higher in women because of different legal retirement age requirements.
Items Men (N = 81) Women (N = 77) P Demographic Info Age (y) 42.9 ± 10.2 43.5 ± 10.3 0.729 Height (cm) 173.1 ± 5.2 160.5 ± 4.5 < 0.001 Weight (kg) 72.3 ± 8.7 58.6 ± 8.9 < 0.001 Waist circumference (cm) 85.7 ± 6.8 77.1 ± 7.8 < 0.001 BMI (kg/m2) 24.1 ± 2.6 22.7 ± 2.9 0.002 WHtR 0.50 ± 0.04 0.48 ± 0.05 0.030 SES Info Education beyond primary school (n, %) 79 (97.5%) 70 (90.9%) 0.073 Unemployment (n, %) 4 (4.9%) 22 (28.6%) < 0.001 Per capita disposal annual income (10 k RMB) (percent of missing values on income variable) 3.1 ± 1.7 (17.2) 3.3 ± 1.8 (14.3) 0.410 Table 1. Demographic and SES Information of Study Participants by Gender
Table 2 shows the dimensions and intensities of PA measured by the IPAQ-L and pedometer. Among four dimensions of PA, men tended to participate in more work-related and less domestic PA than women in both surveys (P ≤ 0.001). Among the three intensities of PA, men tended to spend more time in vigorous intensity PA than women in both surveys (both P < 0.001). No significant difference was found in the total amount of PA between men and women. In the first and second surveys, 7.5% and 9.4% of all participants reported themselves as physically inactive (not shown in the table).
Items Total (N = 158) Men (N = 81) Women (N= 77) P First Survey (day 1) (MET-min/week) Dimensions of PA Work-related PA 330 (1, 659) 417 (2, 049) 198 (746) < 0.001 Transportation PA 660 (1, 224) 459 (1, 151) 870 (1, 362) 0.097 Housework PA 323 (540) 180 (450) 420 (1, 080) < 0.001 Leisure Time PA 281 (891) 306 (983) 240 (893) 0.073 Intensities of PA Walking 990 (1, 716) 957 (1, 485) 1320 (2, 071) 0.843 Moderate intensity 865 (1, 676) 810 (1, 260) 1080 (1, 970) 0.092 Vigorous intensity 0 (480) 0 (720) 0 (0) < 0.001 Total PA 2, 460 (3, 540) 2, 389 (3, 676) 3050 (4, 191) 0.597 Second Survey (day 9) (MET-min/week) Dimensions of PA Work-related PA 344(1, 223) 594 (1, 884) 198 (576) 0.001 Transportation PA 486 (1, 221) 413 (1, 233) 594 (1, 188) 0.002 Housework PA 270 (660) 150 (540) 360 (1, 080) < 0.001 Leisure time PA 297 (722) 438 (847) 231 (737) 0.016 Intensities of PA Walking 883 (1, 493) 858 (1, 535) 891 (1, 485) 0.841 Moderate intensity 870 (1, 650) 840 (1, 470) 900 (1650) 0.022 Vigorous intensity 0 (290) 0 (720) 0 (0) < 0.001 Total PA 2, 725 (3, 469) 2, 738 (3, 153) 2, 591 (3, 392) 0.341 Pedometer (day 2 to day 8) Total (N = 80) Men (N = 41) Women (N = 39) Ex (MET-min/ week) 1, 141 (764) 1, 287 (810) 990 (674) 0.841 Walking distance (km)a 26.1 ± 12.6 29.6 ± 13.8 22.4 ± 10.3 0.061 Note. a: Mean ± SD was used for walking distance. Table 2. IPAQ-L and pedometer measured physical activity (median with interquartile range)
-
Test-retest reliability results are presented in Table 3. Among the four dimensions of PA, the ICC for leisure time PA was the lowest (ICC = 0.37; 95% CI: 0.23, 0.50), and the remaining dimensions performed quite well. The housework PA showed the biggest ICC of 0.73. ICC of total PA was 0.67. The analysis of PA by intensity showed at least a fair level of repeatability for each intensity. The test-retest reliability was highest for walking (ICC = 0.71), followed by moderate PA (ICC = 0.65) and was lowest for vigorous PA (ICC = 0.56). The percentage agreement for the distribution of low, moderate and high categories between two surveys was 72.2%, with a kappa statistic of 0.515 (P < 0.001).
Items ICCa (n = 158) 95% CI Spearman's ρ by Age Spearman's ρ by Gender Age < 40 (n = 64) Age ≥ 40 (n = 94) Z Score P Men (n = 81) Women (n = 77) Z Score P Dimensions of PA Work-related PA 0.69 (0.59, 0.76) 0.60 0.73 1.42 0.156 0.72 0.64 0.92 0.358 Transportation PA 0.44 (0.30, 0.56) 0.53 0.60 0.62 0.535 0.70 0.46 2.28 0.023 Housework PA 0.73 (0.65, 0.80) 0.71 0.69 0.24 0.810 0.71 0.69 0.24 0.810 Leisure time PA 0.37 (0.23, 0.50) 0.48 0.49 0.24 0.810 0.58 0.38 1.62 0.105 Intensities of PA Walking 0.71 (0.62, 0.78) 0.62 0.66 0.41 0.682 0.75 0.51 2.53 0.011 Moderate intensity 0.65 (0.55, 0.73) 0.78 0.64 1.74 0.082 0.74 0.65 1.08 0.280 Vigorous intensity 0.56 (0.45, 0.66) 0.40 0.69 2.56 0.011 0.60 0.48 1.05 0.294 Total PA 0.67 (0.57, 0.75) 0.62 0.76 1.64 0.101 0.77 0.68 1.18 0.238 Note.a: One-way random effect single measure ICC, with all P < 0.001. Table 3. Test-retest Reliability of IPAQ-L
Spearman's ρ for subjects aged < 40 years tended to indicate lower reliability for vigorous PA (0.40 vs. 0.69, P = 0.011) compared to subjects aged ≥ 40 years. Compared to women, men tended to have higher reliability for transportation-related PA (0.70 vs. 0.46, P = 0.023) and walking behaviour (0.75 vs. 0.51, P = 0.011). No significant difference was found in total PA between genders.
-
Table 4 shows the results of criterion validity using pedometer data as a reference. Spearman's rank correlation showed walking, vigorous PA, and total PA were fairly related to the Ex of the pedometer, with Spearman's ρ of 0.36, 0.38, and 0.32, respectively. After adjusting for gender, age, BMI, education attainment and employment status, walking, vigorous and total PA showed only a moderate but still significant correlation, with partial r of 0.32, 0.26, and 0.27. Correspondingly, similar correlation results were observed between walking, vigorous exercise, and total PA with the indicator of Walking Distance from the pedometer. Before or after the adjustment, the correlation of IPAQ-L with Walking Distance were always lower than correlations with the Ex.
IPAQ-L (MET-min/week) Spearman's ρ Partial Correlation ra Ex (MET-min/ week) P Walking Distance (km) P Ex (MET-min/ week) P Walking Distance (km) P Walking 0.36 0.001 0.32 0.004 0.32 0.005 0.29 0.013 Moderate PA 0.19 0.091 0.15 0.179 0.04 0.739 0.10 0.391 Vigorous PA 0.38 0.001 0.33 0.003 0.26 0.024 0.29 0.011 Total PA 0.32 0.004 0.31 0.005 0.27 0.020 0.31 0.007 Note.a: Adjusted for gender, age, BMI, education attainment, employment. Table 4. Criterion validity of IPAQ-L using pedometer data as standard (n = 80)
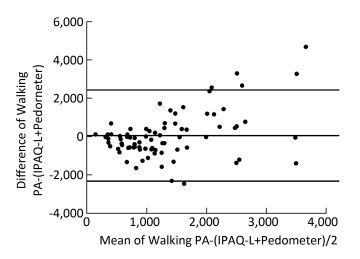
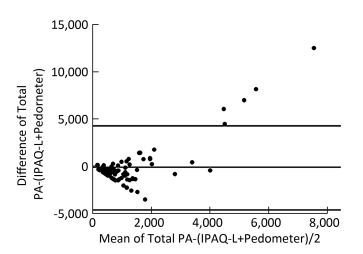
The Bland Altman Plot of IPAQ-L and pedometer Ex indicator for total PA (Figure 1) showed a small mean difference (-91 MET-min/week), but a 95% limit of agreement (-4, 615 to 4, 433 MET-min/week) was enlarged because of the existence of five outliers. When the outliers were removed, the difference in total PA presented a normal distribution with much narrower 95% limits of agreement (-2, 435 to 1, 222 MET-min/week). Figure 2 shows the Bland Altman Plot of walking PA for IPAQ-L and pedometer Ex indicator. The mean difference was small (58 MET-min/week). Similar to Figure 1, the 95% limit of agreement (-2, 319 to 2, 435 MET-min/week) was affected by an outlier. The mean difference was almost near zero (-0.70 MET-min/week), and the 95% limit of agreement was-2, 159 to 2, 157 MET-min/weekafter removing the outlier.
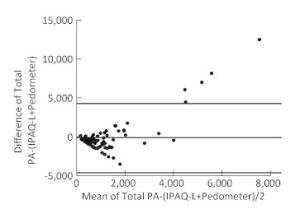
Figure 1. Bland-Altman Plot comparing total physical activity between the second IPAQ-L survey and pedometer Ex indicator (MET-min/week)
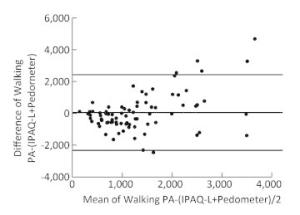
Figure 2. Bland-Altman Plot comparing walking physical activity between the second IPAQ-L survey and pedometer Ex indicator (MET-min/week)
Descriptive Results
Test-retest Reliability of IPAQ-L
Criterion Validity of IPAQ-L
-
The present study examined the test-retest reliability and criterion validity of a Simplified Chinese-character version of IPAQ-L in a general population in the city of Hangzhou. At least a moderate level of reliability was observed in different dimensions and intensities of physical activity. Subjects aged < 40 years showed higher reliability in walking and moderate PA but lower reliability in vigorous PA than subjects aged ≥ 40 years. A minimal to moderate correlation was found between IPAQ-L and pedometer data. IPAQ-L had a higher correlation coefficient with Ex than with Walking Distance.
Some previous IPAQ studies reported reliability coefficients greater than 0.70, with ICCs of 0.97 in Hong Kong adults[10], 0.82 in Spanish[17], and 0.92 in Malaysia[18] and a Spearman's ρ coefficient of 0.70 to 0.91 in the 12-country study[19]. In the present study, most of the reliability coefficients were at least beyond moderate level, with the lowest ICC for leisure time PA among the four dimensions and vigorous PA among the three intensities. Leisure time and vigorous intensity PA usually occur less often and could vary across weeks for reasons such as weather, working schedule and so on, which may result in reduced test-retest reliability. Relatively lower reliability of leisure time and vigorous intensity PA were also found in other IPAQ studies[9]. However, studying a specific group of people could generate higher reliability coefficients than surveying a general population. Studies among university students (who tend to have a limited range of daily physical activity and relatively scheduled lifestyle) may result in higher reliability coefficients due to low variability in PA over time[9, 20]. A similar bias might also apply to studies targeting specific gender or age groups[7-8, 21]. Participants, who are mostly male and older than 40 years of age, were more likely to engage in regular daily physical activity, as a personal hobby or as a consequence of more leisure time. Therefore, the repeatability of PA within one or two weeks could be higher in these groups of people than in subjects who were not fond of or less likely to engage in regular PA. A study by Brown also found that for total PA as well as for sub-dimensions, reliability was generally better for men than for women[22].
The cost of double-labelled water technique and indirect calorimetry is often prohibitive for population-based studies[23]. As a result, the most common approaches used in the criterion validity of IPAQ are pedometer, accelerometer and PA log book. In this study, the IPAQ-L indicated low to moderate validity compared with pedometer data when controlled for demographic variables. This result was similar to the validation study by Deng of IPAQ-L conducted among 224 Chinese older adults, which showed a moderate correlation between total PA and pedometer-measured steps[9]. Many other studies using accelerometer as the criterion reference showed low to moderate correlation with the IPAQ (usually with Spearman's ρ ranging from 0.2 to 0.5), including the 12-country reliability and validity study[19, 24-25]. Higher correlation coefficients were usually found when using a PA log book as a standard criterion. Studies by both Hagstromer and Chu showed at least a moderate level of validity comparison with the PA log book[18, 26].
It was expected that the IPAQ-L would have a higher Spearman's correlation with the indicator Ex than with Walking Distance. This result is because Ex is derived from physical activities that last at least 10 min with an intensity no less than 3 METs, which is in accordance with the descriptions of the IPAQ-L questions. Walking Distance was automatically calculated based on the number of steps recorded by the pedometer, with no prerequisite for intensity and duration. As the pedometer is particularly useful for measuring low to moderate intensity physical activities such as walking but less useful for vigorous-intensity physical activities[14], we performed a partial correlation analysis to clarify the relationship between pedometer indicators and vigorous PA, controlling for walking. After controlling for walking, no significant Spearman's correlation was observed between vigorous physical activities and Ex or Walking Distance. The relation between vigorous PA and pedometer indicators may be confounded by the fact that people who did more work-related walking were more likely to be involved in vigorous work-related physical activities.
The Bland Altman plot for walking and total PA presented very good criterion validity of the IPAQ-L, showing a small mean difference between IPAQ-L and pedometer measurements. However, both the 95% limits of agreement of walking and total PA were inflated by the presence of outliers reported in the IPAQ-L. The outlier phenomenon was also observed in a study by Hagstromer in which 95% limits of agreement were affected by nine outliers[26]. Some studies found that the error between IPAQ and criterion reference tended to be enlarged with increasing PA scores reported in IPAQ and interpreted it as a possible overestimation of PA[27-30]. As the pedometer is particularly useful to measure low to moderate intensity physical activities such as walking, it is also explainable that in this study, the Bland Altman plot of walking behaviour showed better results than total PA with fewer number of outliers, a mean difference closer to zero and narrower 95% limits of agreement.
These results lend qualified support to the use of IPAQ-L to measure various dimensions or intensities of physical activities, yet limitations may exist in the current study. An example is the use of the pedometer as the criterion reference. We could only present total scores of physical activities (Ex and Walking Distance), which is less useful in comparing specific dimensions or intensities of physical activities reported by the IPAQ-L. Because of cost constraints, we did not use an accelerometer, which is regarded as a better gold standard with its capability of measuring the frequency, duration and especially, the intensity of an activity[14, 31]. However, studies have shown that the pedometer, with its good reliability and validity[32-33], could substitute for an accelerometer by showing a strong correlation between the two measures[34-35]. Second, the 168 residents were not randomly sampled from the lists of community households, but efforts were made to ensure the representativeness of a general population of Hangzhou (from three administrative planning units and equally distributed in sex and seven age groups). Last, the present study conducted in one well-developed city in China, where residents may have specific characteristics of their SES, lifestyle and PA pattern under such a stage of economic development. These results may be only suitable for urban adult populations in developed Chinese cities, yet it holds good practical meaning with its application in a general population.
-
This was the first study reporting the reliability and validity of the Simplified Chinese-character version of IPAQ-L conducted in a general adult population in Hangzhou, China. Our results indicated that IPAQ-L is a reliable and validated measure for assessing PA levels in this population and possibly the adult population in other mainland Chinese cities.

 Quick Links
 DownLoad: