


HTML
-
Iodine is an essential trace element used by the thyroid gland to produce thyroid hormones required for normal growth and development[1]. Both iodine deficiency and excess intake may lead to thyroid dysfunction or disease. Iodine deficiency has widespread implications, which include cretinism, endemic goiter, intellectual impairments, increased pregnancy loss and infant mortality[2]. With respect to iodine levels, China features unique geological conditions: 9 provinces that encompass 299 towns have drinking-water containing high levels of iodine, and goiters are prevalent in these areas[3], and there are still iodine deficient areas along the coast due to low coverage of iodized table salt. We previously conducted a cross-sectional study and demonstrated that iodine deficiency and excess coexist in China, and both conditions can cause thyroid disease or thyroid dysfunction[4]. Therefore, it is important to monitor the iodine nutrition status of the population in iodine deficient areas and excess iodine areas resulting from high iodine concentrations in drinking-water with sensitive biomarkers.
Traditionally, the urinary iodine concentration (UIC), goiter (thyroid enlargement) rate, and serum thyroid-stimulating hormone (TSH) values have been recommended measures as sensitive indicators to assess the iodine nutrition status in the population, and thyroglobulin (Tg) has been recommended as a sensitive indicator of iodine deficiency[5]. Because spot urine specimens are easy to obtain, the UIC is the most practical biochemical marker of iodine nutrition among these indicators. However, iodine is quickly metabolized in the body, and the UIC only assesses iodine intake over the past few days. In our previous study, we found that the spot urine iodine concentration was unstable over 3 consecutive days[6]. With respect to indicators of thyroid size, ultrasound is a more precise measurement of thyroid volume than palpation, but ultrasound requires specially trained operators, and the thyroid size responds slowly to changes in iodine intake. Thus, the thyroid size reflects a population's history of iodine nutrition but not its present iodine status[7]. The TSH is usually used to screen newborns, when iodine deficiency directly affects brain development, but it is seldom used to assess iodine nutrition in the entire population[8]. Moreover, Tg plays an important role in the synthesis of the thyroid hormones triiodothyronine (T3) and tetraiodothyronine (T4). Tg is a glycoprotein consisting of two 330 kD protein chains synthesized in the thyrocyte[9-10]. Tg can reportedly be stored for several weeks at room temperature in a cool and dry environment, which enables sampling in remote areas[11]. Tg can be used to measure thyroid function within several months of iodine repletion. This stability allows it to serve as a potential reliable indicator of iodine intake[5]. Previous studies have established an inverse association between the serum Tg and iodine intake in the iodine-deficient population and suggested that the serum Tg could serve as a sensitive biomarker of iodine deficiency[12-15]. Moreover, a fixed cut-off value for Tg to indicate iodine deficiency (ID) has been proposed, and this value was mainly based on data from school children obtained using dried blood spot samples[16]. In most published studies, the Tg of school children has been used as a biomarker to monitor the iodine-deficient population[17-20]. However, studies focusing on the Tg level in adults with excess iodine uptake are scarce. In the present study, the serum Tg level, thyroid enlargement and thyroid nodule as well as other possible factors influencing the serum Tg were investigated in different iodine intake areas with the aim of illuminating which factors determine the serum Tg level and confirming the hypothesis that serum Tg could be a sensitive biomarker of iodine nutrition status in adults.
-
Research approval was obtained from the Ethics Committee of Harbin Medical University. The study was performed in accordance with the Declaration of Helsinki. Written informed consent was obtained from all participants prior to the survey.
-
According to the national iodine deficiency disorders (IDD) surveillance data and water iodine surveillance data, three populations with differing iodine nutrition levels were selected in three provinces for this study. Two villages in Qingxu County and one village in the Xiaodian District of Shanxi Province were selected as areas in which residents consume water containing high levels of iodine. Five villages in Shanyin County and one village in the Xiaodian District of Shanxi Province were selected as areas where residents have sufficient iodine nutrition. Tieshangang District in Beihai City of the Guangxi Autonomous Region was selected as a coastal area with low coverage rates of iodized salt (24.29%[4]); this area is considered iodine deficient. All participants who were Han Chinese, had lived in the region for more than 10 years and were older than 18 years were eligible for recruitment. Subjects taking anti-thyroid drugs during the time of this study were excluded.
-
Non-fasting spot urine samples were collected between 7:00 a.m. and 10:00 a.m. Urine samples were collected in clean plastic tubes from each participant and stored at -20 ℃. The urinary iodine concentration was determined using the acid digestion method (As3+-Ce4+catalytic spectrophoto-metry[21]). The internal quality control samples for the urine iodine and water iodine levels were provided by the National Iodine Deficiency Disorders Reference Laboratory. The serum thyroid-stimulating hormone (TSH), free triiodothyronine (FT3), free tetraiodothyronine (FT4), thyroid peroxidase antibody (TPOAb) and thyroglobulin antibody (TGAb) were tested using a chemiluminescent immunoassay (fluorometric magnetic beads enzyme immunoassay, TOSOH Corporation, Japan). The reference ranges for the different parameters were TSH, 0.38-5.57 mIU/L; FT4, 10.06-23.99 pmol/L; FT3, 2.77-5.85 pmol/L; TPOAb, 0-2.6 IU/mL; and TgAb, 0-14.58 IU/mL. The Tg level was measured with a chemiluminescent immunoassay (Roche Diagnostic GmbH, Germany); the normal range of the Tg reference is 3.5-77 μg/L. This method has been standardized against CRM (Certified Reference Material) 457 of the BCR (Community Bureau of Reference) of the European Union.
-
Thyroid ultrasonography was performed by an experienced examiner using a 7.5-MHz transducer. The thyroid lobe volume was obtained by measuring the depth (d), width (w) and length (l) of each lobe and calculating the volume with the following formula: V (mL) = 0.479 × d × w × 1 (mm)/1000. The thyroid volume was recorded as the sum of both lobes. Thyroid enlargement was defined as a total thyroid volume > 18 mL for women and > 25 mL for men[22]. Thyroid nodules > 3 mm were registered, and multiple nodules were defined as ≥ 2 thyroid nodules.
-
A standard questionnaire was designed to obtain demographic information, including the name, gender, nationality, age, education level, personal or family history of thyroid disease, smoking and drinking habits, source of drinking water and drinking duration. The investigation was performed face to face in the subject's native dialect by well-trained staff. Weight and height were measured in kilograms and centimeters, respectively, and the body mass index (BMI) was calculated by dividing the weight (kilograms) by the square of the height (meters2).
-
In addition, drinking water was collected from villages in which the iodine content in the water was high. Because the water supplies were centralized for three villages, one water sample was collected from each village. Each water sample was kept in a 15 mL centrifuge tube at 4 ℃ until analysis. The iodine concentration of the drinking water was determined by arsenic–cerium catalytic spectrophotometry[23].
-
The diagnostic criteria for thyroid diseases are given in our previously published article[4].
-
All data processing and statistical analyses were conducted with the IBM SPSS software (version 19), and figures were generated in Graph Pad. Prismv5.0. The Kolmogorov-Smirnov test was used to test normality. Comparisons were made with ANOVA and t test for normal and continuous variables, nonparametric rank test (Kruskal-Wallis) for nonnormal and continuous variables. Comparisons of the proportions among the three groups were performed by the chi-square test or Fisher's exact test (α = 0.05); if the null hypothesis was rejected, pairwise comparisons were performed (α = 0.0125). Normally distributed data are expressed as the mean ± SD; abnormally distributed data are described as the median with the 25th and 75th percentiles. A multivariate linear regression model was used to estimate the strength of the association of the different factors with the serum Tg. Prior to conducting multivariate analyses, a univariate analysis was used to identify factors significantly related to the serum Tg. Because the residuals for Tg was not normally distributed, but showed log normal distribution, logarithmic transformation was used before the linear model analyses. The dependent variables entered into the multivariate linear regression model were gender, age, smoking status, BMI, drinking habit, iodine status, thyroid enlargement, thyroid nodule, TgAb positivity, and TPOAb positivity. A two-sided P < 0.05 was considered significant.
Ethics
Study Regions and Subjects
Urine Sample and Blood Sample Collection and Analysis
Thyroid Ultrasonography
Questionnaire and Physical Examination
Drinking Water Collection and Analysis
Diagnostic Criteria for Thyroid Diseases
Statistical Analysis
-
A total of 600 adults were recruited for this study. After excluded 27 participants (omitting thyroid hormones value or without thyroid ultrasound exam), the effective samples consisted of 190, 190, and 193 individuals in the iodine excess, more-than-adequate iodine, and deficient iodine groups, respectively. The median urinary iodine (MUI) levels of the three groups were 991.42 μg/L, 241.29 μg/L, and 55.48 μg/L. The following iodine nutrition criteria are provided by the WHO[5]: deficient, MUI < 100 μg/L; adequate, 100 μg/L ≤ MUI ≤ 199 μg/L; more than adequate, 200 μg/L ≤ MUI ≤ 299 μg/L; excess, ≥ 300 μg/L. The cohort was divided into iodine excess, iodine more than adequate and iodine deficient iodine nutrition groups according to these criteria, as shown in Table 1. The median iodine concentration of the drinking water ranged from 460.20 μg/L to 629.90 μg/L for the three high-iodine water villages. The demographic characteristics of the participants are presented in Table 2. The age, gender and BMI index significantly differed among the three groups (P < 0.01).
Iodine Status Sample Size Urinary Median
(Interquartile) (μg/L)Tg Median
(Interquartile) (μg/L)Tg > 77 μg/L
N(%)Iodine excess group 190 991.42 (666.58, 1428.08) 22.27 (9.28-43.79)# 24 (12.63)△ Iodine more than adequate group 190 241.29 (159.30, 337.76) 9.73 (5.20-20.25)*# 4 (2.11)△★ Iodine deficient group 193 55.48 (35.19, 91.82) 15.77 (9.38-25.88)* 8 (4.15)★ Note. #Kruskal-Wallis test, P < 0.001;*Kruskal-Wallis test, P = 0.001; △χ2= 15.422, P < 0.001; ★χ2= 1.313, P = 0.252. Table 1. The Tg Level in Different Iodine Status Groups
Characteristics Iodine Excess Group (n) Iodine More than Adequate Group (n) Iodine Deficient Group (n) P Value Participants number 190 190 193 Gender Male 130 62 43 < 0.001 Female 60 128 150 Age (years) Mean ± SD 53.91 ± 13.27 56.65 ± 11.86 52.8 ± 14.76 0.009 ≤ 40 45 35 66 0.008 41-60 84 88 67 61- 61 67 60 BMI (kg/m2) 24.1 ± 3.26 25.58 ± 3.72 23.16 ± 4.05 < 0.001 Education level※ Illiteracy 15 32 20 < 0.001 Primary school 93 82 55 Junior high school 66 57 63 Senior high school 13 10 31 College 3 2 24 Smoking★ None 165 156 184 < 0.001 1-10 8 12 0 11-20 5 1 7 > 20 9 19 2 Alcohol consumption△ None 161 169 178 0.536 Light 12 10 9 Heavy 12 9 6 Note. ★missing 5, △missing 7, ※missing 7. Table 2. The Demographic Characteristics of the Participants
-
The serum Tg levels among excessive, more than adequate, and deficient iodine group were significantly different [22.27 (9.28-43.79) μg/L, 9.73 (5.20-20.25) μg/L, and 15.77 (9.38-25.88) μg/L, respectively], P < 0.001. Specifically, compared with that of the more than adequate iodine group, the median serum Tg levels of both iodine excessive and deficient groups were significantly higher (P < 0.01), as shown in Table 1. Figure 1 illustrates that the Tg levels differ among populations with differing iodine nutrition.
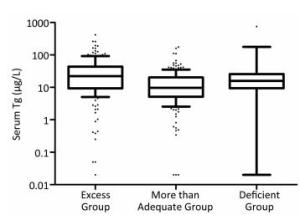
Figure 1. Box plot showing the the distribution of Tg levels of the three iodine status groups. Box plot explanation: upper horizontal line of box, 75th percentile; lower horizontal line of box, 25th percentile; horizontal bar within box, median; upper horizontal bar outside box, 90th percentile; lower horizontal bar outside box, 10th percentile.
The proportions of subjects with a Tg level exceeding 77 μg/L were 12.63%, 2.11%, and 4.15% in the iodine excess, more-than-adequate and deficient groups, respectively. These differences were significant among all three groups (χ2= 20.136, P < 0.001), between the iodine excess and iodine more-than-adequate groups (χ2= 15.422, P < 0.001), and between the iodine excess and the iodine-deficient groups (χ2= 9.006, P = 0.003), but not between the iodine-deficient and the iodine more-than-adequate groups (χ2= 1.313, P = 0.252).
-
The prevalence of hypothyroidism (overt hypothyroidism and subclinical hypothyroidism) was 45.71%, 11.52%, and 13.61% for the Tg-above-77-μg/L group, Tg-below-77-μg/L group and the total population, respectively. This prevalence significantly differed between the Tg-above-77-μg/L and the Tg-below-77-μg/L groups (Fisher' s exact test, P < 0.001). The prevalence of thyroid nodules was 42.86%, 18.22%, and 19.72% in the Tg-above-77-μg/L group, Tg-below-77-μg/L group and the total population, respectively. This prevalence significantly differed between the Tg-above-77-μg/L group and Tg-below-77-μg/L group (χ2= 12.604, P < 0.001). The prevalence of thyroid enlargement was 11.43%, 2.23%, and 2.79% in the Tg-above-77-μg/L group, Tg-below-77-μg/L group and the total population, respectively. This prevalence did not significantly differ between the Tg-above-77-μg/L group and the Tg-below-77-μg/L group (Fisher's exact test, P = 0.013 > 0.0125), as shown in Table 3.
Thyroid Disease Tg > 77 μg/L
n(%)
(n = 35)Tg ≤ 77 μg/L
n(%)
(n = 538)Total
(n = 573)Hypothyroidism* 16 (45.71)△ 62 (11.52)△ 78 (13.61) Hyperthyroidism# 0 7 (1.3) 7 (1.22) Thyroid nodule★ 15 (42.86)※ 98 (18.22)※ 113 (19.72) Thyroid enlargement 4 (11.43) & 12 (2.23) & 16 (2.79) Note. *Including subclinical hypothyroidism and overt hypothyroidism. #Including subclinical hyperthyroidism and overt hyperthyroidism. ★Including single thyroid nodule and multiple thyroid nodules. △Fisher's exact test, P < 0.001; ※χ2= 12.604, P < 0.001; & Fisher's exact test, P = 0.013 > 0.0125. Table 3. The Thyroid Disease Prevalence in Different Tg Level Groups
-
The serum Tg levels were significantly higher in subjects with nodules [21.06 (12.04-42.54) μg/L than in subjects without nodules 13.95 (6.87-25.04) μg/L], in subjects with TPOAb negativity [16.21 (8.90-28.24) μg/L than in subjects with TPOAb positivity 6.2 (1.57-26.33) μg/L], in subjects with TgAb negativity [16.34 (9.12-29.87) μg/L than in subjects with TgAb positivity 5.71 (1.50-21.84) μg/L], and in subjects with goiters [20.13 (12.40-81.55) μg/L than in subjects without goiters 15.31 (7.48-27.57) μg/L]. A Spearman rank correlation analysis indicated that the effects of smoking and alcohol consumption habit on serum Tg level were not statistically substantial (Table 4).
Factors N Tg Log (Tg) P* Median (Interquartile Range) μg/L Mean ± SD Gender Male 165 14.73 (7.72-27.45) 1.209 ± 0.451 0.746 Female 408 15.62 (7.68-29.86) 1.195 ± 0.479 Thyroid enlargement Yes 16 20.13 (12.40-81.55) 1.438 ± 0.555 0.040 No 557 15.31 (7.48-27.57) 1.192 ± 0.467 Nodule Yes 113 21.06 (12.04-42.54) 1.368 ± 0.45 < 0.001 No 460 13.95 (6.87-25.04) 1.158 ± 0.467 TPOAb Positive 94 6.20 (1.57-26.33) 0.932 ± 0.623 < 0.001 Negative 479 16.21 (8.90-28.24) 1.251 ± 0.415 TgAb Positive 111 5.71 (1.50-21.84) 0.877 ± 0.575 < 0.001 Negative 462 16.34 (9.12-29.87) 1.278 ± 0.406 Spearman correlation (r) Smoking 568 -0.061 0.143 Drinking 566 -0.039 0.354 Age 573 0.008 0.857 Note. The P value are the results of t test or spearman correlation. Table 4. Univariate Analysis of Other Factors Except for Iodine Intake in Relation to Serum Tg
-
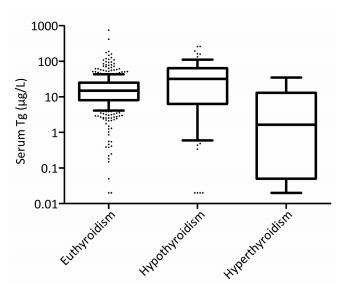
The serum Tg level was significantly higher (P = 0.005) in subjects with hypothyroidism [32.18 (6.36-63.83) μg/L] than that in subjects with euthyroidism [14.84 (8.05-25.32)], and the serum Tg level of subjects with euthyroidism was higher (P = 0.039) than that of subjects with hyperthyroidism [1.66 (0.05-12.96) μg/L], as shown in Figure 2.

Figure 2. Box plot of serum Tg levels derived from euthyroidism, hypothyroidism and hyperthyroidism populations. Box plot explanation: upper horizontal line of box, 75th percentile; lower horizontal line of box, 25th percentile; horizontal bar within box, median; upper horizontal bar outside box, 90th percentile; lower horizontal bar outside box, 10th percentile.
-
The results of a multivariate linear regression model analysis demonstrated that the iodine nutrition status significantly affected the serum Tg level. The serum Tg levels were significantly higher in the iodine excess group (β = 0.262, P < 0.001) and in the iodine deficient group (β = 0.115, P = 0.014) than in the iodine more-than-adequate group. In addition, some factors were directly related to the serum Tg level; after adjusting for gender, age and BMI, thyroid enlargement (β = 0.227, P = 0.047), thyroid nodule (β = 0.112, P = 0.017), hypothyroidism (β = 0.172, P = 0.002) and TgAb positivity (β = -0.361, P < 0.001) were significantly related to the serum Tg level, as shown in Table 5.
Variables β 95% CI P Male vs. Female -0.029 -0.107-0.049 0.462 Age (Year) 0.002 -0.001-0.004 0.21 BMI (kg/m2) -0.004 -0.014-0.005 0.376 TPOAb positivity vs. TPOAb negativity -0.104 -0.223-0.015 0.086 TgAb positivity vs. TgAb negativity -0.361 -0.47-0.251 < 0.001 Nodule vs. Without nodule 0.112 0.02-0.203 0.017 Thyroid enlargement vs. Without thyroid enlargement 0.227 0.003-0.451 0.047 Excess group vs. More than adequate group 0.262 0.176-0.349 < 0.001 Deficient group vs. More than adequate group 0.115 0.024-0.207 0.014 Hypothyroidism* vs. Without hypothyroidism 0.172 0.064-0.281 0.002 Hyperthyroidism#vs. Without hyperthyroidism -0.121 -0.454-0.212 0.476 Note. *TSH > 5.57 mIU/L, #TSH < 0.38 mIU/L. Table 5. The Multiple Linear Regression Analysis for Clarifying the Determinant Factors of Log (Tg) Level
Subject Characteristics in the Three Iodine Status Populations
Serum Tg Levels and Subject Characteristics in the Three Iodine Intake Populations
The Thyroid Diseases of Different Tg Level Groups
Univariate Analysis of Factors in Relation to Serum Tg Levels
Thyroid Function Abnormal in Relation to Serum Tg Level
Multivariate Analysis of Determinant Factors Related to Serum Tg Level
-
The serum Tg level is a tumor biomarker used to monitor patients with differentiated thyroid carcinoma during follow up after surgery[24], and the Tg level is recommended by the WHO and UNICEF as a sensitive biomarker of iodine deficiency[5]. Universal salt iodization (USI) has been mandatory in China as an effective strategy to prevent IDD for over twenty years. To date, IDD has been primarily controlled in China, and the iodine status of the population in some areas of China is more than adequate. Currently, the harm done by high level of iodine in drinking water is one of the most urgent public health problems in China. People living in areas with high iodine levels in the water are more likely to develop thyroid disease, such as autoimmune thyroid disease, hypothyroidism, and thyroid nodule[4, 25]. Our organization is charged with the surveillance of iodine nutrition status throughout the nation, which requires a sensitive indicator of the iodine nutrition status.
In this comparative study of unselected subjects from three populations differing in iodine nutrition status, the serum Tg was significantly associated with several factors in a simple model (as shown in Table 4). Significant associations were also found in the multivariate model. We found that multiple factors were related to the serum Tg level. Excess and deficient iodine intake are direct extra environmental factors influencing the serum Tg level, both iodine excess and deficiency are significantly related to higher serum Tg level. Except for the iodine intake, the results of multivariate linear regression models indicated that the serum Tg level was mediated by other factors. Thyroid nodule, thyroid enlargement, hypothyroidism were significantly related to higher serum Tg level. We also found that TgAb positivity predicted a lower serum Tg level, which corroborates previous studies[26-27]. In our previous study, we elucidated that excess iodine intake may cause a high prevalence of hypothyroidism and thyroid nodules, and the TSH value positively correlated with the median urinary iodine concentration[4]. In this study, we found that hypothyroidism affected the Tg level. Specifically, abnormally high TSH levels significantly correlated with the serum Tg level because hypothyroidism was defined as a TSH value > 5.57 mIU/L in this study. The results of the present study indicated that the Tg level was sensitive to abnormally high TSH values. The correlation between the serum TSH and serum Tg levels was confirmed in severely iodine-deficient areas[28], and the Tg level has been proven to be more sensitive than the TSH as an indicator of iodine deficiency[29]. Abnormally high TSH levels substantially affect the serum Tg level, as reported by Krejbjerg[12], which corroborates the results of the present study. Thyroid enlargement has been well established to be related to the serum Tg level, and the results of the present study corroborate previous studies[13, 30-31]. Moreover, thyroid nodules are associated with increasing serum Tg levels in the adult population, and our study results corroborates these findings[12-13]. Our results indicated that the iodine nutrition status played an important role in the serum Tg level, the median Tg of iodine excess group and deficient group are higher than that in more than adequate group, which make it feasible to work as a biomarker of iodine nutrition status. This finding was similar with Zimmermann's study, in which a U-shaped curve was observed from deficient to excessive iodine intake as assessed by median urinary iodine concentration in school-aged children from 12 countries[16]. The results of this study indicated that the prevalences of thyroid diseases (including hypothyroidism and thyroid nodule) of the high-Tg group (Tg > 77 μg/L) were higher than that of the low-Tg group (Tg ≤ 77 μg/L). This finding indicates that a high Tg level correlates with thyroid disease and that the Tg level may be a sensitive indicator for predicting thyroid disease.
The strength of this study is that it is a comparative study examining the serum Tg level in areas that differ by iodine nutrition (including iodine deficiency, iodine more than adequate and iodine excess) over the same period. Most published studies have evaluated iodine-deficient populations by comparing the serum Tg of the population in different historical periods, such as a study conducted in Denmark[12]. Nevertheless, the present study was also subject to limitations. First, the sample size of populations differing by iodine intake in this study was small, which may have reduced the statistical power. Moreover, the iodine-deficient area selected in this study exhibits mild iodine deficiency (the median urinary level of the population was 55.48 μg/L). Additionally, the three groups differed in age and gender, which may have resulted in bias. We performed a multivariable regression to exclude potential confounding factors. Additional large-scale studies are needed in the future to identify the specific median cut-off value. The results of this study contribute to the development of a strategy for the future surveillance of iodine nutrition status in China.
-
In summary, the serum Tg level is a sensitive marker of evaluating iodine nutrition status in the adult population. The serum Tg serum level is affected by thyroid disease and thyroid dysfunction, and these conditions should be taken into consideration when assessing the iodine status of the population.
-
We express our thanks to all the organizations that participated in this survey: the provincial (municipality) Centers for Disease Control (CDC) and the Centers for Endemic Disease Control in Shanxi and Guangxi, and the residents of Shanyin County, Qingxu County, Xiaodian District and Tieshangang District who participated in this survey.
-
DU Yang: analyzed the data and wrote the manuscript; GAO Yan Hui: helped in data analysis with constructive suggestions; MENG Fan Gang performed the ultrasound; FENG Zhuo Ying and FAN Li Jun: contributed to data analysis and manuscript preparation; SUN Dian Jun: conceived and designed the experiments.

 Quick Links
 DownLoad: