


-
Malnutrition or nutritional risk is often found in elderly inpatients[1-2], primarily due to aging, effects of diseases and drugs, and inadequate dietary intake. Malnutrition or nutritional risk is associated with poor clinical outcomes, longer hospitalizations, a higher likelihood of hospital readmission, higher rates of mortality, and greater hospital expenditures[3-6]. Many nutritional screening or assessment tools are used in hospitals in order to recognize these patients as early as possible, facilitate earlier nutritional intervention, and improve health outcomes. The Nutritional Risk Screening (NRS 2002)[7] has been successfully implemented throughout Europe and is recommended for nutritional risk screening of hospitalized patients in China. The Subjective Global Assessment (SGA)[8] is widely used in nutritional assessment and has been recommended as the outcome measure in clinical trials[9-10]. The SGA score can predict health outcomes in elderly hospitalized patients[11]. NRS 2002 is used to identify nutritional risk, whereas SGA detects malnutrition, which is the greatest distinction between the two. They are similar because they both consider the metabolic stress of disease and changes in food intake, although NRS 2002 classifies metabolic stress using numerical scores, whereas SGA depends on the investigatora's experience to indicate the metabolic stress of disease[12]. SGA has questions related to the detection of chronic malnutrition; in contrast, NRS 2002 contains questions that indicate a more recent or acute change in nutritional status[13]. These assessment tools are closely related to body weight, particularly, the circumstances surrounding weight that can be determined in an accurate physical assessment conducted by trained staff. It is difficult to carry out such an assessment on every patient, as there are many hospitalized patients in China. Although malnutrition and nutritional risk cannot be assessed using a single parameter, the search is on for an indicator that is a simple and rapid measurement and can increase the accuracy of nutritional evaluation tools.
Patients with malnutrition or nutritional risk have lower hand grip strength (HGS). The potential explanation for this is that malnutrition can reduce protein synthesis, cause muscle fiber atrophy, and reduce muscle mass, further leading to decreased muscle function. Some studies hypothesized that the pathogenesis of impaired muscle function in malnutrition involves reduction of glycolytic enzyme[14-15], creatine[16], and mitochondrial complex activities[17], leading to reductions in muscle glycolysis, phosphocreatine, and oxidative phosphorylation, respectively. Additionally, muscle protein stores have been found to respond rapidly to restoration of nutrition[18]. Together, these mechanisms account for the ability of HGS to predict nutritional status. HGS, a commonly used tool for the assessment of muscle function, has been regarded as an indicator of nutritional status in recent reports[18-19]. HGS can also independently predict nutritional status and changes in nutritional status defined by the Patient-Generated Subjective Global Assessment (PG-SGA) score and category[19]. In addition, HGS may be useful for forecasting prognosis in patients with congestive heart failure[20]. HGS is a rapid, cost-effective nutrition assessment tool; to the best of our knowledge, there is no evaluation standard, and there are no cut-points for malnutrition or nutritional risk in elderly inpatients in China.
The present study aims to assess the nutritional status and the application of HGS in nutrition assessment of elderly inpatients at hospital admission. We anticipate that HGS will show a significant correlation with NRS 2002 and SGA scores and that a combination of the two can be used as an accurate predictor of nutrition status.
HTML
-
The study protocol was reviewed and approved by the Institutional Review Board of Chinese PLA General Hospital. All procedures in this study were conducted in accordance with the Helsinki Declaration, and subjects gave written informed consent.
In this cross-sectional study, a total number of 1, 343 patients (691 men and 652 women) between the ages of 65 and 90 years, with a mean age of 73.8 years (SD = 5.9), receiving medical care at internal medicine of Chinese PLA General Hospital were included. Data were obtained by accredited practicing dietitians via interviews and clinical screening between May 2014 and December 2015. Briefly, the inclusion criteria were participants who were between 65 and 90 years of age, were admitted for 24 h to the internal medicine wards, and could be measured for handgrip strength. Those who had injury, malformation, or severe rheumatoid arthritis in both hands; pregnant women; and critically ill or unconscious patients were excluded.
-
Body weight and height were recorded to the nearest 0.1 kg and 0.1 cm. Body mass index (BMI) was computed as weight (kg) divided by height (m) squared. Waist circumference (WC) was measured to the nearest 0.1 cm at the umbilical level horizontally in a standing position, and calf circumference (CC) was measured to the nearest 0.1 cm at the thickest point in a relaxed and standing position.
Clinical data including age, gender, hospital department, and diagnosis were collected by nurses at hospital admission. Following admission, fasting blood samples were taken from each patient for laboratory assays including serum levels of albumin (ALB), total protein (TP), creatinine (Cr), triglycerides (TG), total cholesterol (TC), hemoglobin (Hb), blood urea nitrogen, and C-reactive protein (CRP).
-
Patientsa' nutrition risk was assessed by using the NRS 2002[7], including initial screening, which consists of four questions as a pre-screening, and final screening, which consists of three aspects: impaired nutritional status, severity of disease, and age. Nutritional assessments were categorized as at nutritional risk (NRS 2002 score ≥ 3) or no nutritional risk (NRS 2002 score < 3).
Nutritional status was determined by using SGA, which was carried out as proposed by Detsky et al.[21]. The following parameters were assessed: body weight change in the previous 6 months and in the last 15 days; nutritional history including appetite, dietary intake, and gastrointestinal symptoms; gastrointestinal derangements including diarrhea, vomiting, and nausea; functional physical capacity; and physical assessment of fat loss, edema, muscle wasting, and ascites. Patients were classified as a'well nourisheda' (SGA A) or a'malnourished or at risk of malnutritiona' (SGA B or C).
-
HGS was measured using a Jamar dynamometer (Sammons Preston, USA) according to a previously described method[22]. The Jamar dynamometer has a range of 1-90 kg and an accuracy of 0.1 kg. The arm was positioned at the side of the body and the dynanometer held with the elbow flexed at 90°. The patient was asked to squeeze the device as hard as possible for 3 s. The measurement was repeated twice more at intervals of at least 30 s. Three measurements were taken from each of the patienta's hands. For the present analysis, the maximal value of three consecutive measurements was registered in kilogram units. Then, the mean HGS result was calculated, and the HGS of the dominant hand was recorded. The patienta's dominant HGS was used for the assessment.
-
The data were tabulated using Excel 2007, and statistical analyses for all phases of the study were performed using SPSS 18.0 (SPSS Inc., Chicago IL, USA). Quantitative variables of symmetric and asymmetric distributions were described as the mean ± SD or medians and 25th-75th percentile values, while categorical variables were presented as numbers (proportions).
Frequencies were compared using the χ2 test. Means and SD values were compared with the Studenta's t-test. The Mann-Whitney U test was used to compare asymmetrically distributed quantitative variables. A multivariate logistic regression analysis was used to evaluate significant associations between dominant HGS and other variables while adjusting for potential confounding factors, such as age and disease status. As there are large differences in HGS between genders, the analysis was stratified by gender. Finally, if there was a statistically significant independent association between dominant HGS and nutritional status according to NRS 2002 and SGA, ROC curves were generated to determine the optimal cut-off points for dominant HGS by maximizing Youdena's index (sensitivity + specificity -1)[23]. With the identified cut-off points, the sensitivity, specificity, area under the curve (AUC), and 95% confidence intervals (Cls) were calculated. The significance level was set at P < 0.05.
Participants
Anthropometric and Clinical Data Collection
Nutrition Status Assessment
HGS Measurement
Statistical Analysis
-
The characteristics of the 1, 343 patients are shown in Table 1. There was no difference in age between men and women. Respiratory (14.59%), endocrinological (15.26%), neurological (22.93%), gastroenterological (11.39%), and cardiological (25.76%) diseases were common at hospital admission. BMI, WC, CC, and HGS; serum levels of TP, Cr, TG, TC, Hb, and CRP; and the number of internal medicine patients were significantly different between women and men.
Variables Men (n = 691) Women (n = 652) Total (n = 1, 343) P Value Age (years) 74.0 ± 6.1 73.6 ± 5.6 73.8 ± 5.9 0.286 Body Measurement Height (cm) 169.6 ± 5.9 157.5 ± 5.7 163.7 ± 8.3 < 0.001 Weight (kg) 69.2 ± 11.1 61.2 ± 11.6 65.3 ± 12.0 < 0.001 BMI (kg/m2) 24.1 ± 3.7 24.7 ± 4.4 24.3 ± 4.0 0.007 WC (cm) 91.3 ± 10.9 88.9 ± 11.4 90.1 ± 11.2 < 0.001 CC (cm) 34.5 ± 3.6 33.0 ± 3.7 33.8 ± 3.8 < 0.001 Left HGS (kg) 25.1 ± 8.4 15.4 ± 5.8 20.3 ± 8.8 < 0.001 Right HGS (kg) 26.5 ± 8.7 16.6 ± 6.1 21.7 ± 9.0 < 0.001 Optimal HGS (kg) 26.7 ± 8.6 16.6 ± 6.0 21.8 ± 9.0 < 0.001 Mean HGS (kg) 25.8 ± 8.3 15.9 ± 5.8 21.0 ± 8.7 < 0.001 Blood Biochemical Assays ALB (g/L) 38.44 ± 5.12 38.61 ± 5.07 38.52 ± 5.09 0.534 TP (g/L) 64.82 ± 7.23 66.46 ± 7.62 65.64 ± 7.46 < 0.001 BUN (mmol/L) 6.88 ± 5.32 6.67 ± 4.37 6.78 ± 4.88 0.447 Cr (μmol/L) 93.51 ± 55.0 84.81 ± 88.89 89.31 ± 73.42 0.031 TG (mmol/L) 1.29 ± 0.90 1.67 ± 1.88 1.48 ± 1.48 < 0.001 TC (mmol/L) 4.20 ± 2.21 4.73 ± 1.42 4.46 ± 1.89 < 0.001 Hb (g/L) 129.91 ± 21.04 119.52 ± 18.09 124.83 ± 20.32 < 0.001 CRP (mg/dL) -median (P25-P75) 2.1 (0.51-11.81) 2.53 (0.54-9.20) 2.3 (0.51-10.7) 0.675 Patients of internal medicine [n(%)] < 0.001 Respiratory 123 (17.80) 73 (11.20) 196 (14.59) Endocrinology 90 (13.02) 115 (17.64) 205 (15.26) Neurology 183 (26.48) 125 (19.17) 308 (22.93) Gastroenterology 78 (11.29) 75 (11.50) 153 (11.39) Cardiology 166 (24.03) 180 (27.61) 346 (25.76) Nephrology 26 (3.76) 38 (5.83) 64 (4.77) Rheumatology 25 (3.62) 46 (7.06) 71 (5.29) Note. Data are expressed as mean± SD or number (percentage) of subjects. Statistical significance of difference is calculated between men and women subjects. BMI: body mass index; HGS: handgrip strength; WC: waist circumference; CC: calf circumference; ALB: albumin; TP: total protein; Cr: creatinine; TG: triglyceride; TC: total cholesterol; Hb: hemoglobin; BUN: blood urea nitrogen; CRP: C-reactive protein. Table 1. Baseline Characteristics of Study Subjects
-
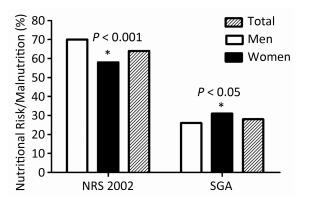
The classification of nutritional status by NRS 2002 showed that 63.81% of the population was at nutritional risk (men 69.75%, women 57.52%), while the classification of nutritional status by SGA showed that 28.22% were malnourished (men 25.57%, women 31.13%). Women were at a lower nutritional risk, but at a higher risk of being malnourished (Figure 1).

Figure 1. The percentage of nutritional risk or malnutrition in elderly inpatients. Data are presented as proportions (%). Statistically significant differences from the man are indicated as *P < 0.05.
-
The left HGS, right HGS, mean HGS, optimal HGS, BMI, WC, and CC and the serum levels of ALB, TG, and Hb of inpatients with malnutrition or nutritional risk were significantly lower than those of well-nourished inpatients, both male and female. However, in women, age and CRP were higher, and the serum level of TP was significantly lower in malnutrition or nutritional risk inpatients than in well-nourished inpatients (Table 2).
Parameters NRS 2002 SGA ≥ 3 < 3 P Value B or C A P Value Men Left HGS (kg) 21.5 ± 8.3* 27.5 ± 7.6 < 0.001 20.1 ± 7.8* 26.7 ± 8.0 < 0.001 Right HGS (kg) 22.6 ± 8.4* 29.1 ± 7.9 < 0.001 21.5 ± 8.3* 28.7 ± 7.9 < 0.001 Mean HGS (kg) 22.0 ± 7.9* 28.3 ± 7.5 < 0.001 20.6 ± 7.7* 27.6 ± 7.7 < 0.001 Optimal HGS (kg) 22.8 ± 8.2* 29.3 ± 7.9 < 0.001 21.1 ± 7.8* 28.4 ± 8.1 < 0.001 Age (year) 75.9 ± 5.6* 72.7 ± 6.0 < 0.001 75.6 ± 6.4* 73.4 ± 5.9 < 0.001 BMI (kg/m2) 22.4 ± 4.0* 25.1 ± 3.0 < 0.001 21.9 ± 3.7* 24.8 ± 3.3 < 0.001 WC (cm) 87.3 ± 11.7* 93.9 ± 9.5 < 0.001 86.1 ± 11.2* 93.1 ± 10.2 < 0.001 CC (cm) 33.3 ± 3.8* 35.4 ± 3.2 < 0.001 32.4 ± 3.7* 35.3 ± 3.3 < 0.001 ALB (g/L) 37.2 ± 4.9* 39.2 ± 5.1 < 0.001 36.2 ± 5.4* 39.2 ± 4.8 < 0.001 TP (g/L) 64.3 ± 7.6 65.2 ± 7.0 0.105 64.1 ± 8.1 65.1 ± 6.9 0.128 TG (mmol/L) 1.09 ± 0.59* 1.42 ± 1.04 < 0.001 1.07 ± 0.56* 1.36 ± 0.98 < 0.001 TC (mmol/L) 4.02 ± 1.04 4.32 ± 2.70 0.094 3.99 ± 1.15 4.27 ± 2.46 0.161 HB (g/L) 125.7 ± 23.2* 132.5 ± 19.1 < 0.001 122.1 ± 23.7* 132.5 ± 19.4 < 0.001 CRP (mg/dL) -median (P25-P75) 2.57 (0.34-21.76) 2.06 (0.56-9.00) 0.514 1.72 (0.67-40.51) 2.10 (0.40-9.94) 0.072 Women Left HGS (kg) 13.1 ± 5.5* 16.9 ± 5.5 < 0.001 12.9 ± 5.4* 16.5 ± 5.6 < 0.001 Right HGS (kg) 14.0 ± 5.5* 18.3 ± 5.8 < 0.001 13.6± 5.6* 17.9 ± 5.8 < 0.001 Mean HGS (kg) 13.5 ± 5.4* 17.5 ± 5.5 < 0.001 13.2 ± 5.6* 17.2 ± 5.5 < 0.001 Optimal HGS (kg) 14.1 ± 5.6* 18.3 ± 5.7 < 0.001 13.6 ± 5.6* 18.0 ± 5.7 < 0.001 Age (year) 75.5 ± 5.5* 72.3 ± 5.4 < 0.001 75.0 ± 6.0* 73.0 ± 5.4 < 0.001 BMI (kg/m2) 22.7 ± 4.5* 26.0 ± 3.9 < 0.001 22.4 ± 4.4* 25.7 ± 4.0 < 0.001 WC (cm) 86.0 ± 12.1* 90.8 ± 10.4 < 0.001 84.9 ± 11.7* 90.6 ± 10.7 < 0.001 CC (cm) 31.6 ± 3.9* 33.9 ± 3.4 < 0.001 31.1 ± 3.9* 33.8 ± 3.3 < 0.001 ALB (g/L) 37.5 ± 5.3* 39.4 ± 4.7 < 0.001 37.3 ± 5.4* 39.2 ± 4.8 < 0.001 TP (g/L) 65.4 ± 7.9* 67.2 ± 7.3 0.003 64.8 ± 8.4* 67.2 ± 7.1 0.002 TG (mmol/L) 1.48 ± 1.38* 1.80 ± 2.14 0.039 1.42 ± 0.87* 1.78 ± 2.17 0.028 TC (mmol/L) 4.74 ± 1.76 4.73 ± 1.15 0.976 4.73 ± 1.94 4.74 ± 1.13 0.949 HB (g/L) 117.0 ± 19.7* 121.1 ± 16.8 0.005 115.7 ± 20.5* 121.2 ± 16.7 0.001 CRP (mg/dL) -median (P25-P75) 3.24 (0.60-13.45)* 1.90 (0.46-7.45) 0.039 3.70 (0.77-13.20)* 2.84 (0.55-8.31) 0.043 Note. Statistical significance of difference is calculated between different nutrition status, *P < 0.05. Table 2. The Comparison HGS, Anthropometry and Blood Biochemical Assays of Different Nutrition Status of Study Subjects
-
The multivariate logistic regression model showed that, in male subjects, according to NRS 2002, the odds ratio (OR) of optimal HGS was 0.93 (95% CI 0.90-0.97, P < 0.001), the age OR was 1.05 (95% CI 1.01-1.10, P = 0.018), and the BMI was 0.83 (95% CI 0.74-0.92, P = 0.001). According to SGA, the optimal HGS was 0.93 (95% CI 0.89-0.96, P < 0.001), the BMI was 0.87 (95% CI 0.77-0.99, P = 0.032), the ALB was 0.85 (95% CI 0.78-0.94, P = 0.001), and the TP was 1.07 (95% CI 1.01-1.13, P = 0.017). For female subjects, according to NRS 2002, the OR of optimal HGS was 0.93 (95% CI 0.89-0.98, P = 0.002), the age was 0.93 (95% CI 0.89-0.98, P = 0.002), and the BMI was 0.80 (95% CI 0.72-0.88, P < 0.001). According to SGA, the OR of optimal HGS was 0.93 (95% CI 0.88-0.98, P = 0.003), the BMI was 0.84 (95% CI 0.76-0.94, P = 0.001), and the CC OR was 0.90 (95% CI 0.82-0.99, P = 0.031). There was no significant difference in any other variable (Table 3).
Variable NRS 2002 SGA Standardized β OR (95% CI) P Value Standardized β OR (95% CI) P Value Men Optimal HGS -0.07 0.93 (0.90-0.97) < 0.001 -0.08 0.93 (0.89-0.96) < 0.001 Age 0.05 1.05 (1.01-1.10) 0.018 0.01 1.01 (0.96-1.06) 0.827 BMI -0.19 0.83 (0.74-0.92) 0.001 -0.14 0.87 (0.77-0.99) 0.032 WC -0.02 0.98 (0.94-1.01) 0.198 -0.01 0.99 (0.96-1.04) 0.786 CC 0.02 1.02 (0.92-1.12) 0.756 -0.10 0.90 (0.81-1.01) 0.086 ALB 0.06 0.94 (0.87-1.02) 0.162 -0.16 0.85 (0.78-0.94) 0.001 TP 0.01 1.01 (0.96-1.06) 0.608 0.07 1.07 (1.01-1.13) 0.017 TC -0.13 0.88 (0.68-1.13) 0.311 -0.18 0.84 (0.63-1.12) 0.236 Hb 0.01 1.01 (0.99-1.03) 0.116 0.01 1.01 (0.99-1.03) 0.314 CRP 0.01 1.01 (1.00-1.01) 0.190 0.01 1.01 (1.00-1.03) 0.140 Women Optimal HGS -0.07 0.93 (0.89-0.98) 0.003 -0.07 0.93 (0.88-0.98) 0.003 Age 0.07 0.93 (0.89-0.98) 0.002 0.03 0.93 (0.88-0.98) 0.157 BMI -0.23 0.80 (0.72-0.88) < 0.001 -0.17 0.84 (0.76-0.94) 0.001 WC 0.01 1.01 (0.98-1.04) 0.452 0.01 1.01 (0.98-1.05) 0.415 CC 0.03 0.97 (0.89-1.06) 0.505 -0.10 0.90 (0.82-0.99) 0.031 ALB -0.05 0.96 (0.89-1.03) 0.221 0.05 0.96 (0.89-1.04) 0.286 TP -0.01 0.99 (0.95-1.04) 0.743 -0.02 0.98 (0.94-1.03) 0.393 TC 0.02 1.03 (0.86-1.23) 0.792 0.05 1.07 (0.89-1.30) 0.476 Hb 0.01 1.01 (0.99-1.02) 0.238 0.00 1.00 (0.99-1.01) 0.902 CRP 0.00 1.00 (0.99-1.01) 0.451 0.00 1.00 (0.99-1.01) 0.771 Note. β: regression coefficient; OR: odds ratios; CI: confidence interval Table 3. Multivariate Logistic Regression Analyses for Malnutrition or Nutrition Risk Stratified by Gender
-
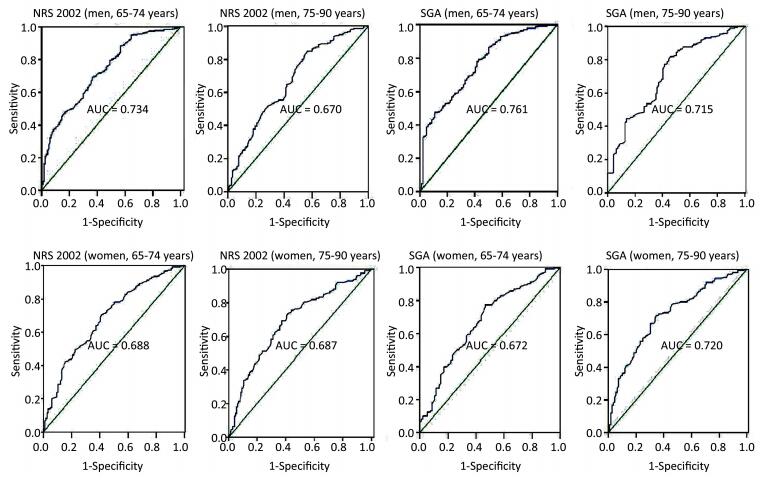
To determine the optimal HGS value to detect nutritional risk and malnutrition in men and women, we calculated the optimal HGS cut-off values by maximizing the Youden Index by sex and age (Table 4 and Figure 2). Based on the ROC curve of NRS 2002, we identified the optimal cut-off points as 27.5 kg (65-74 years) and 21.0 kg (75-90 years) for men and 17.0 kg (65-74 years) and 14.6 kg (75-90 years) for women. Likewise, for SGA, we determined the optimal cut-off points as 24.9 kg (65-74 years) and 20.8 kg (75-90 years) for men and 15.2 kg (65-74 years) and 13.5 kg (75-90 years) for women.
Variable Age (year) AUC SE P 95% CI Cut-point (kg) Sensitivity (%) Specificity (%) Nutritional Risk/Malnutrition, n (%) Men NRS 65-74 0.734 0.027 < 0.001 0.678-0.786 27.5 69.1 63.6 155 (41.11) 2002 75-90 0.670 0.030 < 0.001 0.611-0.729 21.0 83.3 44.8 97 (30.89) SGA 65-74 0.761 0.029 < 0.001 0.703-0.819 24.9 78.0 58.5 113 (29.97) 75-90 0.715 0.032 < 0.001 0.653-0.777 20.8 81.8 54.3 91 (28.98) Women NRS 65-74 0.688 0.029 < 0.001 0.630-0.746 17.0 70.5 58.6 145 (38.46) 2002 75-90 0.687 0.032 < 0.001 0.624-0.750 14.6 69.3 62.8 132 (48.00) SGA 65-74 0.672 0.033 < 0.001 0.608-0.736 15.2 77.4 53.2 114 (30.24) 75-90 0.720 0.031 < 0.001 0.660-0.781 13.5 71.7 65.1 140 (50.91) Note. AUC: area under the curve; SE: standard error; CI: confidence interval. Table 4. Gender-and Age-Specific ROC Curve of the Optimal HGS to Screen Malnutrition or Nutritional Risk on the Basis of SGA and NRS 2002 in Elderly Inpatients
Figure 2. Gender-and age-specific ROC curves for identifying malnutrition or nutrition risk according to different cut-points for optimal HGS. AUC is indicated in the figure. The AUC is significantly different from 0.5, P < 0.05 for all.
Baseline Characteristics of Study Subjects
Nutrition Status Assessment of Study Subjects
Comparison of HGS, Anthropometry, and Blood Biochemical Assays as Different Measures of Nutritional Status
Multiple Logistic Regression Analyses for Malnutrition or Nutrition Risk Stratified by Gender
The Gender-and Age-specific Optimal HGS Cut-off Points for Nutritional Risk or Malnutrition Screening
-
Our study found a strong correlation between HGS and nutritional status in elderly inpatients at hospital admission, in agreement with previous literature[18-19, 24-26]. Our findings also demonstrated that HGS cut-off values can identify a high proportion of elderly inpatients with malnutrition or at nutritional risk and can be used for assessing the nutritional status of elderly inpatients at hospital admission in China.
The prevalence of malnutrition or nutritional risk was greater than 40% among elderly inpatients[1-2, 27]. This study showed a 64% prevalence of nutritional risk and a 28% prevalence of malnourishment in elderly inpatients at hospital admission, and the prevalence of nutritional risk and HGS was lower and that of malnourishment was higher in women than in men. Age and sex were the two most important independent determining factors of HGS[28-29]. HGS decreases with increasing age[30-31], and the rate of loss of HGS was shown to be twice as fast in older groups compared with that in younger groups. Moreover, older women had 43% lower HGS than older men[30, 32]. This study involved elderly inpatients who were assessed by SGA or NRS 2002 to identify malnutrition or nutritional risk. We found that HGS, BMI, WC, and CC and the serum level of ALB, TG, and Hb of inpatients with malnutrition or nutritional risk were significantly lower, and the age was higher than that of well-nourished inpatients, both male and female. However, in women serum levels of TP were significantly lower, and those of CRP were significantly higher. This showed that HGS, like other indicators, was a stronger predictor of nutritional status. We further analyzed the adjusted multivariate logistic regression model and showed that lower HGS was associated with malnutrition or nutritional risk status in patients of both sexes. Similar to other studies, HGS and PG-SGA scores were significantly correlated[19], as was impaired handgrip strength with poor nutritional status (BMI < 18.5 kg/m2)[26]. A systematic review highlighted HGS as a good indicator of nutrition status[18], and HGS is an excellent tool to assess nutrition status at the bedside in patients with cirrhosis. Furthermore, HGS has higher diagnostic accuracy than other anthropometric tests such as mid-arm muscle circumference and triceps skin fold thickness[33].
HGS reflects overall body muscle strength and can indicate nutritional deprivation before a change occurs in body composition[18, 34]. HGS can be a reliable first screening tool for nutritional risk in hospitals[35] and can independently predict nutritional status and changes in nutritional status defined by PG-SGA score and category[19]. A study reported that the overall HGS cut-points for the likelihood of mobility limitation were 37 kg for men and 21 kg for women[36]. Another study reported that only men with low handgrip strength had an increased risk of functional decline at discharge, with a specificity of 91.3% and a cut-off point of 20.65 kg for handgrip strength, whereas women had no significant association between handgrip strength and functional decline[37]. This study reported that the HGS cut-points for the likelihood of nutritional risk were 27.5 kg (65-74 years) and 21.0 kg (75-90 years) for men and 17.0 kg (65-74 years) and 14.6 kg (75-90 years) for women, and the HGS cut-points for the likelihood of malnutrition were 24.9 kg (65-74 years) and 20.8 kg (75-90 years) for men and 15.2 kg (65-74 years) and 13.5 kg (75-90 years) for women. Guerra et al.[23] reported that the cut-off value for men older than 65 years was 30.2 kg when screening undernourished patients classified by PG-SGA. The risk of poor nutrition might be a predictor of lower physical performance. The HGS cut-off value for physical performance was 16.2 kg in elderly female cardiac inpatients[38] and 22.7 kg in elderly post-cardiac surgery patients complicated by diabetes mellitus[39].
There was a high prevalence of malnutrition in cirrhotic outpatients, especially when assessed by HGS, which was superior to SGA and the prognostic nutritional index (PNI)[40]. As stated earlier, elderly inpatients also had a high prevalence of malnutrition or nutritional risk; according to the HGS cut-points, the prevalence of nutritional risk and malnutrition was, respectively, 51.1% and 27.5% for men and 51.2% and 41.4% for women. HGS identified a high proportion of inpatients at nutritional risk, indicating that it was a reliable first screening tool for nutritional risk in elderly inpatients.
Our analysis was based on a large sample size (n = 1, 343) and included male and female inpatients aged more than 65 years from a variety of wards. There are also some limitations to this study. First, there is no consensus on the assessment protocol for HGS[18]. This limits the comparison between our study and others that used different methodologies. Second, there is no gold standard for evaluating elderly patientsa' nutritional status. Our study was based on the SGA and NRS 2002, which can assess malnutrition and screen for nutritional risk, respectively. Third, the lack of HGS data on elderly patients in China also limited comparisons of our study with others. Fourth, the HGS is a simple parameter, which provides valuable information in addition to the assessment of nutritional status. Finally, the study could not clarify the cause-effect association between HGS and malnutrition or nutritional risk, as this was a cross-sectional analysis. Reliable HGS cut-off values remain to be proposed and validated.
In conclusion, elderly inpatients were associated with a greater incidence of malnutrition or nutritional risk. Our research demonstrates that HGS can independently predict nutrition status, as assessed by SGA and screened by NRS 2002. HGS cut-off values for nutritional risk screening at hospital admission were 27.5 kg (65-74 years) and 21.0 kg (75-90 years) for men and 17.0 kg (65-74 years) and 14.6 kg (75-90 years) for women, and the HGS cut-off values for malnutrition assessment were 24.9 kg (65-74 years) and 20.8 kg (75-90 years) for men and 15.2 kg (65-74 years) and 13.5 kg (75-90 years) for women. These HGS cut-off values should be tested in other samples and validated in future studies.
-
No conflict of interest to declare.
-
The authors thank all the workers for their contribution and the participants for their cooperation.

 Quick Links
 DownLoad: