


-
Various natural nutraceuticals have great potential to prevent or treat[1] disorders, and are considered a source of drugs for use in the pharmaceutical industry[2]. For example, a high intake of phenolic-rich foods can lead to a decreased rate of chronic diseases[3].
Based on traditional uses and bioactive compounds, including phenolics and tannins, dietary components may be considered a potential source of clinically relevant antioxidants and/or antibacterial agents[4]. They are also used in folk medicine to treat mutagenicity.
Traditionally used by Tunisians in Ayurvedic medicine, various native plants from Jebel Orbata (Gafsa, Tunisia) are an important botanical source for pharmacological research, primarily due to their chemical composition, including secondary metabolites. As reported by Guesmi et al.[5-7], oily fractions of Thymus algeriensis and Teucrium alopecurus aerial parts have a variety of biological activities, due to their anti-inflammatory, anticancer, antioxidant, antibacterial, and/or anticytotoxic properties. Moreover, some species collected from the same region have therapeutic potential due to their antioxidant and leishmanicidal activities via growth inhibition of the promastigotes of Leishmania infantum and Leishmania major, and cytotoxicity to murine macrophage cell lines[8].
The relative activity of antioxidant compounds can be estimated through the DPPH assay and β-carotene bleaching method. Abstracting hydrogen from a sample by the DPPH radical is marginal, because it occurs very slowly and depends on the hydrogen bond-accepting solvent[9]. The antiradical scavenging ability of plants is attributed to the nature of their components and to the amount of phenolic compounds present.
β-carotene oxidation by linoleic acid is another method of testing whether a bioactive compound has the ability to be an effective free radical scavenger or antioxidant. In the absence of an antioxidant, β-carotene undergoes rapid decolorization, since the free linoleic acid radical attacks β-carotene, which loses its double bonds and, consequently, its orange color[9]. Various hydrophobic fractions obtained from the Lamiaceae family grown in various locations throughout Tunisia were shown to scavenge the linoleic acid peroxide radical, an activity that may be due to chemical composition. Most of these plants are widespread in the northeast, center, and south (Gafsa) regions of Tunisia[10].
As part of our work on characterizing aromatic and medicinal plants that grow spontaneously in Tunisia, we report here the first studies on the chemical composition and the antioxidant, antiproliferative, and antimutagenic effects of acetonitrile/water (ACN/W) and water (W) extracts of various species collected in the mountains of Orbata in the Gafsa province of Tunisia. To evaluate their potential use as alternative or complementary therapeutics, these extracts were tested on the murine macrophage cell line RAW 264.7.
HTML
-
Stock solutions of samples were dissolved in DMSO (purchased from Sigma-Aldrich, St. Louis, MO, USA), stored at -20 ℃, and then diluted as needed in cell culture medium. Penicillin, streptomycin, and RPMI 1640 medium were obtained from Invitrogen (Carlsbad, CA, USA). Phenolic standards gallic acid, catechin, epicatechin, vanillic acid, quercetin, rutin, apigenin, naringenin, coumaric acid, and kaempferol were obtained from Sigma-Aldrich. Reagents used for cell culture and chemicals used for phenolic extraction, MTT assay, and antioxidant activity were obtained from Merck (Nottingham, UK), Sigma-Aldrich, and Fluka Chemie (Buchs, Switzerland). Fetal bovine serum (FBS), penicillin, streptomycin, DMEM/F12, IMDM, and RPMI-640 medium were purchased from Mediatech, Inc. (Herndon, VA, USA). Bovine serum albumin (BSA) was purchased from Atlanta Biologicals (Norcross, GA, USA). MTT, NaCl, glycine, Tris, and sodium dodecyl sulfate (SDS) were purchased from Sigma-Aldrich.
-
The murine macrophage cell lines RAW 264.7 (ATCC, TIB-71) and cancer cell lines (KBM5, U266, SCC4, HCT116, MCF7, and Panc28) were obtained from the American Type Culture Collection (ATCC, Manassas, VA, USA).
-
Bacterial strains: Salmonella enteritidis, Staphylococcus aureus, Salmonella typhi, Pseudomonas aeruginosa, Escherichia coli, Bacillus subtilis, and Bacillus cereus were purchased from ATCC.
-
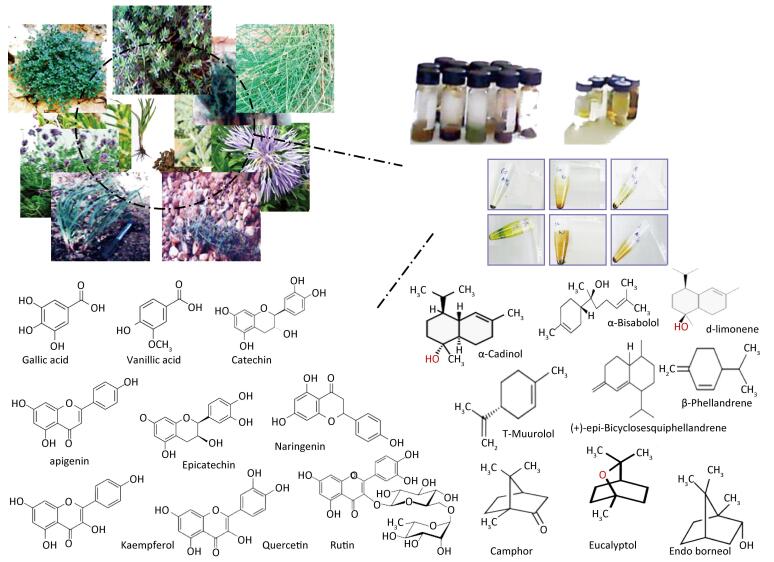
Aerial parts, tuberous roots, and peels of medicinal plants with phenolic compounds, as shown in Table 1 and Figure 1, were collected in the springtime from March to May from 2 locations in Tunisia: 9 species from the southwest (Gafsa) and 3 from the northeast (Zaghouan), with coordinates N 34° 22' 49.8'' and E 9° 3' 23.4''; N 36° 24' and E 10° 09', respectively. Voucher specimens were deposited in the National Institute of Agronomic of Tunisia (INAT) Herbarium in Tunisia.

Table 1. The Collected Plant Parts, Collection Sites, Ethnobotanical Indications, and Percentage Yields of ACN/W and W Extracts

Figure 1. Structure of major phenolic and terpenic compounds isolated from the collected plants.
-
The cell line RAW 264.7 was cultured in RPMI 1640 medium supplemented with 10% heat inactivated fetal calf serum (HyClone Laboratories, Logan, UT, USA), 100 U penicillin, 100 U streptomycin, and 2 mol/L-glutamine. Cultures were maintained in a humid incubator in 5% CO2 at 37 ℃, and the cells were split twice a week[8]. Human head and neck cancer, pancreatic carcinoma, colon cancer cells, and pancreatic carcinoma were cultured in DMEM supplemented with 10% FBS. KBM-5 cells were cultured in IMDM supplemented with 15% FBS, U266 cells were cultured in RPMI-1640 medium with 10% FBS, and MCF-7 cell lines were cultured in DMEM/F12 with 10% FBS and no antibiotics. All culture media were supplemented with 100 U/mL penicillin and 100 µg/mL streptomycin.
-
For the extraction process, 9 g of powder from each medicinal plant was extracted in a Soxhlet extractor with ACN/W (60%-40%) and W for 6 h. The different fractions of the extract were recovered. Aliquots of 50 mL solution were then frozen instantaneously in liquid nitrogen (-197 ℃) or in a freezer at -80 ℃. The frozen samples were lyophilized at room temperature using a freeze dryer (Millrock Technology, Kingston, NY, USA) connected to a vacuum pump (OERLIKON, Borner, Koln, Germany) for 48 h. The samples were then dissolved according to the partition coefficient.
The ACN/W and W extract yields were expressed in terms of mg of dry ACN/W and W extract weight per g of dry plant weight, respectively. The extracts were kept in vials at -80 ℃ until analysis. Two extracts were prepared for each sample.
-
Total phenolic content was determined based on the method of Singleton and Rossi[31] using Folin-Ciocalteu reagent. In brief, diluted samples were mixed with Folin-Ciocalteu reagent (10%) and distilled W, and allowed to stand at room temperature for 5 min. Then, 500 μL Na2CO3 solution (7.5%, 500 μL) was added. After 1 h of incubation at room temperature, absorbance of blue mixture was measured at 760 nm versus a blank prepared without extract with a Shimadzu (UV-2401PC, Kyoto, Japan) spectrophotometer. The experiments were carried out in triplicate. Gallic acid was used as a standard with concentrations ranging from 0 to 400 mg/mL (y = 0.0048x + 0.063, R2 = 0.9975). The total phenolic content was expressed as mg gallic acid equivalents (GAE) per g (dry weight, DW) extract (mg GAE/g DW).
The total condensed tannin content was determined using the Vanillin method, as adopted by Makkar and Becker[32]. Briefly, samples were mixed with vanillin dissolved in methanol. Then, concentrated HCl was added to the mixture. The absorbance was read on a spectrophotometer at 500 nm. Tannin content was calculated through a curve of catechin (0-500 mg/mL) (y = 0.0033x + 0.0184, R2 = 0.9977) and expressed as mg Catechin Equivalent per g of dry extract (mg CE/g DW).
-
HPLC analyses were carried out at 280 nm for phenolic acids and 360 nm for flavonoids, and operated at 30 ℃ using a C18 column (4.6 mm × 150 mm) × 5 mm in a Thermo Fisher apparatus, and the injected volume was 20 µL. The mobile phase consisted of acetonitrile (A) and 2% glacial acetic acid (pH = 2.6) (B), at a flow rate of 0.5 mL/min. The elution gradient was 30%-95% (B) for a total run time of 45 min, starting from 5% solvent A and 95% solvent B, decreasing to 65% solvent B over 30 min, and to 30% over 10 min.
Pure compounds used in this study: gallic acid, catechin, vanillic acid, epicatechin, coumaric acid, apigenin, naringenin, rutin, quercetin, and kaempferol were used as external standards. All standards were dissolved in methanol and injected under the same chromatographic conditions as the extracts. Phenolic compounds of plant extracts were identified by comparing their retention times with those of pure standards. The results are expressed as mg of each compound per mL extract (mg/mL).
-
T. alopecurus essential oil (TApEO) and Pituranthos tortuosus essential oil (PTEO) were analyzed using GC coupled with MS on an Agilent 6890 gas chromatograph with autosampler coupled with an Agilent 5973 MSD detector (Agilent Technologies, Santa Clara, CA, USA) with an electron impact ionization of 70 eV. A Phenomenex ZB-5MSi capillary column (30 m × 0.25 mm, 0.5 µm film thickness (Agilent Technologies; Hewlett-Packard, Palo Alto, CA, USA) was used at a temperature programmed to rise from 40 ℃ to 280 ℃ at a rate of 5 ℃/min. Helium (99.999% purity) was used as a gas carrier with a flow rate of 0.7 mL/min, a split ratio of 60:1, and scan time and mass range of 1 s and 50-550 m/z, respectively. EOs were identified by matching the recorded mass spectra with those stored in the Wiley 09 NIST 2011 mass spectral library of the GC/MS data system.
-
DPPH Assay Antioxidant activity of the plant extracts was assessed by DPPH assay as described by Brand-Williams et al.[33] with slight modifications. A methanolic DPPH solution (2 mL of 6 × 10⁻⁵ mol/L) was incubated with different doses of extracts (1, 10, 50, 100, 200 μg/mL). The mixture was kept in the dark at room temperature. Absorbance was measured at 515 nm using a UV/visible light spectrophotometer (Spectronic Genesys 8, Rochester, NY, USA). Butylated hydroxytoluene (BHT) was used as a positive control. The ability of samples to scavenge DPPH radicals was determined by the following Equation:
$$ \% {\rm{Inhibition}} = \left( {{A_{{\rm{blank}}}}-{A_{{\rm{sample}}}}/{A_{{\rm{blank}}}}} \right) \times 100 $$ (1) Where Ablank and Asample are the absorption of sample and absorption of tested extract solution, respectively. Effective concentration (EC50) was estimated as described previously[8].
β-carotene/linoleic Acid Bleaching Assay β-carotene bleaching was performed as described by Guesmi et al.[5]. Briefly, in an aliquot containing a mixture of β-carotene (0.5 mg), chloroform (1 mL), linoleic acid (25 µL) and Tween 40 (200 mg), oxygenated W (100 mL) was added after evaporating the chloroform using a rotary evaporator (Heidolph, Schwabach, Germany). Thereafter, oily fractions of T. algeriensis, P. tortuosus, and T. alopecurus were added to each tube containing 350 µL of emulsion, and BHT was considered a positive control. Tubes were shaken and kept in a water bath at 50 ℃. Optical densities were measured spectrophotometrically at 490 nm until the disappearance of the yellow β-carotene color. The solution prepared without β-carotene was considered as blank.
β-carotene oxidation was measured by the following Equation:
$$ \begin{gathered} \;\;\;{\rm{ \mathsf{ β} }}-{\rm{carotene}}\;{\rm{bleaching}}\;{\rm{inhibition}}\; = \;({\rm{ \mathsf{ β} }}-{\rm{carotene}} \hfill \\ {\rm{absorbance}}\;{\rm{after}}\;{\rm{1h/initial}}\;{\rm{absorbance}}) \times 100. \hfill \\ \end{gathered} $$ (2) In vitro Antibacterial Activity Whatman discs (6 mm) were impregnated with two concentrations (300 µg and 3 mg) of ACN/W (60%-40%) and W extracts and placed in plates. Bacteria strains tested in this study were suspended in Mueller-Hinton agar (MHA) (106 colony forming units/mL). Chloramphenicol (30 µg/L) and streptomycin (10 µg/µL) were used as positive controls for the agar diffusion assay. Methanol-saturated discs were used as negative controls. After incubation of plates for 24 h at 37 ℃, inhibition zones were measured in mm around the discs.
MTT Uptake Method The in vitro cytotoxic effect of plant extracts and essential oils on the mouse macrophage cell line RAW 264.7 and cancer cells KBM5, Panc28, MCF7, U266, SCC4, and HCT116, was determined by the modified MTT assay. This assay is based on the conversion of yellow MTT to the purple formazan derivative by mitochondrial succinate dehydrogenase in viable cells[34]. When cells die, they lose the ability to convert MTT into formazan, thus color formation serves as a useful and convenient marker of the viable cells. Briefly, RAW 264.7 (3 × 10⁴) cells were seeded in 96-well plates, and kept in 5% CO2 at 37 ℃ for one night before treatment. Cells were incubated for 24 h with serially diluted ACN/W and W plant extracts (12.5, 25, 50, 100, 200, 400 µg/mL) in triplicate. Cancer cells (5 × 10² cells/well) were incubated with increasing concentrations of TApEO (0, 0.5, 1, 5, or 10 pg/mL) and PTEO (0, 5, 10, 15, or 20 pg/mL) dissolved in DMSO in triplicate in a 96-well plate for 72 h. The cells were incubated with MTT solution. After 2 h of incubation, a solution of the extraction buffer (20% SDS, 50% dimethyl formamide) was added. Vehicle was considered as the control. Negative controls were cells cultured in the absence of extracts[8]. Optical densities were measured at 570 nm after an overnight incubation at 37 ℃ using a 96-well multiscanner with the extraction buffer as blank. The lines represent the mean ± SD of 3 independent experiments carried out in triplicate.
-
Log transformed IC80 and EC50 values for cytotoxic and antioxidant activity were calculated using regression analysis and expressed as a mean of 80% cell viability and 50% DPPH, respectively. Extraction and experimental assays were performed in triplicate. Statistical significance of the differences between the treated and control sample means were evaluated by Student's t-test and ANOVA test for pair-wise and multiple comparisons, respectively. Statistical differences are considered significant at P ≤ 0.05.
Chemicals
Cell Lines
Bacterial Strains
Plant Material
Cell Culture
Plant Material Extraction
Determination of Total Phenolic Content
HPLC Analysis
Analysis of Essential Oils (EOs) by GC/MS
Antioxidant Activity
Statistical Analysis
-
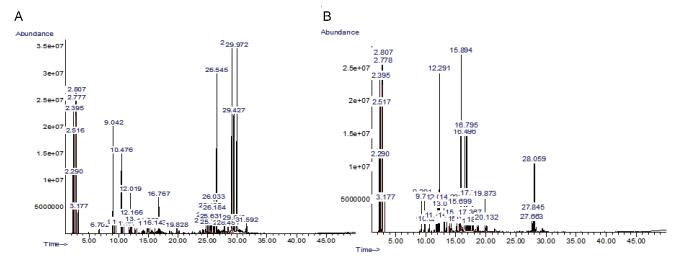
Essential oils from the aerial parts of T. alopecurus and P. tortuosus, extracted with a Clevenger apparatus, were analyzed both qualitatively and quantitatively by GC/MS. As shown in Table S1 and Figure S1, available in www.besjouranl.com, 48 compounds were identified in TApEO and 34 bioactive compounds were detected in the upper parts of PTEO. Essential oil from T. alopecurus, rich in sesquiterpenes, is mainly composed of (+)-Epi-Bicyclo sesquiphellandrene, d-limonene, and α-bisabolol (16.16%) (Figure 1). The hydrophobic fraction of PTEO showed the presence of high amounts of oxygenated monoterpenes (camphor, terpinen-4-ol, endo-borneol), organic compounds, and low levels of oxygenated sesquiterpene (1.98%).
NO. RIa Componentsb Formula Pic Area (%) Identification TApEO PTEO 1 939 Pentane, 2-methyl C6H14 1.46 1.97 CG-SM 2 946 1-Pentene C5H10 trc nd CG-SM 3 948 Pentane, 3-methyl C6H14 6.12 8.17 CG-SM 4 952 n-Hexane C6H14 tr 7.01 CG-SM-TR 5 955 Cyclopentane, methyl C6H12 2.47 3.32 CG-SM 6 958 1-Butene, 3, 3-dimethyl- C6H12 tr 6.55 CG-SM 7 962 Cyclohexane C6H12 0.67 0.90 CG-SM-IR 8 965 Borane BH3 0.19 nd CG-SM-IR 9 967 β-Thujene C10H16 5.12 nd CG-SM 10 968 (1R)-2, 6, 6-Trimethylbicyclo[3.1.1] hept-2-ene C10H16 0.44 1.78 CG-SM 11 970 (1S)-2, 6, 6-Trimethylbicyclo[3.1.1] hept-2-ene C10H16 0.44 1.78 CG-SM 12 971 Camphene C10H16 ndd 1.60 CG-SM 13 972 Benzene, butyl C10H14 tr 0.38 CG-SM 14 976 β-Phellandrene C10H16 3.88 nd CG-SM-CAS# 15 979 β-Pinene C10H16 0.48 0.42 GC-MS 16 993 β-Myrcene C10H16 0.35 nd CG-SM-CAS# 17 1022 (+)-2-Carene C10H16 0.31 0.63 CG-SM 18 1026 o-Cymene C10H14 2.00 1.65 CG-SM 19 1028 Eucalyptol C10H18O nd 9.64 CG-SM 20 1029 p-Cymene C10H14 2.00 nd CG-SM 21 1037 trans-3(10)-Caren-2-ol C10H16O 0.77 nd CG-SM 22 1041 d-Limonene C10H16 0.89 nd CG-SM 23 1069 Ethanone, 1-(1, 4-dimethyl-3-cyclohexen-1-yl)- C10H16O 0.46 nd CG-SM 24 1071 γ-Terpinene C10H16 0.53 1.23 CG-SM 25 1074 cis-Linaloloxide C10H18O2 nd 0.58 CG-SM 26 1081 Ethyl 2-(5-methyl-5 vinyltetrahydrofuran-2-yl)propan-2-yl carbonate C13H22O4 nd 0.67 CG-SM 27 1088 α-terpinolene C10H16 nd 0.73 CG-SM 28 1098 Linalool C10H18O nd 1.53 CG-SM 29 1125 α-Campholenal C10H16O nd 0.80 CG-SM 30 1132 2-(5-Methyl-furan-2-yl)-propionaldehyde C8H10O2 0.24 nd CG-SM 31 1137 4-Acetyl-1-methylcyclohexene C9H14O 0.35 nd CG-SM 32 1146 (1R)-(+)-Norinone C9H14O nd 0.49 CG-SM 33 1152 Camphor C10H16O nd 17.64 CG-SM 34 1972 endo-Borneol C10H18O nd 9.02 CG-SM 35 1185 Methyl ethyl cyclopentene C8H14 0.43 nd CG-SM 36 1193 Terpinen-4-ol C10H16O 1.88 6.49 CG-SM 37 1198 alpha.-Terpineol C10H18O nd 0.88 CG-SM 38 1204 (1R)-(-)-Myrtenal C10H14O nd tr CG-SM 39 1218 Verbenone C10H14O nd 2.01 CG-SM 40 1229 Carveol C10H16O nd 0.53 CG-SM 41 1237 Pulegone C10H16O nd 0.50 CG-SM 42 1285 Bornyl acetate C12H20O2 nd 1.87 CG-SM 43 1293 Thymol C10H14O 0.24 0.51 CG-SM 44 1347 (+)-(E)-Limonene oxide C10H16O 0.37 nd CG-SM 45 1420 4, 11-selinadiene C15H24 0.93 nd CG-SM 46 1484 β-Selinene C15H24 1.31 nd CG-SM 47 1488 cis-α-Bisabolene C15H24 0.46 nd CG-SM 48 1491 α-Selinene C15H24 0.78 nd CG-SM 49 1505 β-Bisabolene C15H24 0.34 nd CG-SM 50 1513 γ-Cadinene C15H24 1.78 nd CG-SM 51 1523 δ-Cadinene C15H24 1.33 nd CG-SM 52 1554 Humulene C15H24 tr nd CG-SM 53 1576 (-)-Spathulenol C15H24O nd 0.74 CG-SM 54 1584 β-Caryophyllene oxide C15H24O 0.37 1.24 CG-SM 55 1590 Ledol C15H26O nd 4.47 CG-SM 56 1593 3-Cyclohexen-1-carboxaldehyde, 3, 4 dimethyl- C9H14O 0.73 nd CG-SM 57 1607 α-humulene epoxide C15H24O 0.73 nd CG-SM 58 1616 Pentylidenecyclohexane C11H20 tr nd CG-SM 59 1634 (+)-epi-Bicyclosesquiphellandrene C15H24 15.40 nd CG-SM 60 1637 Bicyclo[4.4.0]dec-1-ene, 2-isopropyl-5-methyl-9-methylene- C15H24 tr nd CG-SM 61 1641 Tau-Muurolol C15H26 tr nd CG-SM 62 1649 Guaia-3, 9-diene C15H24 tr nd CG-SM 63 1683 α-Bisabolol C15H26OH 16.16 nd CG-SM 64 1707 α-cyperone C15H22O 0.53 nd CG-SM 65 1734 2(1H)Naphthalenone, 3, 5, 6, 7, 8, 8a-hexahydro-4, 8a-dimethyl-6-(1-methylethenyl)- C15H22O 0.53 nd CG-SM Note. aRetention Index relative to C5-C15 n-alkanes on the phenomenex ZB-5MSi capillary column; bCompounds listed in order of their RI, ctr = trace ( < 0.05%), dnd = non detected. Table Table S1. Chemical Composition of Aerial Parts of Teucrium Alopecurus and Pituranthos Tortuosus Essential Oil, Cultivated in Tunisia
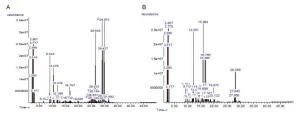
Figure Figure S1. Chromatographic profile of TApEO (A) and PTEO (B).
-
In this study, the best yields were obtained from W extracts, due to W's polarity and high extraction ability. Phytochemical investigation indicated an abundance of phenolic compounds, including total phenols (TP) and tannins (T). The amount of TP in ACN/W extract of Erica multiflora (EMACN/W), CRACN/W, and THACN/W (18, 322, 10, 980, and 12, 384 µg GAE/g DW, respectively) was found to be higher than in CRW, CMW, and PTW (824, 605, and 1, 309 µg GAE/g DW, respectively), as determined by the standard curve. The TP levels were also high compared to that in other species, such as Teucrium polium and Lavandula multifida. Under these experimental conditions, it can be concluded that ACN/W was efficient at extracting all highly polar components from different parts of the plants.
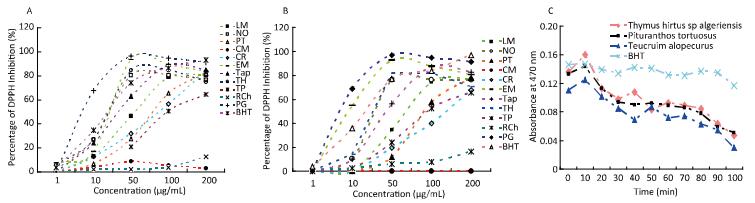
The extracts at concentrations ranging from 1 to 200 µg/mL exhibited dose-dependent radical scavenging activity. Low doses exhibited a relatively low percentage of DPPH inhibition compared with BHT. Figure 2 shows that Cyperus rotundus and T. polium extract had the worst antioxidant activity, whereas Punica granatum and the aqueous extract of Nerium oleander (NOACN/W) showed an increased free radical scavenging activity, even higher than that of BHT. Moreover, it has been reported that E. multiflora, T. alopecurus, and Thymus hirtus sp. algeriensis are potent scavengers of the DPPH radical, because the EC50 values were close to that of the standard BHT. The scavenging activity expressed as EC50 values varied from 6.78, 7.65, and 8.55 µg/mL, respectively (Table 2). The antioxidant activities of the oily fractions of T. alopecurus (TAp), T. algeriensis (TH), and P. tortuosus (PT) were also determined using a β-carotene/ linoleic acid bleaching test. Here, TH and BHT were indicated as potent free radical scavengers.
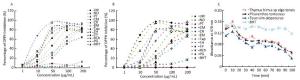
Figure 2. Antioxidant activity of ACN/W (A) and W (B) samples determined using DPPH assay and β-carotene bleaching method induced by essential oils (C). BHT was used as standard.
SamplesA Extract Yield
(mg DEW/g DPW)DTotal Phenolic Compounds
(mg GAE/g DW)Tannins
(mg CE/g DW)EC50E
(µg/mL)APRF RAW264.7
(ATCC, TIB-71) IC80 (μg/mL)GEM ACN/WB 9.71 ± 1.20a 18.322 ± 1.64a 1.450 ± 0.89a 20.70 ± 0.16 0.048 8.01 EM WC 30 ± 2.80b 61.14 ± 2.95b 0.043 ± 3.24b 8.55 ± 0.06 0.116 116.74 CR ACN/W 10.95 ± 1.24c 10.980 ± 1.29c 1.913 ± 0.07c 101.88 ± 2.50 0.009 ND CR W 5 ± 0.07d 0.824 ± 0.04d 0.010 ± 0.01d 165.53 ± 1.24 0.006 ND TAp ACN/W 9.14 ± 0.05a 5.557 ± 0.58e 0.623 ± 0.08e 27.99 ± 0.25 0.035 ND TAp W 21 ± 3.21e 2.935 ± 0.50f 0.033 ± 0.01f 56.27 ± 1.64 0.017 ND CM ACN/W 8.22 ± 1.22f 4.500 ± 0.22g 2.418 ± 0.81g NA - 5.51 CM W 42 ± 2.98g 0.605 ± 0.60d 0.073 ± 0.01h NA - ND PT ACN/W 8.63 ± 1.05f 7.884 ± 1.06h 6.163 ± 0.56i 76.72 ± 0.80 0.013 1.55 PT W 12 ± 1.36h 1.309 ± 0.05i 0.763 ± 0.02j 87.25 ± 1.48 0.011 ND TP ACN/W 10.55 ± 2.08c 5.832 ± 0.74e 1.085 ± 0.22k 135.92 ± 2.68 0.007 5.11 TP W 23 ± 3.40e 1.093 ± 0.45i 0.209 ± 0.04g 100.29 ± 1.56 0.009 ND LM ACN/W 10.97 ± 1.76c 6.003 ± 0.08b 2.778 ± 0.63g 62.63 ± 0.14 0.015 47.20 LM W 13 ± 1.08h 2.472 ± 0.89f 0.052 ± 0.01l 70.44 ± 1.28 0.014 ND TH ACN/W 15.27 ± 1.50i 12.384 ± 1.94j 0.307 ± 0.08m 23.64 ± 0.24 0.042 8.35 TH W 16 ± 2.43i 4.954 ± 0.20g 2.490 ± 0.60g 24.86 ± 0.86 0.040 > 400 NO ACN/W 4.93 ± 1.22d 5.364 ± 0.62e 0.179 ± 0.02n 24.45 ± 1.25 0.040 0.36 NO W 18 ± 1.86j 4.079 ± 0.43g 0.020 ± 0.01g 25.11 ± 0.90 0.039 ND RCH ACN/W 20 ± 2.34e 7.096 ± 0.83h 3.145 ± 0.20f NA - ND RCH W 73.88 ± 3.56k 1.234 ± 0.76j 0.086 ± 0.01o NA - 100 PG ACN/W 54.77 ± 2.39g 5.985 ± 0.08e 1.222 ± 0.72p 7.65 ± 0.05 0.130 ND PG W 80 ± 3.42k 4.743 ± 0.92g - 6.78 ± 0.07 0.147 ND BHT - - - 19.3 ± 1.02 0.051 ND Note. *Results are expressed as mean ± SE of 3 independent replicates. AExtracts obtained by ACN/W (60%-40%) and by W extraction. NA: not available, ND: not detected, EM: E. multiflora, CR: C. rotundus, TAp: T. alopecurus, CM: C. monspelliensium, PT: P. tortuosus, TP: T. poluim, LM: L. multifida, TH: T. hirtus sp. algeriensis, NO: N. oleander, RCH: Ruta chalepensis, PG: P. granatum; BACN/W–Extracts obtained by ACN/W extraction; CW-Extracts obtained by W extraction; Dmg of dry Extract Weight per g of Dry Plant Weight; EEffective concentration compound decreasing the absorbance of a DPPH solution by 50%; FAntiradical power; GCell viability is expressed as 80% inhibitory concentration (IC80); Values showing the same letter on the same column do not show significant difference (P > 0.05). Table 2. Determination of the Content of Total Phenolic Compounds Tannins, Antioxidant Activity by DPPH (EC50), and Cytotoxicity Towards Murine Macrophagic Cells (RAW 264.7) of the Extracts*
-
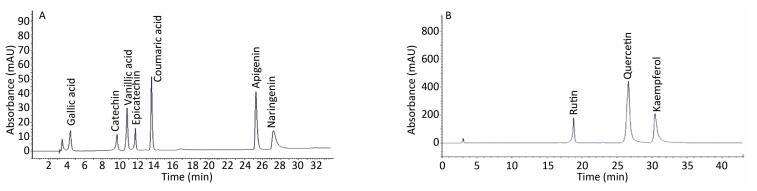
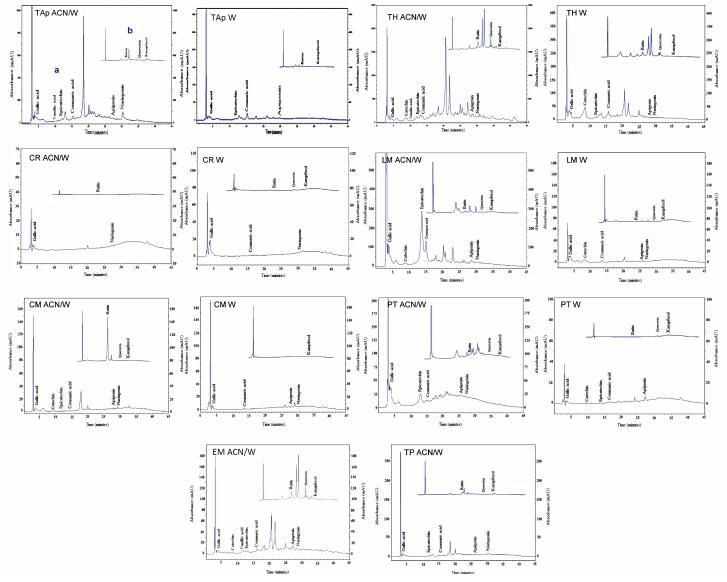
The elution profile of standards used in this study is indicated in Figure 3. Qualitative profiles of the phenolic compounds of different extracts are summarized in Figure 4 and Figure S2, available in www.besjouranl.com. Significant quantitative differences were detected among the 11 samples. In Table 3, the HPLC analyses shows the presence of high levels of phenolic acid derivatives. In the mountain regions, plant extracts revealed higher levels of gallic acids (12.65 ± 2.68, 149.48 ± 1.26 μg/mL), catechin (45.5 ± 0.74, 61.94 ± 2.81 μg/mL), epicatechin (35.09 ± 3.42, 149.44 ± 2.84 μg/mL), apigenin (21.54 ± 3.26, 101.30 ± 2.28 μg/mL), and naringenin (236 ± 2.01 μg/mL) than those from the plains areas (52.59%; 58.98%).
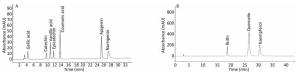
Figure 3. Chromatogram of a standard mixture of phenolic acids and flavonoids detected using HPLC at 280 nm (A) and HPLC at 360 nm (B).
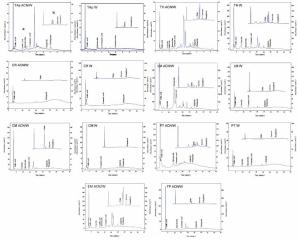
Figure 4. HPLC chromatograms at 2 wavelengths (a: 260 nm; b: 360 nm) of phenolic compounds of 8 species cultivated in Tunisia.

Figure Figure S2. Area (%) of different components of extracts.
Concentration (µg/mL) Gallic acid Catechin Vanillic acid Epicatechin Coumaric acid Apigenin Naringenin Rutin Quercetin Kaempferol TAp ACN/Wa 2.65 ± 0.04 ndc 0.73 ± 0.56 19.61 ± 0.10 0.42 ± 0.00 0.43 ± 0.09 1.42 ± 0.37 13.99 ± 1.22 0.09 ± 0.00 2.38 ± 0.08 TAp Wb 5.83 ± 0.07 ndc ndc 18.70 ± 1.34 1.70 ± 0.04 0.63 ± 0.00 ndc 1.25 ± 0.01 ndc 0.50 ± 0.01 TH ACN/W 37.22 ± 0.08 27.77 ± 0.65 0.64 ± 0.16 13.20 ± 0.64 65.77 ± 1.76 101.30 ± 2.28 236.73 ± 2.01 45.32 ± 1.80 54.77 ± 1.20 9.55 ± 0.05 TH W 1.18 ± 0.05 45.5 ± 0.74 ndc 35.09 ± 3.42 7.56 ± 1.20 5.56 ± 0.05 2.54 ± 0.05 1.87 ± 0.01 1.40 ± 0.04 0.07 ± 0.01 CR ACN/W 1.94 ± 0.02 8.64 ± 0.00 ndc ndc ndc ndc ndc 0.67 ± 0.05 ndc ndc LM ACN/W 11.20 ± 0.06 ndc ndc ndc 0.10 ± 0.05 ndc 0.30 ± 0.08 0.11 ± 0.01 0.17 ± 0.07 0.05 ± 0.00 LM W 149.48 ± 1.26 61.94 ± 2.81 ndc ndc 21.05 ± 1.12 0.66 ± 0.04 1.92 ± 0.03 10.88 ± 1.83 0.76 ± 0.03 1.17 ± 0.02 CM ACN/W 27.84 ± 1.27 0.93 ± 0.05 ndc ndc 0.04 ± 0.02 0.26 ± 0.01 13.40 ± 1.76 53.61 ± 2.84 0.09 ± 0.02 0.07 ± 0.01 CM W 2.67 ± 0.15 ndc ndc ndc 0.79 ± 0.01 0.12 ± 0.00 0.81 ± 0.05 ndc ndc 0.15 ± 0.07 PT ACN/W 79.1 0 ± 1.76 ndc ndc 149.44 ± 2.84 1.36 ± 0.52 0.40 ± 0.92 0.82 ± 0.01 2.47 ± 0.16 0.18 ± 0.07 0.18 ± 0.09 PT W 1.51 ± 0.94 0.17 ± 0.01 ndc 0.07 ± 0.01 0.48 ± 0.08 0.66 ± 0.07 0.98 ± 0.12 0.19 ± 0.01 0.12 ± 0.08 0.07 ± 0.08 EM ACN/W 13.49 ± 1.13 27.29 ± 2.73 4.00 ± 1.05 9.67 ± 0.09 18.33 ± 1.28 21.54 ± 3.26 13.05 ± 1.98 42.05 ± 2.67 43.57 ± 0.18 0.23 ± 0.07 EM W 6.28 ± 0.04 4.83 ± 0.23 ndc ndc 15.09 ± 2.81 12.34 ± 0.28 2.71 ± 1.02 14.60 ± 3.88 16.26 ± 3.22 ndc TP ACN/W 12.65 ± 2.68 ndc ndc 3.09 ± 1.48 1.56 ± 0.02 0.10 ± 0.01 15.6 ± 1.23 13.99 ± 1.58 0.48 ± 0.22 14.64 ± 1.44 TP W 9.52 ± 0.82 ndc ndc 0.13 ± 0.04 0.48 ± 0.08 ndc 2.34 ± 0.05 7.56 ± 0.05 ndc 0.18 ± 0.09 Note. aACN/W-Extracts obtained by ACN/W extraction; bW-Extracts obtained by W extraction; cnd: not detected; EM: E. multiflora, CR: C. rotundus, TAp: T. alopecurus, CM: C. monspelliensium, PT: P. tortuosus, TP: T. poluim, LM: L. multifida, TH: T. hirtus sp. algeriensis, NO: N. oleander, RCH: Ruta chalepensis, PG: P. granatum; Results are expressed as mean ± SE of 3 independent replicates. Table 3. Values of Phenolic Compounds Obtained under HPLC Conditions
Low amounts of phenolic compounds were detected in E. multiflora and Carduncellus monspelliensium extracts, whereas aerial parts of L. multifida contained a variety of gallic acids and catechins. The ACN/W extract from the upper parts of T. hirtus sp. algeriensis had the highest amounts of coumaric acid, apigenin, and naringenin of the 11 plants screened.
-
The results show that the higher the concentration (3 mg/mL) of extracts, the more the plants had potential activity against some pathogenic bacteria. P. granatum showed the most powerful activity against the most bacterial strains (Table 4, Figure S3, available in www.besjouranl.com). Thus, this data seems to show that the P. granatum extract led to higher antibacterial activity compared to streptomycin (10 µg/µL). In addition, the ACN/W extracts showed significant antioxidant activity and highly potent antibacterial effect towards strain growth, because they contain the highest levels of phenolics and tannins.

Table 4. Antibacterial Activity of the Extracts Examined in This Study and the Standard Antibiotics (Streptomycin and Chloramphenicol) against 7 Bacteria (inhibition zone diameters: mm)

Figure Figure S3. (A) Antibacterial effects of T. alopecurus and T. hirtus sp. algeriensis extracted with ACN/W (60%-40%) and of P. granatum extracted with W towards B. cereus. (B) Antibacterial effect of P. granatum extracted with W towards S. aureus. (C) Antibacterial effect of P. granatum extracted with ACN/W (60%-40%) towards S. aureus. (D) Antibacterial effect of P. granatum extracted with ACN/W and of N. oleander towards B. cereus.
-
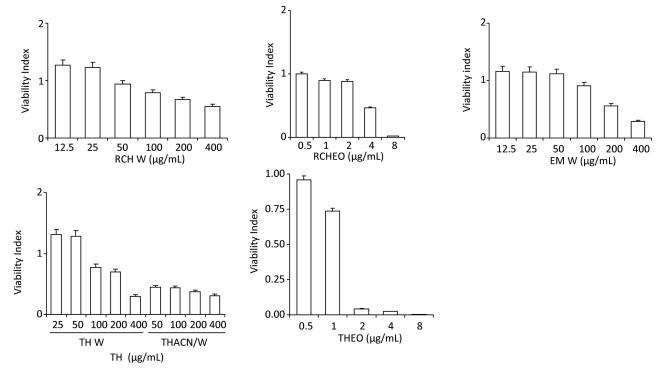
The MTT assay was used to investigate the protec-tive effect of several species in RAW 264.7 cells. This cell viability analysis was assessed in a dose-dependent manner with ACN/W and W extract treatment.
No effect on cell viability was detected for the RAW cell line when treated with concentrations < 400 µg/mL of TH W (W extract of T. algeriensis), as seen in Table 2, but significant decline in cell viability for the same cell line was observed when treated with concentrations higher than 8.35 µg/mL 60%:40% TH ACN/W (ACN/W extract of T. algeriensis) (Figure 5). Cell viability decreased with increasing sample concentrations from different species. The results indicate that ACWET and AET inhibited the proliferation of RAW 264.7 cells in a dose-dependent manner.

Figure 5. Cytotoxic experiment with RAW 264.7 cells.
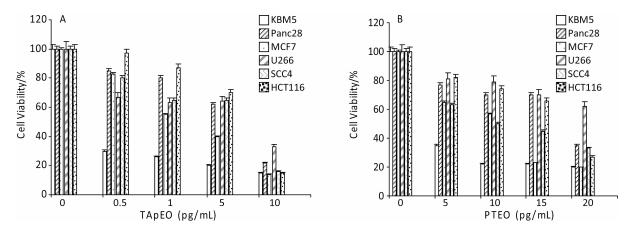
Figure 6 shows the inhibition of concentration-dependent reduction of MTT activity. Cytotoxic activity of the concentrations indicated for TApEO and PTEO was investigated in 6 tumor cell lines using the MTT assay. Cytotoxicity increased with higher TapEO dose for all cancer cells tested (Figure 6A). Higher cytotoxicity was observed for leukemia and breast cancer cells after 72 h of exposure to the hydrophobic fractions of Teucrium (Figure 6B).

Figure 6. Tumor cells were pre-treated with concentrations of TApEO (A) and PTEO (B) and incubated for 72 h. Cell viability was analyzed by the MTT assay.
GC/MS Analysis
Phenolic Content, Antioxidant Activity, and Cytotoxic Experiments
Identification and Quantification of Phenolic Compounds with HPLC
Antibacterial screening of Crude Extracts with Disc Diffusion Assay
Cytotoxic Experiment
-
The goal of this study was to evaluate the antioxidant, antibacterial, and cytotoxic effects of plants from two regions in Tunisia (Gafsa and Zaghouan) that are used in Ayurveda. This report indicates that extracts from plants cultivated in both north and south regions of Tunisia possessed significant antioxidant activity, as measured by the DPPH method. The DPPH radical is thought to be reduced to the corresponding hydrazine when it reacts with the donating hydrogen substances[9].
Oxidation reactions can produce excess free radicals, which in turn start chain reactions that damage cells[35]. Taken together, our findings suggest that some of the extracts' suppression of DPPH radical production may be induced due to high phenolic content. Based on this data, the percentage of inhibition of DPPH free radicals increased in a dose-dependent manner. A significantly potent antiradical effect was observed for W extracts, including PG W, PG ACN/W, and EM W. Therefore, this activity was even higher than that of BHT. The antioxidant activity of the ACN/W fraction of T. alopecurus was 6-fold greater than that of C. rotundus W extract. Our results agree with those reported by Ahmed et al.[8], who indicated the potential antioxidant effects of oily fractions of some of the plants studied in this report. This is in contrast to some reports that have suggested that C. rotundus exhibits significant antioxidant and antimutagenic activity[36]. Antioxidants either transfer an electron or a hydrogen atom to DPPH, thus neutralizing its free radical character[37] and terminating these chain reactions by removing free radical intermediates and inhibiting other oxidation reactions[35]. Quercetin, as a flavonoid, has been reported to protect the testis from cadmium chloride (CdCl2) toxicity[38]. In another study, it was found that encapsulation of quercetin in chitosan/alginate nanoformulations may represent an effective therapeutic approach against oxidative stress-induced liver injury[39].
Furthermore, oily fractions of T. hirtus sp. algeriensis scavenge the linoleic acid peroxide radicals that induce β-carotene oxidation in the emulsion phase[9]; this effect could be attributed to high levels of phenolic compounds. However, TAp and TP, presented moderate capacity to inhibit β-carotene bleaching. Our data agree with previous reports that showed T. polium extracts were potent inhibitors of β-carotene oxidation[40] and induced lipid peroxidation reduction in the hippocampus and cerebral cortex[41]. Overall, positive correlations between antioxidant capacity and phenolic content suggest that the antioxidant activity of medicinal plants can be determined primarily by their phenol content[42]. The large amount of phenolics contained in the peel extract of P. granatum may be responsible for its strong antioxidant ability[43], and they may be used as biopreservatives in food and nutraceuticals[44].
The present findings clearly demonstrate that natural medicinal plants induced bacteria growth inhibition through their bioactive compounds as determined by disc diffusion assay, although each strain showed different sensitivity. All strains of microorganisms tested were resistant to samples at 300 µg/disc. A weak activity was observed for S. typhi and B. subtilis at 3 mg/disc, while B. cereus was sensitive to all samples (3 mg/disc) of species cultured in Tunisia, including L. multifida and T. algeriensis. This data corresponds with previous observations that oily fractions of T. algeriensis exhibited a potent effect against 6 strains of bacteria (1.50 < MIC < 22.00 mg/mL)[5].
These results are consistent with another report that showed that leaves of L. multifida, used as a source of natural antioxidants, strongly inhibited the growth of gram-positive bacteria at low concentrations[45]. In a further study, Soro and co-workers[46] reported that L. multifida had remarkable activity against E. coli, possibly due to the presence of Durenol, a phenolic component.
A recent report by Mighri et al.[47] investigated the antibacterial activity of P. tortuosus on different bacterial strains. P. tortuosus has been shown to exhibit weak activity against E. coli and Klebsiella pneumoniae, moderate activity against S. aureus, and high activity against Streptococcus pyogenes and Enterobacter aerogenes.
In this study, we determined the activity of various species against RAW 264.7 and cancer cell lines. The reduction of cell viability by different doses of the extracts may explain the antiproliferative effects on murine macrophage cell lines. The biochemical and molecular mechanisms by which extracts exert antibacterial and antiproliferative effects in these cells were not investigated. Importantly, NOACN/W potently inhibits cell proliferation through decreased cell viability. Another work confirmed the toxic effect of N. oleander[48]. In addition, the noxious effects of this species, as indicated by Akhtar et al.[49], may contribute to plasmalemmal Na+/K+-ATPase inhibition. The data in the present study also indicate that P. tortuosus inhibited cell proliferation of murine macrophage cell lines in a dose-dependent manner. From this data, we can conclude that cytotoxic effects correlated with total phenolic compounds, tannin contents, and the antioxidant activity of the apoptotic effects of cytokines and chemotherapeutic agents.
No reduction of cell viability was observed in the RAW cell line after treatment with 0.125 and 0.250 µg/mL of essential oil from T. algeriensis aerial parts. The same essential oil induced cytotoxic effects (reduction of cell viability) at concentrations higher than 1 µg/mL, as seen in the work of Ahmed et al.[8].
TApEO and TPEO were found to suppress proliferation of various types of tumor cells. The antiproliferative activity of T. polium on different cell lines has been reported[50]. Other experiments using oily fractions of various species collected from the same region that also inhibited RAW 264.7 cells corroborate our findings obtained with aqueous and ACN/W extracts that reduced viability in murine macrophage cell lines. The report by Seo et al.[51]documented that the methanol (MeOH) extract of rhizomes of C. rotundus could modulate NO and O2- production in RAW 264.7 cells.
Previous reports on the antitumor activity of hydrophobic fractions of some natural species showed the cytotoxic effects of their bioactive components. In earlier studies, P. tortuosus essential oil, prepared by hydrodistillation-solvent extraction, which mainly contains terpinen-4-ol, sabinene, γ-terpinene, and β-myrcene, was the most potent cytotoxic agent against liver, colon, and breast cancer cell lines (IC50: 1.67, 1.34, and 3.38 μg/mL, respectively)[52]. Tumor cell growth inhibition induced by P. tortuosus was associated with characteristic apoptotic changes in the cells, including nuclear condensation[53].
Our results may also explain the cytotoxic effects exhibited by different essential oils that may be related to an action of terpenic compounds, especially sesquiterpenes, present in oils.
-
There are no conflict of interest to declare.
-
We would like to thank Dr. Bharat B. Aggarwal, Founding Director, Inflammation Research Institute, San Diego, CA, USA, and Former Professor of Experimental Therapeutics, Cancer Medicine and Immunology, The University of Texas MD Anderson Cancer Center, Houston, TX, USA. The authors also thank Dr. Cristian Rodriguez-Aguayo, PhD (Research Fellowship, Department of Experimental Therapeutics UT MD Anderson Cancer Center, Division of Cancer Medicine, The University of Texas MD Anderson Cancer Center) for his expert help in the lyophilization of extracts.

 Quick Links
 DownLoad: