


-
T-2 toxin is produced by Fusarium and other genera of fungi and can contaminate food crops, particularly wheat, barley, corn, and other crops. The consumption of food contaminated with T-2 toxin can result in the damage of the digestive, nervous, and reproductive systems[1]. Several epidemiological surveys have suggested that T-2 toxin is the most possible risk factor for Kashin-Beck disease (KBD) in China[2]. The food contaminated with higher levels of T-2 toxin in the endemic areas can be a risk factor for causing KBD. Animal experiments have shown that T-2 toxin can induce chondrocyte apoptosis, chondronecrosis, articular cartilage degeneration, and abnormal calcification. Magnetic resonance imaging (MRI) results have shown that the epiphyseal cartilage became blurred and its signal intensity became heterogeneous in the T-2 toxin group; moreover, the epiphyseal cartilage volumes also became smaller. The bone marrow signal showed isointensity in the control group, whereas some patchy hyperintensity was detected in the epiphyseal bone marrow in the T-2 toxin group[3].
T-2 toxin ingested into rats, chicken, cows, and pigs has a short half-life in the body. After its rapid absorption, it is metabolized into a variety of metabolites, including T-2 triol, T-2 tetraol, 3'-OH-HT-2, neosolaniol (NEO), and HT-2 toxin, which are considered as primary metabolites[4]. This study was aimed at exploring the concentrations of T-2 and HT-2 toxins in different rat tissues after administration of T-2 toxin.
Ethical approval for this animal experiment was obtained from the Institutional Review Board of Xi'an Jiaotong University. A total of 12 healthy Sprague Dawley (SD) rats (six males and six females) aged 3 weeks were purchased from the animal center of Xi'an Jiaotong University. These rats were divided into the following two groups using the random number table method: 1) T-2 toxin group consisting of six rats (three males and three females), which received a gavage of T-2 toxin at a dosage of 2 mL/100 g, and 2) control group consisting of six rats (three males and three females), which received a gavage of normal saline (0.9% NaCl solution). The rats were sacrificed after 8 h of toxin administration, and the thighbone, knee joints, costal cartilage, skeletal muscle, heart, liver, and kidneys were collected for further analyses. The collected samples were weighed and placed in a glass homogenizer for homogenizing. Methanol (75%) was added at a proportion of 1:5. About 500 μL of the supernatant was transferred to eppendorf tubes, which were then subjected to high performance liquid chromatography mass spectrometry (HPLC-MS/MS) for chemical analyses. The protein contents of different tissue homogenates were analyzed using the Bicinchoninic acid (BCA) method. The coefficient of correlation (r) for the standard concentration curve was 0.9967 (Figure 1A).
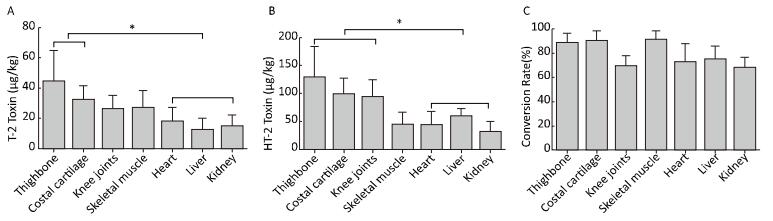
Figure 1. (A) The concentrations of T-2 toxin (μg/kg) in the thighbone, knee joints, costal cartilage, skeletal muscle, heart, liver, and kidneys were determined by HPLC-MS/MS analysis. (B) The relative concentrations of HT-2 toxin (μg/kg) distributed in the thighbone, knee joints, costal cartilage, skeletal muscle, heart, liver, and kidneys were measured by HPLC-MS/MS analysis. (C) The different metabolic conversion rate (%) of HT-2 toxin was (HT-2 toxin/442.2)/(T-2 toxin/484.2 + HT-2 toxin/442.2) as assessed by the HPLC-MS/MS analysis. *P < 0.05.
T-2 toxin, HT-2 toxin, NEO, and T-2 triol from Fusarium sp. (purity 99%) were purchased from J & K Scientific, and their stock solutions of 1 mg/mL were dissolved in DMSO (Sigma-Aldrich). The 1 mg/mL stock solution of T-2 toxin was also dissolved in 19 mL normal saline, and then the mice were administered 2 mL/100 g by gavage. Then, methanol was used to prepare further dilutions. HPLC-MS/MS (API 3200) was performed by AB Sciex Instruments, and Oasis Hydrophilic-lipophilic balance (HLB) columns (30 mg, 1 mL) for sample preparation were purchased from America Waters Company. The microplate reader (Infinite © 200 PRO) was purchased from TECAN.
Then, 1 mL of methanol, 2 mL of dilute HCl (10 mmol/mL), and 1 mL of water were used to activate the Oasis HLB material. This was followed by loading of 0.1 mL of the tissue homogenate onto the Oasis HLB and washing with 1 mL of water and 1 mL of methanol-water (15:85, V/V). These columns were dried for 30 s, and finally, the eluents were collected for analysis with 2 mL of methylene chloride-methanol (40:60, V/V). The conditions for HPLC-MS/MS were as follows, and mobile phase A: water; mobile phase B: 98% methanol (each containing 5 mmol/L ammonium acetate and 0.1% formic acid). The gradient elution was 0-0.5 min, 50% B; 0.5-2.0 min, 100% B; 2.0-3.5 min, 100% B; and 3.6-6 min, 50% B. The column temperature was 35 ℃, the flow rate was 5.0 μL/s, and the injection volume was 10 μL. T-2 toxin, HT-2 toxin, NEO, and T-2 triol were identified from exact mass measurements and fragmentation patterns. The observed (MS) data are as follows:
T-2 toxin: exact mass (FTMS), m/z 484.2; MS/MS 185.200, 215.100.
HT-2 toxin: exact mass (FTMS), m/z 442.2; MS/MS 215.100, 263.200.
NEO: exact mass (FTMS), m/z 400.2; MS/MS 185.200, 305.100.
T-2 triol: exact mass (FTMS), m/z 384.1; MS/MS 199.200, 105.100.
The experiments were performed in the two different groups, including seven tissues per group for the quantitative determination of the metabolites. All measurements were presented as mean ± standard deviation. A total of 84 samples were analyzed for each parameter. The analyses for T-2 toxin and its metabolites (HT-2 toxin, NEO, and T-2 triol) were carried out using Analyst 1.5.1 (AB Sciex Instruments). The non-paired Student's t-test was used to determine the significant differences, and P values < 0.05 were considered as statistically significant.
All the 12 SD rats were administered T-2 toxin or normal saline and followed up for 8 h. As expected, there were no significant differences (P > 0.05) in the weights of the six SD rats before administration (42.08 ± 4.66 g) and after 8 h of administration of T-2 toxin (40.75 ± 1.28 g). Similarly, no significant differences (P > 0.05) were observed in the weight of the six SD rats in the control group before administration (46.92 ± 9.53 g) and after 8 h of administration of normal saline (46.98 ± 9.71 g). The concentrations of T-2 toxin and the three metabolites (HT-2 toxin, NEO, T-2 triol) in different tissue homogenates of SD rats were analyzed by HPLC-MS/MS. Table 1 shows the linear equations, linear ranges, coefficients of correlation, and recovery calculated by the methods. Only T-2 and HT-2 toxins could be quantified from the tissue samples, since the metabolites NEO and T-2 triol were below the detection levels.
Toxins Linear Equation Linear Range (ng/mL) Coefficient of Correlation Recovery (%) T-2 Y = 253 x + 377 2-500 0.9998 95.1-110.0 HT-2 Y = 108 x -87.7 2-500 0.9997 94.8-105.0 T-2 triol Y = 7.38 x -51.8 2-500 0.9999 97.0-102.0 NEO Y = 338 x -610 2-500 1.000 99.7-100.0 Table 1. Comparison of Linear Equations, Linear Ranges, Correlation Coefficients (R2) and Recovery in the HPLC-MS/MS and ELISA Kit Analysis
In the control group, the total concentrations of T-2 and HT-2 toxins were below 6 µg/kg, which were significantly different from those in the T-2 toxin group (P < 0.001). The HPLC-MS/MS analyses showed that the total concentrations of T-2 toxin (µg/kg) in various tissues of toxin-administered SD rats were in the order of thighbone > costal cartilage > skeletal muscle > knee joints > heart > kidney > liver (Figure 1A). Overall, the concentrations of T-2 toxin in the skeletal system (thighbone and costal cartilage) were significantly higher than those in the heart, liver, and kidneys (P < 0.05). The SD rats administered T-2 toxin rapidly metabolized T-2 toxin into HT-2 toxin. The HPLC-MS/MS analysis results showed that the concentration of HT-2 toxin in the different tissues was in the order of thighbone > knee joints > costal cartilage > liver > skeletal muscle > heart > kidney (Figure 1B).
Based on the HPLC-MS/MS analysis, the total concentrations of T-2 and HT-2 toxins in the SD rats were in the order of thighbone > knee joints > costal cartilage > skeletal muscle > liver > heart > kidney (Table 2), and the total concentrations of T-2 toxin and HT-2 toxin in the skeletal system (thighbone, knee joints, and costal cartilage) were much higher than those in the heart, liver, and kidneys (P < 0.05). The molar metabolic conversion rate of T-2 toxin into HT-2 toxin was also calculated through HPLC-MS/MS analysis results, which showed that the metabolic conversion rate of T-2 toxin into HT-2 toxin ranged from 68.20% to 90.70% in the different tissues (Figure 1C).
Tissues T-2 Toxin Group Control t* P Thigh bone 173.26 ± 63.99 3.93 ± 2.51 6.477 < 0.0001 Knee joints 125.73 ± 40.26 4.01 ± 2.27 7.394 < 0.0001 Costal cartilage 125.35 ± 46.42 3.66 ± 1.92 6.416 < 0.0001 Skeletal muscle 71.40 ± 23.99 3.36 ± 2.20 6.918 < 0.0001 Heart 60.89 ± 34.27 5.49 ± 3.58 3.938 0.0028 Liver 70.99 ± 27.17 2.71 ± 0.90 6.152 0.0001 Kidney 44.28 ± 23.66 3.46 ± 2.34 4.206 0.0018 Note. T-2 toxin group shows the total concentration of T-2 toxin and HT-2 toxin (µg/kg) analyzed by HPLC-MS/MS, *t test was used to test the difference between T-2 toxin group and Control group. Table 2. The Total Concentration of T-2 Toxin and HT-2 Toxin Analyzed by HPLC-MS/MS
Currently, T-2 toxin is considered as a risk factor for leukocyte deficiency and KBD. Epidemiological investigation has shown that endemic residents consuming grains contaminated with T-2 toxin may suffer from KBD[5-6]. Our study revealed that both T-2 toxin and HT-2 toxin were detected in the thighbone, costal cartilage, knee joints, skeletal muscle, heart, liver, and kidneys of rats. The total concentrations of T-2 toxin and HT-2 toxin were significantly higher in the thighbone than those in other tissues, followed by the knee joints and costal cartilage. T-2 toxin was rapidly metabolized into HT-2 toxin in all the examined tissues, and the metabolic conversion rate ranged from 68.20% to 90.70%. Still, T-2 toxin and HT-2 toxin may have a tendency to accumulate in the skeletal system.
Previous animal studies have shown that the number of cells in the bone marrow was significantly reduced in rats treated with T-2 toxin, which is known to induce cell apoptosis. There was an increase in the serum levels of alkaline phosphatase, lactate dehydrogenase, and uric acid; however, serum alanine transaminase (ALT) level was decreased[7]. The concentrations of T-2 toxin and HT-2 toxin in the knee joints and thighbone were significantly higher than those in the liver and kidneys. T-2 toxin can result in bone stunting or defect in fetal rats, and pregnant rats exposed to T-2 toxin can develop deformities of fetal ribs and spine[8]. T-2 toxin can also inhibit bone growth and development, which can affect bone mineralization rate and osteoid formation. T-2 toxin can also inhibit CD44 expression and induce the secretion of IL-1 and IL-6 in chondrocytes, inhibit cell proliferation, and increase chondrocyte apoptosis[9-10].
In conclusion, this study explored whether the T-2 toxin has the tendency to accumulate in the skeletal system. In fact, the highest concentrations of T-2 toxin and HT-2 toxin could be detected in the skeletal tissues, particularly in the thighbone. However, more adverse effects could be found in the liver and kidneys, suggesting the general toxic nature of T-2 toxin. The limitation of this study was the short follow-up period. Therefore, a longer follow-up period for further observations and experiments with repeated doses of the toxins are warranted in further studies.
Comparison of T-2 Toxin and HT-2 Toxin Distributed in the Skeletal System with That in Other Tissues of Rats by Acute Toxicity Test
doi: 10.3967/bes2017.115
Funds:
National Natural Scientific Foundation of China 81302393
National Natural Scientific Foundation of China 81620108026
- Received Date: 2017-03-29
- Accepted Date: 2017-10-12
Abstract: Twelve healthy rats were divided into the T-2 toxin group receiving gavage of 1 mg/kg T-2 toxin and the control group receiving gavage of normal saline. Total relative concentrations of T-2 toxin and HT-2 toxin in the skeletal system (thighbone, knee joints, and costal cartilage) were significantly higher than those in the heart, liver, and kidneys (P < 0.05). The relative concentrations of T-2 toxin and HT-2 toxin in the skeletal system (thighbone and costal cartilage) were also significantly higher than those in the heart, liver, and kidneys. The rats administered T-2 toxin showed rapid metabolism compared with that in rats administered HT-2 toxin, and the metabolic conversion rates in the different tissues were 68.20%-90.70%.
| Citation: | YU Fang Fang, LIN Xia Lu, YANG Lei, LIU Huan, WANG Xi, FANG Hua, Mikko J. LAMMI, GUO Xiong. Comparison of T-2 Toxin and HT-2 Toxin Distributed in the Skeletal System with That in Other Tissues of Rats by Acute Toxicity Test[J]. Biomedical and Environmental Sciences, 2017, 30(11): 851-854. doi: 10.3967/bes2017.115

|

 Quick Links
 DownLoad: