


HTML
-
Inevitable among oncology patients, malnutrition and weight loss must be taken seriously. Poor nutritional status can increase the risk of complications, decrease treatment response and tolerance, and lower both the survival rate and overall quality of life[1, 2]. As the disease progresses, the incidence of malnutrition among oncology patients increases to 85% from approximately 30% at initial diagnosis[3, 4]. Cancer patients with a score of more than 10 points had a 30.7-fold increase in the probability of death, and the mortality rate was 52.1% in the first year[5]. Previous studies have indicated that these deaths were due to malnutrition rather than disease-related causes, and the changes in body composition had a negative effect on the response to cancer treatment[4, 6]. Therefore, early identification of patients at risk of malnutrition will help provide early nutritional support, improve tolerance to treatment, reduce or prevent adverse outcomes, and improve quality of life throughout the clinical process[7, 8].
The Patient-Generated Subjective Global Assessment (PG-SGA) is a questionnaire that includes six aspects focusing on the nutritional status of cancer patients[9]. Based on their scores, patients can be divided into three categories: SGA-A (PG-SGA ≤ 1, well nourished), SGA-B (2 ≤ PG-SGA ≤ 8, moderately malnourished), and SGA-C (PG-SGA ≥ 9, severely malnourished). The PG-SGA is currently considered the most appropriate tool for screening and evaluating the nutritional status of cancer patients in clinical studies[10]. The Nutritional Risk Screening (NRS-2002) tool, used to identify patients at risk of malnutrition, emphasizes nutritional interventions before the clinical symptoms of malnutrition are obvious[11]. NRS-2002 results can also be classified according to the total nutritional score. A total score ≥ 3 points is defined as nutritional risk[6]. The European Organization for Research and Treatment of Cancer Quality of Life Core Questionnaire 30 (EORTC QLQ-C30) is composed of 30 items for patients with common clinical malignant tumors. The questionnaire involves five functional aspects (physical, cognitive, role, social, and emotional) and three symptom scales (fatigue, vomiting, and pain and nausea)[12, 13]. This study focused on 11 items ('Did you feel tired?' 'Has your life been affected?' 'Did you have difficulty with memory?' 'Did you have a bad temper?' 'Has your economic status been affected by your physical condition?') to determine quality of life. Although a variety of methods have been used to assess nutritional status, there are no gold standard criteria for defining malnutrition in these patients[14].
It is important to note that nutritional screening should be closely monitored for patients at nutrition risk. This study was performed to assess the utility of two simple screening tools and provide suggestions to improve the quality of life of patients with malnutrition.
-
In our present observational study, the PG-SGA, NRS-2002, and EORTC QLQ-C30 were utilized to evaluate the nutritional status of cancer patients. The patients recruited to participate in the study were receiving chemotherapy, radiotherapy, surgery, or combination therapy or had completed treatment and were being followed up. The 312 patients enrolled in the study, comprising 149 men and 163 women in the age group of 24-112 years, provided informed consent. The patients selected were required to be able to complete these questionnaires independently.
-
Data regarding age, sex, education, TNM stage, and nutrition support were obtained from hospital records. The anthropometric measurements and biological parameters included body mass index (BMI), triceps skin fold thickness (TSF), albumin, and total protein. BMI was calculated according to World Health Organization guidelines[15] with weight in kilograms and height in meters: BMI = kg/m2; patients were defined as underweight (BMI < 18.5), normal weight (BMI 18.5-22.9), overweight (BMI 23-24.9), or obese (BMI > 25). The TSF was measured midway between the acromion and the olecranon, and patients who were ≤ 5th percentile were classified as malnourished[16]. Albumin is commonly considered a better indicator of patient nutritional status and is an important indicator of complications and mortality. Malnutrition is defined as an albumin level < 35 g/L for oncology patients. All the measurements and parameters were evaluated at least three times, and the mean of the measurement results was recorded as the last value.
-
Quantitative indicators with a normal distribution are presented as mean ± SD. If the variance was equal, the probability value was calculated using the independent samples t-test. However, if the variance was unequal or the data were not normally distributed, the probability value was calculated using the median (range). If the data were normally distributed and the variance was equal, analysis of variance was used to compare three groups, or the probability value was calculated by the Kruskal-Wallis nonparametric test. The values of κ ranged from 0-1. Spearman correlation analysis was conducted. All statistical tests were two-sided, and a probability value < 0.05 indicated statistical significance.
Patients
Nutritional Status
Statistical Analysis
-
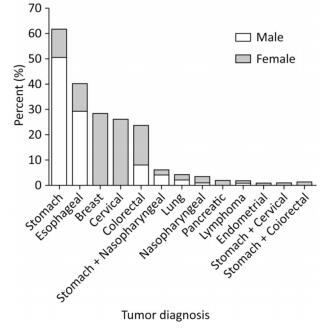
The different types of cancers and the percentage of men and women in each tumor group are summarized in Figure 1. Stomach cancer, accounting for more than 50% of the cases, was the most common tumor among the studied patients. In addition, breast and stomach cancer ranked first in female and male patients, respectively.

Figure 1. The proportion of different types of tumors in male and female patients.
The baseline clinical characteristics are shown in Table 1. Our study consisted of 312 oncology patients, and there were 163 women (median age: 55 years, age range: 28-85) and 149 men (median age: 64 years, age range: 24-90). The overall patient albumin level was lower than the normal value. It is noteworthy that the educational level of 204 (65.38%) of the 312 patients was primary school, and only 5 (1.60%) had attended university. The data indicate that more than half of the patients did not accept nutritional support, which was possibly related to educational status.
Items Male (n = 149) Female (n = 163) Total (n = 312) P Value Age, y 62.77 ± 12.00 55.15 ± 10.40 58.79 ± 11.80 < 0.001 64 (24, 90) 55 (28, 85) 59 (24, 90) < 0.001 BMI, kg/m2 21.0 ± 3.5 23.2 ± 4.1 22.2 ± 4.0 < 0.001 20.6 (14.4, 33.2) 22.9 (14.1, 37.4) 22.0 (14.1, 37.4) < 0.001 Ablumin, g/L 24.10 ± 4.80 26.20 ± 4.41 25.20 ± 4.71 < 0.001 24 (5, 45) 26 (6, 39) 25 (5, 45) < 0.001 TSF, mm 13.7 ± 7.6 18.7 ± 8.4 16.3 ± 8.4 < 0.001 11 (3, 50) 18 (1.7, 45) 15 (1.7, 50) < 0.001 Total protein, g/L 20.5 ± 4.9 21.9 ± 10.9 21.2 ± 8.6 0.155 20.30 (4.10, 35.58) 20.86 (4.70, 149.20) 20.60 (4.10, 149.20) 0.246 Education [n(%)] 0.065 Primary school 88 (59.06) 116 (71.17) 204 (65.38) Junior high school 41 (27.52) 27 (16.56) 68 (21.79) High school 16 (10.74) 19 (11.66) 35 (11.22) University 4 (2.68) 1 (0.61) 5 (1.60) Tumor diagnosis [n(%)] Stomach cancer 76 (51.01) 17 (10.43) 93 (29.81) Esophageal cancer 44 (29.53) 17 (10.43) 61 (19.55) Breast cancer 0 (0) 46 (28.22) 46 (14.74) Cervical cancer 0 (0) 42 (25.77) 42 (13.46) Colorectal cancer 13 (8.72) 24 (14.72) 37 (11.86) Stomach + Nasopharyngeal cancer 7 (4.70) 2 (1.23) 9 (2.88) lung cancer 4 (2.68) 2 (1.23) 6 (1.92) Nasopharyngeal cancer 2 (1.34) 3 (1.84) 5 (1.60) Pancreatic cancer 0 (0) 2 (1.23) 2 (0.64) Lymphoma 2 (1.34) 0 (0) 2 (0.64) Endometrial cancer 0 (0) 1 (0.61) 1 (0.32) Stomach + Cervical cancer 0 (0) 1 (0.61) 1 (0.32) Stomach + Colorectal cancer 1 (0.67) 0 (0) 1 (0.32) Note. BMI: Body mass index; TSF: Triceps skinfold thickness; P < 0.05, determined by Kruskal-Wallis nonparametric test. Table 1. Baseline and Clinical Characteristics of Participants
There was concordance between albumin level and the PG-SGA and NRS-2002 screening tool parameters (Table 2). The PG-SGA score had a higher sensitivity (93.73%) and lower specificity (2.30%) than the NRS-2002 (69.31% and 25.00%, respectively). When the two measurement methods were compared to albumin, there was better agreement between albumin and the NRS-2002 (κ = 0.004, P = 0.0005) than between albumin and the PG-SGA (κ = 0.003, P = 0.0006).
Items PG-SGA NRS-2002 At Risk (B+C) No Risk (A) Total At Risk (NRS-2002 ≥ 3) No Risk (NRS-2002 < 3) Total At risk (albumin < 35 g/L) 284 19 303 210 93 303 No risk (albumin ≥ 35 g/L) 8 0 8 6 2 8 Total 292 19 311 216 95 311 Sensitivity (%) 93.73 (284/303) 69.31 (210/303) Specificity (%) 2.30 (0/8) 25.00 (2/8) κ = 0.003, P = 0.0005 κ = 0.004, P = 0.0006 Note. PG-SGA: Patient Generated Subjective Global Assessment; NRS-2002: Nutritional Risk Screening; P Values were determined by Chi-square test. Table 2. Comparisons of Albumin and Evaluating Tools: PG-SGA and NRS-2002 vs. Albumin
Table 3 shows the low negative correlation between PG-SGA and NRS-2002 scores among the enrolled patients. The PG-SGA better correlated with BMI and TFS than did the NRS-2002 for both male and female patients. However, these results were the opposite of the albumin data. There was a weak positive correlation with albumin for both the PG-SGA and NRS-2002 among women. Furthermore, there was a substantial similarity between the PG-SGA and NRS-2002 for the evaluation of nutritional status.
Items PG-SGA [A/(B+C)] NSR-2002 (< 3/≥ 3) Male Female Male Female Correlation P Value Correlation P Value Correlation P Value Correlation P Value BMI, kg/m2 0.230 0.005 0.259 0.001 0.304 < 0.001 0.301 < 0.001 TSF, mm 0.214 0.009 0.276 < 0.001 0.289 < 0.001 0.316 < 0.001 Total protein, g/L 0.059 0.471 0.172 0.029 0.029 0.724 0.107 0.176 Albumin, g/L 0.070 0.395 0.326 < 0.001 0.065 0.431 0.319 < 0.001 NRS-2002 score -0.240 0.003 -0.410 < 0.001 Note. PG-SGA: Patient Generated Subjective Global Assessment; NRS-2002: Nutritional Risk Screening; BMI: Body mass index; TSF: Triceps skinfold thickness; P value was determined with Spearman correlation analysis. Table 3. P Value and Correlation Co-effcients from Data and Screening Tools according to Sex
We used the risk and no-risk end results (PG-SGA and NRS-2002) to analyze the factors affecting outcome. The factors evaluated included sex, age, BMI, albumin, total protein, and TFS. We utilized a single factor logistic regression analysis (P < 0.05) and a multifactor logistic regression analysis (forward LR method). The results indicated that only BMI and TFS had a significant difference for both the PG-SGA and NRS-2002 (PPG-SGA < 0.001, PNRS-2002 < 0.001, Table 4).
Items Univariate Analysis Multivariate Analysis OR (95% CI) P Value OR (95% CI) P Value PG-SGA Gender (male as reference) 0.189 (0.054-0.662) 0.009 Age, y 1.057 (1.014-1.101) 0.009 BMI, kg/m2 0.777 (0.694-0.871) < 0.001 0.845 (0.741-0.964) 0.012 Albumin, g/L 0.830 (0.751-0.918) < 0.001 TSF, mm 0.894 (0.851-0.939) < 0.001 0.927 (0.876-0.981) 0.009 Total protein, g/L 0.990 (0.954-1.027) 0.591 NRS-2002 Gender (male as reference) 0.380 (0.229-0.632) < 0.001 Age, y 1.044 (1.021-1.068) < 0.001 BMI, kg/m2 0.830 (0.775-0.888) < 0.001 0.904 (0.836-0.978) 0.012 Albumin, g/L 0.888 (0.837-0.942) < 0.001 TSF, mm 0.906 (0.877-0.936) < 0.001 0.926 (0.892-0.961) < 0.001 Total protein, g/L 0.998 (0.971-1.026) 0.910 Note. PG-SGA: Patient Generated Subjective Global Assessment; NRS-2002: Nutritional Risk Screening; BMI: Body mass index; TSF: Triceps skinfold thickness; P value was determined with Logistics regression analysis. Table 4. Analyze Factors to Affect Outcomes According to Logistics Regression Analysis
The PG-SGA score in Figure 2 shows that the prevalence of malnutrition among the studied oncology patient population reached 94% (SGA-B and SGA-C). The incidence of malnutrition in cancer patients is usually directly related to the tumor, causing abnormal body metabolism or adverse physical reactions after receiving a cancer diagnosis. These reactions may include depression, anxiety, and loss of appetite.
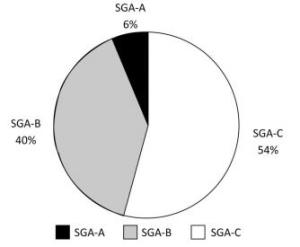
Figure 2. The percentage of patients classified into each nutritional status by the PG-SGA.
The sex, age, PG-SGA score, and BMI for SGA classifications are shown in Table 5. The SGA-C group contained the majority of the total population, and the number of men was greater than that of women, which is consistent with Figure 2. The SGA-C group is defined as severely malnourished patients with the highest scores, and there was a significant difference in the median PG-SGA score for each of the SGA classifications (P < 0.001). In addition, the SGA-C group had the lowest BMI and the median age was 63 years. These results led us to focus on malnutrition specifically in the elderly population. These four indicators were all statistically significant (P < 0.001).
PG-SGA SGA-A SGA-B SGA-C P Value N (%) 19 (6.1) 126 (40.4) 167 (53.5) Gender (M/F) 3/16 45/81 101/66 < 0.001 Age, y (x̅ ± s; median, IQR) 51.84 ± 10.28 56.46 ± 11.92 61.33 ± 11.29 < 0.001 52 (36, 69) 55 (28, 112) 63 (24, 90) < 0.001 SGA score (median, IQR) 1 (1, 1) 6 (2, 8) 12 (9, 22) < 0.001 BMI, kg/m2 (x̅ ± s; median, IQR) 26.40 ± 3.02 23.47 ± 4.01 20.70 ± 3.29 < 0.001 25.8 (22.90, 33.20) 23.0 (15.62, 37.40) 20.4 (14.10, 31.30) < 0.001 Note. PG-SGA: Patient Generated Subjective Global Assessment; IQR: Interquartile range; BMI: Body mass index; SGA-A rating in well-nourished patients, SGA-B rating in moderately malnourished patients, SGA-C rating in severely malnourished patients; P value was determined by ANOVA variance analysis. Table 5. Comparisons of Clinical Indicators According to PG-SGA
We also comprehensively assessed patient malnutrition using the EORTC QLQ-C30 to determine quality of life. As shown in Table 6, our study concentrated on various life changes due to cancer, such as memory, economic status, depression, and fatigue. We investigated 11 separate items and found that the majority of the target population had 2 points for each item. This result suggests that the quality of life of cancer patients is affected by their disease. These findings are consistent with the PG-SGA scores.
Items Number of Patients [n (%)] Total patients 310 (100.00) Tired 1 77 (24.84) 2 186 (60.00) 3 43 (13.87) 4 4 (1.29) Affect daily life 1 75 (24.19) 2 177 (57.10) 3 53 (17.10) 4 5 (1.61) Have difficulty concentrating on doing things 1 71 (22.90) 2 198 (63.87) 3 38 (12.26) 4 2 (0.65) Nervous 1 84 (27.10) 2 199 (64.19) 3 25 (8.06) 4 2 (0.65) Worried 1 80 (25.81) 2 199 (64.19) 3 28 (9.03) 4 3 (0.97) Bad temper 1 90 (29.03) 2 181 (58.39) 3 36 (11.61) 4 3 (0.97) Repressed 1 67 (21.61) 2 206 (66.45) 3 33 (10.65) 4 4 (1.29) Memory difficult 1 76 (24.51) 2 190 (61.29) 3 42 (13.55) 4 2 (0.65) Family life affected by physical condition 1 35 (11.29) 2 189 (60.97) 3 77 (24.84) 4 9 (2.90) Social activity affected by Physical condition 1 33 (10.65) 2 184 (59.36) 3 84 (27.10) 4 9 (2.90) Economy affected by Physical condition 1 22 (7.10) 2 147 (47.42) 3 105 (33.87) 4 31 (10.00) 5 5 (1.61) Note. EORTC QLQ-C30: European organization for research and treatment of cancer quality of life core questionnaire 30. Table 6. Life Quality of Patients by Assessment Tool
-
Malnutrition is a widespread problem in cancer patients worldwide, but regrettably, its existence has not attracted adequate attention from patients, families, or medical teams. Recent studies have demonstrated that up to 85% of cancer patients experience malnutrition and its consequences during the course of cancer treatment[17, 18]. The effects of cancer treatment manifest late, and many factors, including emotional stress, physical conditions, cancer itself, and side effects of cancer, result in malnutrition[19, 20]. Previous studies have reported that nutrition significantly reduces the side effects of diseases and improves both the prognosis of treatment and the patient's quality of life[21]. In addition, the implementation of an early nutrition detection and intervention strategy can reduce many tumor complications and improve patient nutritional status[19, 22]. Therefore, determining the relationship between nutrition and cancer is imperative, and suitable tools to quickly ascertain nutritional status are critical.
The main aims of this study were to evaluate the nutritional status of malnourished oncology patients using different assessment tools and to find mutual associations between malnutrition and quality of life. Surprisingly, our data show that the proportion of malnutrition was 94% with the PG-SGA screening tool (Figure 2) and that the rate of university graduates among the participants was very low (1.6%). These results were consistent with those of the EORTC QLQ-C30. The majority of patients were middle-aged and elderly, and there was no consideration of malnutrition when receiving cancer treatment owing to limited knowledge. Generally, the majority of patients are defined as not being at risk of malnutrition without using accurate detection tools or are being assessed and miss timely treatment[23], which can reduce quality of life.
Anthropometric indicators and individual nutritional indexes are not used for nutritional evaluation owing to their own limitations[24]. Therefore, a comprehensive nutritional assessment tool is necessary for patients with a malignancy. In clinics, numerous nutritional screening tools have been used to identify patients at risk of malnutrition; these include the PG-SGA, NRS-2002, Nutrition Risk Index, and Mini Nutritional Assessment. However, no single approach has been adopted by consensus[16]. The conclusion arrived at with the PG-SGA in the present study was concordant with that reached with the NRS-2002 (P < 0.05) when analyzing the factors affecting at risk/no risk as outcomes of the two screening tools. However, 93.9% of patients were classified as malnourished by the PG-SGA, whereas the NRS-2002 identified only 69.5% of patients as being at risk for malnutrition. The adverse factors influencing nutritional status were recorded with the scored PG-SGA[25]. Thus, our study suggests that the PG-SGA is more suitable than the NRS-2002 for detecting malnutrition risk associated with malignancy. We also found that while the QLQ-C30 score was related to the PG-SGA score, it was inconsistent. The outcomes of the screening tools showed differences resulting from their different perspectives toward malnutrition. Prior studies have demonstrated that the PG-SGA can accurately distinguish well-nourished patients from malnourished patients[26], and its continuous scoring system allows it to identify patients who require urgent treatment[14].
An accurate and early screening tool is critical for detecting nutrition disorders and will prevent or minimize symptoms and reduce treatment costs by using effective measures during oncologic treatment[1, 27]. Our data highlight the significance and necessity of identifying malnutrition status with the PG-SGA and NRS-2002. Nutrition evaluations and interventions are new areas for oncologists and require professional expertise, which will help medical teams design appropriate treatments that will ultimately improve the quality of life of people with cancer. Our data suggest that oncologists and nutrition specialists should work together to regularly provide malnutrition knowledge to communities and in hospitals, particularly for middle-aged and elderly patients with lower educational levels. Furthermore, changes in feeding patterns after consultation with professionals can also help malnourished patients[22]. Although nutritional support has no significant effects on treatment for patients with end-stage malignancies, appropriate oral nutrition support will provide comfort. Comfort feeding only fully respects the rights of patients choosing to improve their quality of life and to receive eating comfort based on artificial feeding as much as possible or until the patient can no longer ingest oral food and shows respiratory distress[28].
However, another factor, entities of different cancers, must also be paid close attention. This includes cause of cancer, mechanism of cancer, and median of lifetime and may exert effects on screening tool scores to some extent. As stressed above, malnutrition is a key factor in assessing quality of life, but malnutrition may alter during the timeline of the cancer. For example, P. Probst discovered that the malnutrition scores of pancreatic patients lost the values after surgery[29]. These factors must be considered when assessing nutrition status among tumor patients.
Owing to multifactorial malnutrition causes and the lack of confirmation of their sensitivity, specificity, and cost-effectiveness, a combination of screening tools should be used[9, 30, 31]. These tools will improve the benefits of monitoring malnutrition in a busy clinical setting and provide rapid insight into a patient's symptoms.
-
The PG-SGA is more accurate than the NRS-2002 when assessing the nutrition status of patients with a malignancy. The results will be beneficial when combined with the EORTC QLQ-C30.
-
The authors declare no conflict of interest.
the National Natural Science Foundation of China 81273061

 Quick Links
 DownLoad:
