


-
Pulsed microwaves are widely used in radar, navigation, and communication. The average power density is low at narrow pulse widths or large pulse intervals, but pulsed microwaves at certain peak densities exert numerous biological effects, including auditory effects. The peak threshold values at which pulsed microwaves begin to exert auditory effects in humans at pulse widths of 425 MHz, 125-1, 000 μs; 1, 245 MHz, 10-70 μs; 2, 450 MHz, 1-32 μs; and 3, 000 MHz, 1-100 μs are 229-271 mW/cm2, 60-80 mW/cm2, 64 mW/cm2, and 5, 000 mW/cm2, respectively, whereas the threshold value of microwaves at 8.9 GHz is > 25 W/cm2[1]. Threshold values vary among studies because of the use of different microwave-exposure parameters (e.g., frequency, pulse width, repetitions per second). Therefore, the International Commission of Non-ionizing Radiation Protection (ICNIRP) employs a spherical model based on thermoelastic theory and biophysics dose calculation to deduce the peak limits of microwaves of different frequencies. For example, the peak limit for frequencies exceeding 10 MHz should not exceed 1000-fold higher than the reference level over 6 min. However, whether limits based on the auditory effect theory are sufficient to prevent adverse effects must be determined because the use of appliances that emit pulsed microwaves with very high incident peak powers is increasing. Because little information is available on the relationship between the biological effects and peak values of pulsed fields with the same average power density, exploring this relationship to define the peak exposure limits is crucial. The nervous and immune systems, the two main controlling systems for sustaining internal balance of the body, which are closely coordinated and mutually regulated, are the most sensitive to microwaves and closely related to cancer. Furthermore, behaviors such as avoidance, the monoamine neurotransmitter content, and immune factors in serum have been widely used as indicators of nerve and immune function abnormalities produced by diseases or physical stresses[2-4]. Thus, this study focused on the associations between peak power density and its effects on the behavior and serum levels of neurotransmitters [dopamine (DPA), norepinephrine (NE), and 5-hydroxytryptamine (5-HT)] and immune factors [interleukin (IL)-2, IL-4, IL-8, tumor necrosis factor (TNF)-α, interferon (IFN)-α, and IFN-β]. The specific energy absorption rate (SAR) was 0.4 W/kg according to the ICNIRP guidelines for safe exposure levels to microwave radiation[5, 6]. Thus, rats were radiated with 1, 200 MHz microwaves at an average power density of 1.2 mW/cm2 (ICNIRP exposure reference level extrapolated to rats) and the effects on nerve and immune function at different peak values of 1, 200 mW/cm2 (according to the ratio of 1, 000 times the peak limit to the ICNIRP reference level) and its multiples were evaluated, with the aim of assessing the rationality of the peak exposure limit of pulsed electromagnetic fields.
The experiment was conducted with 144 male Wistar rats (180-220 g), sixteen of which were acoustic conditioned reflex rats (conditioned rats) that were trained to escape in the presence of high-frequency acoustic clicks [15 kHz, 70 dB, 10 pulses per second (pps)] to achieve crossing accuracy rates of greater than 80%. The remaining rats were not trained (normal rats). The model of the microwave exposure source was MV2.016.206, manufactured by Wuhu Glory Electronics Limited Cooperation. Normal and conditioned rats were randomly divided into sham-exposure or exposure groups (n = 8 per group). Rats in the conditioned and normal exposure groups were exposed to pulsed microwaves (1, 200 MHz; pulse width, 10 μs; repetition rate, 10 pps) at a peak power density of 600 mW/cm2. Furthermore, the rats in the normal exposure groups were radiated with pulsed microwaves (1, 200 MHz; average power density, 1.2 mW/cm2; repetition rate, 10 pps; SAR, 0.4 W/kg) at a peak power density of 600, 1, 200, or 2, 400 mW/cm2. The exposure parameters are listed in Supplementary Table S1 (available in www.besjournal.com). Rats in the sham-exposure groups were processed in parallel with those in the exposure group but were not exposed to microwaves. In shuttle behavior analysis, each rat was transferred into a plexiglass shuttle box, one-half of which (Box B) was shielded from microwaves, from the exposure side (Box A). After 2 min of adaptation, the rat was exposed for 10 min to pulsed 1, 200 MHz microwaves once daily for 6 days. The exposure groups were processed as listed in Supplementary Table S2 (available in www.besjournal.com). The cumulative time a rat spent in Box A (cumulative time in Box A), the number of crossings between Box A and Box B (number of crossings), the latency of crossing from Box A to Box B for the first time (latency), and the number of animals staying in Box B longer than in Box A divided by the total number of shuttle experiments (rate of preference of staying in Box B) during the 10 min exposure were measured. To estimate serum indicators, animals in the exposure groups were placed in plexiglass cages with apertures and partitions, followed by placement at a distance of 30 cm from the exposure source. The whole body of the rats was exposed to microwaves with the body axes oriented parallel to the electric field polarization[7]. The rats were radiated for 0.5 h daily for 7 days. Rats were sacrificed on Days 1, 3, and 7 of radiation, and venous blood was collected. The levels of neurotransmitters (DPA, NE, and 5-TH) and immune factors (IL-2, IL-4, IL-8, TNF-α, IFN-α, and IFN-β) were determined using enzyme-linked immunosorbent assays. The difference in the rate of preference for staying in Box B between the sham-exposure and exposure groups was evaluated using the χ2 test. Changes in the rats' shuttle behaviors (latency, cumulative time in Box A, and number of crossings) and the serum levels of neurotransmitters and immune factors were subjected to two-way analysis of variance (ANOVA), in which the number of days was the repeated factor. Multiple comparisons were performed using Fisher's protected least significant difference test. All statistical procedures were conducted using the Statistical Package for the Social Sciences (ver. 19.0; SPSS Inc., Chicago, IL, USA), and a value of P < 0.05 indicated statistical significance.
Groups Frequency
(MHz)Pulse Width
(μs)Repetition Rate (pps) Peak Value
(mW/cm2)Averagevalue
(mW/cm2)SAR
(W/kg)Sham-exposed group of normal rats - - - 0 0 0 Sham-exposed group of conditioned rats - - - 0 0 0 Exposure groups of normal rats Group A 1, 200 200 10 600 1.2 0.4 Group B 1, 200 100 10 1, 200 1.2 0.4 Group C 1, 200 50 10 2, 400 1.2 0.4 Exposure group of conditioned rats 1, 200 10 10 600 0.06 0.02 Table Supplementary Table S1. Microwave Radiation Parameters of the Experimental Groups
Day Exposure Turn 1 0, A, B, C 2 A, B, C, 0 3 B, C, 0, A 4 C, 0, A, B 5 0, A, B, C 6 A, B, C, 0 7 B, C, 0, A Note. 0, A, B, and C: sham-exposed group, group A, group B, and group C, respectively. In order to exclude the effect of time on animal behavior, the daily experiment time was divided into 4 sections. 4 groups, with 2 animals per group (rather than 8 animals in one group) in each section were carried out according to the group sequence listed in the table, which was rotated every day. Table Supplementary Table S2. Exposure Order of the Four Groups in the Shuttle Behavior Experiment
As shown in Table 1 and Supplementary Table S3 (available in www.besjournal.com), shuttle-box testing of the conditioned rats revealed that the cumulative time in Box A of the exposure group (Days 3-6) was shorter than that of the sham-exposure group on the same day, and was significantly lower on Day 6, decreasing to 45.6% compared with that in the sham-exposure group (P < 0.05). The results also showed that the rates of preference for staying in Box B on Days 1-6 were higher in the exposure group, at 57.1%, 57.1%, 71.4%, 75.0%, 75.0%, and 87.5% compared with 42.9%, 50.0%, 50.0%, 37.5%, 50.0%, and 50.0% in the sham-exposure group, respectively, although the difference was not significant. However, the preference for staying in Box B for 6 days in the exposure group was significantly higher than that in the sham-exposure group (71.1% vs. 46.8%, P < 0.05) because of the larger samples. Thus, 1, 200 MHz pulsed microwaves (pulse width, 10 μs; peak power density, 600 mW/cm2, 10 pps) decreased the cumulative time in Box A and increased the rate of preference for staying in Box B to 71.1%, similar to crossing accuracy rates (over 80%) responding to acoustic clicks, suggesting that pulsed microwaves produced acoustic effects. However, the results of normal rats in Table 1 showed that the pulsed microwaves did not significantly affect the cumulative time in Box A, demonstrating they did not induce escape. As shown in Supplementary Figure S1 (available in www.besjournal.com), shuttle-box testing of the normal rats showed that the latencies of rats exposed to 1, 200 MHz pulsed microwaves (pulse width, 10 μs; repetition rate, 10 pps; average power density, 1.2 mW/cm2; peak power densities, 600, 1, 200, and 2, 400 mW/cm2) did not differ significantly from those in sham-exposure rats on the same day. The results in Supplementary Figure S2 (available in www.besjournal.com) show that the cumulative time spent in Box A in the exposure groups did not differ significantly from that in the sham-exposure groups on the same day. The number of crossings in each exposure group showed an overall decrease with an increase in the number of exposure times because of a decrease in exploring capabilities. The number of crossings on the same day did not differ significantly between the sham-exposure and exposure groups (Figure 1). The results demonstrated that the pulsed microwaves did not induce escape. The levels of IL-2, IL-4, IL-8, TNF-α, IFN-α, and IFN-β on Days 1, 3, and 7 of exposure did not differ significantly between the sham-exposure and exposure groups (pulse width, 10 μs; repetition rate, 10 pps; average power density, 1.2 mW/cm2; peak power densities, 600, 1, 200, and 2, 400 mW/cm2) (Table 2 and Supplementary Table S4 available in www.besjournal.com). The DPA, NE, and 5-HT levels on Days 1, 3, and 7 of exposure also showed no significant difference between the sham-exposure and exposure groups (Supplementary Table S5 available in www.besjournal.com).
Groups Cumulative Time in Box A (s) Day 1 Day 2 Day 3 Day 4 Day 5 Day 6 Sham-exposed group of conditioned rats 286.6 ± 23.6 232.8 ± 31.0 333.6 ± 46.1 356.8 ± 62.7 370.1 ± 43.5 329.4 ± 56.3 Exposure group of conditioned rats 323.1 ± 48.8 235.9 ± 30.2 277.8 ± 26.0 283.1 ± 41.4 284.0 ± 52.8 179.3 ± 39.1* Sham-exposed group of normal rats 263.1 ± 17.5 207.9 ± 46.7 220.9 ± 37.1 248.3 ± 36.6 240.1 ± 48.6 212.6 ± 31.9 Exposure group of normal rats 239.8 ± 29.5 264.5 ± 28.7 220.9 ± 30.5 198.8 ± 26.9 239.3 ± 45.4 230.4 ± 29.3 Note. *P < 0.05, compared with sham-exposed group on the same day; All data shown are mean ± standard error (SE), n = 8, two-way ANOVA. Table 1. The Effects of 1, 200 MHz Pulsed Microwaves (10 µs Pulse Width, 10 pps, 600 mW/cm2 Peak Power Density) on Cumulative Time in Box A (Average of One Day) of Conditioned Rats in Shuttle Box Test
Groups Rate of Preference of Staying in Box B per Day (%) Total Times Analysis of the Six Days Day 1 Day 2 Day 3 Day 4 Day 5 Day 6 Times of preference of staying at Box B Times of preference of staying at Box A Rate of preference of staying at Box B (%) Sham-exposed group 42.9 50.0 50.0 37.5 50.0 50.0 22 25 46.8 Exposure group 57.1 57.1 71.4 75.0 75.0 87.5 32 13 71.1* Note. *P < 0.05, compared with sham-exposed group, n = 8, χ2-test. Table Supplementary Table S3. The Effects of 1, 200 MHz Pulsed Microwave (10 µs Pulse Width, 10 pps, 600 mW/cm2 Peak Power Density) on Rate of Preference of Staying in Box B (%) of Conditioned Rats in the Shuttle Box Test
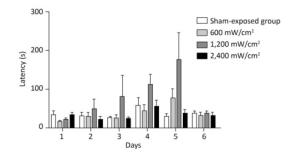
Figure Supplementary Figure S1. The latencies of normal rats in the sham-exposure group and those exposed to 1, 200 MHz pulsed microwaves at a repetition rate of 10 pps at different peak-power densities with the same average power density of 1.2 mW/cm2. All data are presented as the mean ± standard error of the mean (n = 8), as assessed in a two-way analysis of variance.
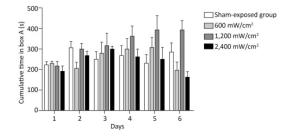
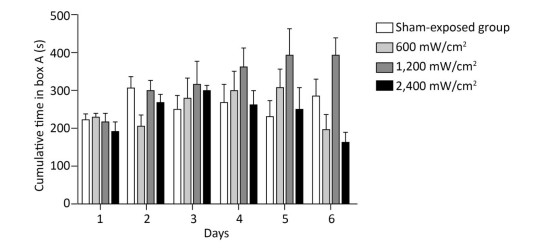
Figure Supplementary Figure S2. Cumulative time spent in Box A of normal rats in the sham-exposure group and those exposed to 1, 200 MHz pulsed microwaves at a repetition rate of 10 pps at different peak-power densities with the same average power density of 1.2 mW/cm2. All data are presented as the mean ± standard error of the mean (n = 8), as assessed in a two-way analysis of variance.
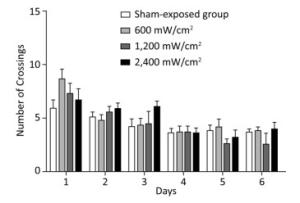
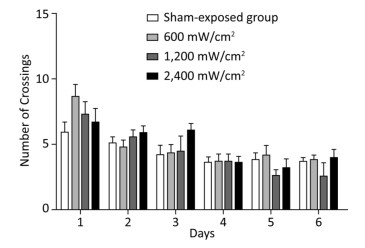
Figure 1. Number of crossings of normal rats in the sham-exposure group and those exposed to 1, 200 MHz pulsed microwaves at a repetition rate of 10 pps at different peak-power densities with the same average power density of 1.2 mW/cm2. All data are presented as the mean ± standard error of the mean (n = 8), as assessed in a two-way analysis of variance.
Groups (peak-power density) Blood Sampling IL-2 (pg/mL) IL-4 (pg/mL) IL-8 (pg/mL) Sham-exposed group Day 1 747.43 ± 101.77 2170.25 ± 721.02 758.45 ± 156.92 Day 3 588.98 ± 158.75 2716.28 ± 488.23 559.50 ± 67.52 Day 7 694.37 ± 86.72 2099.75 ± 257.98 651.92 ± 150.16 Exposure groups Group A (600 mW/cm2) Day 1 548.07 ± 122.20 2214.23 ± 240.20 470.70 ± 99.98 Day 3 556.53 ± 85.24 1335.42 ± 427.63 447.77 ± 131.81 Day 7 657.30 ± 42.03 2244.27 ± 580.30 623.08 ± 180.84 Group B (1, 200 mW/cm2) Day 1 709.07 ± 56.57 2541.95 ± 322.37 646.93 ± 98.65 Day 3 504.58 ± 42.57 2114.05 ± 579.91 513.17 ± 83.22 Day 7 660.58 ± 36.05 2345.92 ± 574.17 559.88 ± 99.69 Group C (2, 400 mW/cm2) Day 1 786.10 ± 77.82 2521.60 ± 219.55 647.38 ± 41.80 Day 3 750.07 ± 24.93 2688.52 ± 290.10 612.23 ± 215.23 Day 7 670.55 ± 89.37 1795.07 ± 462.37 356.13 ± 117.72 Note.All data shown are mean ± SE, n = 8, two-way ANOVA. Table 2. The Levels of Interleukin (IL)-2, IL-4, and IL-8 in Normal Rat's Blood Serum after Exposure to Pulsed Microwaves (1, 200 MHz, 10 pps) at Different Peak-power Densities with the Same Average Power Density of 1.2 mW/cm2
Groups
(peak-power density)Blood Sampling TNF-α (pg/mL) IFN-α (pg/mL) IFN-β (pg/mL) Sham-exposed group Day1 1922.03 ± 179.93 754.95 ± 137.58 1018.90 ± 139.07 Day3 1584.67 ± 246.28 397.92 ± 55.99 857.70 ± 200.21 Day7 1559.92 ± 245.12 284.58 ± 72.87 1022.53 ± 186.12 Exposure groups Group A (600 mW/cm2) Day1 1361.72 ± 226.68 421.07 ± 130.13 743.60 ± 176.84 Day3 1371.42 ± 106.54 421.55 ± 125.76 1002.38 ± 130.28 Day7 1022.45 ± 97.15 323.45 ± 57.13 406.88 ± 219.29 Group B (1, 200 mW/cm2) Day1 1382.63 ± 98.33 396.28 ± 55.37 1040.30 ± 96.22 Day3 1823.52 ± 74.23 422.83 ± 61.20 1227.60 ± 223.69 Day7 1435.07 ± 134.61 388.18 ± 97.37 1007.00 ± 171.05 Group C (2, 400 mW/cm2) Day1 1456.05 ± 170.74 636.62 ± 38.16 634.22 ± 197.82 Day3 1877.10 ± 305.31 399.68 ± 58.88 1049.36 ± 127.64 Day7 1407.28 ± 162.73 287.67 ± 38.61 1506.22 ± 75.14 Note.All data shown are mean ± SE, n = 8, two-way ANOVA. Table Supplementary Table S4. The Content of Tumor Necrosis Factor (TNF)-α, Interferon (IFN)-α, and IFN-β in Normal Rat's Blood Serum after Exposure to Pulsed Microwaves (1, 200 MHz, 10 pps) at Different Peak-power Densities with the Same Average Power Density of 1.2 mW/cm2
Groups Days DPA (ng/mL) NE (ng/mL) 5-HT (ng/mL) Sham-exposed group Day1 38.80 ± 16.58 30.23 ± 8.25 107.78 ± 5.95 Day3 30.62 ± 4.46 37.65 ± 11.17 88.90 ± 14.10 Day7 54.82 ± 23.67 39.93 ± 9.54 71.87 ± 7.34 Exposure groups Group A (600 mW/cm2) Day1 18.52 ± 8.86 21.80 ± 9.24 87.93 ± 14.29 Day3 28.50 ± 9.86 41.95 ± 9.39 84.30 ± 6.90 Day7 37.97 ± 19.01 20.90 ± 3.70 72.88 ± 5.75 Group B (1, 200 mW/cm2) Day1 35.70 ± 6.49 32.98 ± 4.88 108.12 ± 11.93 Day3 46.67 ± 11.61 66.83 ± 7.75 104.48 ± 15.19 Day7 34.80 ± 10.63 52.72 ± 3.93 75.45 ± 7.01 Group C (2, 400 mW/cm2) Day1 29.82 ± 5.92 31.50 ± 4.98 109.02 ± 6.87 Day3 56.75 ± 9.33 57.25 ± 6.76 120.63 ± 7.10 Day7 18.65 ± 4.50 47.10 ± 7.43 65.90 ± 13.15 Note.All data shown are mean ± SE, n = 8, two-way ANOVA. Table Supplementary Table 5. The Content of Dopamine (DPA), Norepinephrine (NE), 5-hydroxytryptamine (5-HT), and β-endorphin (β-EP) in Normal Rat's Blood Serum after Exposure to Pulsed Microwaves (1, 200 MHz, 10 pps) at Different Peak-power Densities with the Same Average Power Density of 1.2 mW/cm2
Pulsed microwave fields, which have the same average rate of energy deposition in tissues as continuous-wave microwaves, are generally more effective in producing biological responses, such as the 'microwave hearing' effect[1]. Repeated or prolonged exposure to microwave auditory effects may be stressful and potentially harmful[6]. Additionally, pulsed microwaves exert different effects on the nervous and immune systems. For instance, long-term simultaneous exposure to code division multiple access (CDMA) and wideband CDMA radiation at a total SAR dose of 4.0 W/kg does not exert a detectable effect on immune function in rats[8]. However, 900 and 1, 800 MHz microwave radiation (SAR of approximately 0.6 mW/kg) may alter cytokine levels and impair cognition[9]. The ICNIRP has suggested a reference level for the average density calculated from the basic SAR restriction, and a peak power density limit of 1, 000-fold higher than the reference level based on auditory effect theory. However, no systematic experimental research has confirmed that these peak limits are sufficient to prevent adverse effects. Therefore, we explored the effect of 1, 200 MHz (near-resonant frequency) pulsed microwaves at different peak densities and the same average power density on rat behavior and neuroimmunity to assess the rationality of the peak limits. First, we determined that a certain level of pulsed microwaves produced hearing effects but was insufficient to create discomfort or induce aversive behavior. Conditioned rats trained to escape in the presence of high-frequency acoustic clicks (15 kHz, 70 dB, 10 pps) were exposed to 1, 200 MHz, 10 μs pulsed microwaves for 10 min at a peak power density of 600 mW/cm2 (average power density, 0.06 mW/cm2; SAR; 0.02 W/kg; repetition rate, 10 pps). At the same time, real-time rat crossing behavior was monitored. Our results showed that the pulsed-microwave-mediated reduction in the cumulative time in Box A and enhancement in the rate of preference of staying in Box B (Table 1, Supplementary Table S3) were similar to the response to acoustic clicks in the conditioned rats. This suggested that pulsed microwaves produce acoustic effects. The peak power density of 600 mW/cm2 was in accordance with a study conducted by Lin and Wang[1], in which the incident power density required to produce the microwave hearing effect in rats was approximately 5 W/m2 (500 mW/cm2) for frequencies between 915 and 2, 450 MHz, based on thermoelastic theory. The energy density per pulse in this study was 1.7 mJ/kg, which is consistent with the 0.9-1.8 mJ/kg of 2, 450 MHz pulsed microwaves that affect hearing in rats[10]. However, exposure to pulsed microwaves did not reduce the cumulative time spent in Box A by normal rats (Table 1); in other words, 600 mW/cm2 pulsed microwaves did not induce an uncomfortable behavior response. Next, we determined that the peak power density value deduced from the ICNIRP peak limit did not induce aversive behavior or affect neuroimmunity. Normal rats were exposed to 1, 200 MHz pulsed microwaves for 10 min at a peak power density of 600, 1, 200, or 2, 400 mW/cm2 (average power density, 1.2 mW/cm2 over 6 min (higher than the value in the aforementioned experiment); SAR, 0.4 W/kg; repetition rate, 10 pps). The number of crossings, cumulative time in Box A, and latencies on the same day did not differ significantly between the sham-exposure and exposure groups (Supplementary Figures S1, S2, Figure 1). This indicated that pulsed microwaves at a peak power density of 1, 000-fold higher than the average power density over 6 min did not induce aversive behavior or discomfort responses in the normal rats. The levels of IL-2, IL-4, IL-8, TNF-α, IFN-α, IFN-β, DPA, NE, and 5-HT on Days 1, 3, and 7 of exposure did not differ significantly between the sham-exposure and exposure groups (Table 2, Supplementary Tables S4, S5 available in www.besjournal.com). Overall, 1, 200 MHz pulsed microwaves at peak power densities of 1, 200 and 2, 400 mW/cm2 (averaged as 1.2 mW/cm2 over 6 min) at a repetition rate of 10 pps and 0.4 W/kg (basic ICNIRP restriction), which is sufficient to produce auditory effects, did not induce aversive behavior or affect neuroimmunity. This demonstrated that a peak limit value 1, 000-fold higher than the reference level is sufficiently conservative and reasonable. However, to protect human from the health risks of adverse effects on the nervous and immune systems as well as other sensitive systems such as the cardiovascular and reproductive systems, threshold peak values must be explored for 1, 200 MHz pulsed microwaves at a SAR of 0.4 W/kg. To our knowledge, this is the first study to assess the rationality of a peak value limit using an animal model.
The authors declare that no potential conflicts of interest exist.
Effects on the Behavior and Neuroimmunity of Pulsed Microwaves with Different Peak Densities
doi: 10.3967/bes2018.121
Funds:
the Foundation of Astronaut Research and Training Center of China 14ZS017
the Foundation of Astronaut Research and Training Center of China SMFA14B06
- Received Date: 2018-07-22
- Accepted Date: 2018-11-22
| Citation: | YANG Zhen Zhong, WU Da Wei, MA Hong Bo, FEI Jin Xue, ZHAO Ya Li. Effects on the Behavior and Neuroimmunity of Pulsed Microwaves with Different Peak Densities[J]. Biomedical and Environmental Sciences, 2018, 31(12): 893-897. doi: 10.3967/bes2018.121

|

 Quick Links
 DownLoad: