


-
The global average temperature trends have indicated a yearly temperature increase of 0.85 ℃ from 1880 to 2012[1]. Accordingly, the positive shift of temperature throughout the world is unequivocal. The World Health Organization (WHO) estimates that approximately 250, 000 additional deaths will occur every year as a result of the anticipated climatic change within the period 2030-2050[2]. In view of the seriousness of this issue, it is important to focus on human health projections given the expected climatic changes, with the aim of implementing informed policy making decisions.
We selected Nanjing in China as a case study city. This study analyzed cold- and heat-related mortality relationships from existing historical data, and projected cold- and heat-related deaths using 31 global circulation models (GCMs) and two representative concentration pathways (RCPs; RCP4.5 and RCP8.5) radiative forcing scenarios to estimate future temperatures. It also estimated the future population number based on three population scenarios, including a constant scenario and two shared socioeconomic pathways (SSPs) (SSP2 and SSP5).
The estimation of future deaths associated with climatic changes consisted of two stages: (1) the estimation of the temperature-mortality relationship between the historic daily mortality and the daily temperatures of Nanjing by taking into account the air pollutants, and the (2) assessment of future death risks with the a) use of the temperature-mortality relationship from stage 1 and b) the projection of future temperatures by taking into account the future population.
A Poisson regression model combined with a distributed lag linear and non-linear models (DLNM) was used to assess the relationship between temperature and daily deaths. All historic (2007-2012) data were obtained from the Jiangsu Provincial Center for Disease Control and Prevention. The health effect parameters comprise the daily numbers of all internal causes of death of urban Nanjing residents (ICD-10 codes A00-R99). Meteorological data, including the daily mean temperature and daily mean relative humidity, were obtained from the Nanjing station in China (World Meteorological Organization, identification number: 58, 238). Air pollution data, and data including daily PM10 concentrations, daily SO2 concentrations, and daily NO2 concentrations, were obtained from the National Air Pollution Monitoring stations of Nanjing.
A general liner model (GLM) was used to estimate the association between daily mean temperature and mortality. We used a DLNM with a natural cubic spline with five degrees-of-freedom for temperature, and a natural cubic spline with three internal knots placed at equally spaced values with a lag up to 14 days. The covariates were adjusted accordingly. Specifically, a natural cubic spline with seven degrees-of-freedom per year was used to account for the season and long-term trends, and a natural cubic spline with three degrees-of-freedom was used to account for the daily mean relative humidity, daily mean concentrations of PM10, NO2, and SO2, and the day of the week.
To determine the threshold of the temperature, we calculated the overall cumulative exposure-response association. A minimum mortality risk temperature (MMT) of 24.9 ℃ was determined and used as the reference temperature to calculate relative risks.
To check the robustness of the main model, we adjusted the potential modifications related to the modeling choices, exposure metrics, and air pollution. Sensitivity analyses of the exposure-response relationship investigated potential modifications related to model parameters and air pollution. All statistical analyses were performed using the software R (version 3.2.0).
We estimated future temperatures (for the periods of 2010-2039, 2040-2069, and 2070-2099) with 31 GCMs (Supplementary Table S1 available in www.besjournal.com) and two RCPs (RCP4.5 and RCP8.5). The baseline period was that used for the period of 1970-1999. The spatial average of the Bias Correction Spatial Disaggregation (BCSD) land-based grid boxes corresponded to the latitude and longitude coordinates of Nanjing (latitude: 31°14'-32'37', and longitude: 118°22'-119°14'). The details of the analyses were described previously[3]. The distribution of the future average daily mean temperature is listed in Supplementary Table S2 (available in www.besjournal.com). The mean temperatures of the periods 2010-2039, 2040-2069, and 2070-2099, according to the RCP4.5 scenario were 16.6 ℃, 17.6 ℃, and 18.1 ℃, respectively. The mean temperatures of the periods 2010-2039, 2040-2069, and 2070-2099, according to the RCP8.5 scenario were 16.7 ± 9.5 ℃, 18.3 ± 9.5 ℃, and 20.2 ± 9.6 ℃, respectively.
We used the 1990 (5.02 × 10⁶) population data from the Nanjing statistical yearbook (1991) to estimate the population in the period 1970-1999[4]. The constant scenario assumes that the total population will remain constant with respect to the corresponding levels in the period 1970-1999 (5.02 × 10⁶). The population projections were obtained using the National Center for Atmospheric Research- the City University of New Yock (NCAR-CUNY) spatial population downscaling methodology[5], and are in agreement with the SSP2 and SSP5 scenarios (Supplementary Table S3 available in www.besjournal.com). We projected the population at a resolution of 1/8° and for a ten year time interval. Based on the SSP2 and SSP5 scenarios we defined a) the population in the 2010-2039 as the average population of the years 2010, 2020, and 2030, b) the population of the 2040-2069 as the average of the years 2040, 2050, and 2060, and c) the population of the 2070-2099 as the average of the years 2070, 2080, and 2090. The future population in different scenarios is shown in Supplementary Table S4 (available in www. besjournal.com).
Projected deaths were estimated using the modeled projected daily mean temperature and the modeled population. The deaths relative to MMT were calculated to identify the heat effect for all the days with daily mean temperatures higher than MMT. For all the days with daily mean temperatures lower than MMT, the additional number of deaths-compared to MMT-were calculated to define the cold effect. The summations of heat-related and cold-related deaths were calculated to define the net effect according to Equation 1.
$$ \Delta {\rm{Deaths }} = {Y_0} \times ERC \times POP $$ (1) Where ΔDeaths is the daily number of the additional number of temperature-related deaths, and Y0 is the baseline daily mortality rate (per 100, 000 people). The non-accidental mortality rate in 2010 was used as the baseline daily mortality rate, and was obtained from the Nanjing Statistical Yearbook (2011)[6] and the Chinese Center for Disease Control and Prevention. We assumed that the mortality rate will remain constant in the future. ERC is the percentage change in mortality for a specified change in temperature derived from the calculated relative risk at each temperature based on the model analysis of the observed data, as described previously. POP is the population calculated based on the three population scenarios described previously. We computed heat-related deaths, cold-related deaths, and the deaths attributed to net effects (temperature related deahts) for each day. We then calculated the yearly mean deaths for each time period. Additionally, we defined cold and hot days which corresponded to the 15th percentiles of temperature for both extreme temperature cases (P15 for extreme cold, P75 for extreme heat effect) to compare the number of deaths attributed to cold and heat.
Table 1 lists a summary of the statistics of the various variables. Data spanning a total of 2, 137 days were included in the analyses. The mean, minimum, and maximum daily mean temperatures in Nanjing during the study period were 16.2 ℃, -4.5 ℃, and 34.5 ℃, respectively. The mean, minimum, and maximum daily numbers of non-accidental deaths were 94, 46, and 155, respectively.
Items N x Minimum 25th 75th Maximum Mean temperature (℃) 2, 137 16.2 -4.5 8.0 24.4 34.5 Mean relative humidity (%) 2, 137 70.2 17.0 61.0 81.0 99.0 Death number attributed to all internal causes (ICD10: A00–R99) 2, 137 94 46 82 105 155 PM10 concentration (μg/m3) 2, 135 102.9 6.0 65.0 128.5 563.0 SO2 concentration (μg/m3) 2, 137 0.04 0 0.02 0.05 0.19 NO2 concentration (μg/m3) 2, 137 0.05 0 0.04 0.06 0.16 Table 1. Mean, Range, and Specific Percentiles for Variables Measured on a Daily Basis
Supplementary Figure S1 (available in www. besjournal.com) shows the overall cumulative temperature-mortality curve derived using DLNM. The MMT was 24.9 ℃. This curve suggests that both cold and heat deviations from MMT were associated with additional deaths. The results of sensitivity analyses of health effects with different parameters and different air pollutants were stable (Supplementary Table S5 available in www.besjournal.com). Relative Risks (RRs) were not substantially affected in the sensitivity models that were adjusted for df and lag, or those that included PM10, NO2, and SO2.
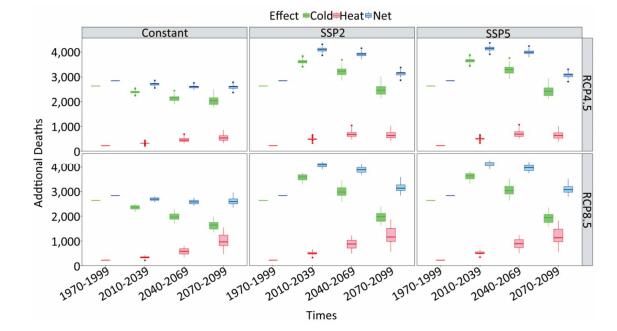
Figure 1 shows that the annual cold-related deaths in RCP4.5 and RCP8.5 will continue to decrease if we do not take into account the change of population (constant population scenario). In the cases of the SSP2 and SSP5 population scenarios, the annual cold-related deaths in RCP4.5 and RCP8.5 will increase in the 2010-2039, and then decrease after the 2040-2069. In general, the annual heat-related deaths in RCP4.5 and RCP8.5 will increase for all the three population scenarios. According to the results of the constant scenario, the additional number of cold-related deaths for RCP4.5 was higher than those for RCP8.5. This finding was consistent at lower temperatures. With respect to the heat effects, the opposite was true. In the case of the net effect, the additional number of death counts (median of the results obtained from the 31 GCMs) of RCP4.5 (2, 705, 2, 595, and 2, 596) were higher for RCP8.5 (2, 685, 2, 570, and 2, 584) in the 2010-2039, 2040-2069, and 2070-2099. The results related to the extreme cold and heat conditions listed in Supplementary Table S6 (available in www. besjournal.com).
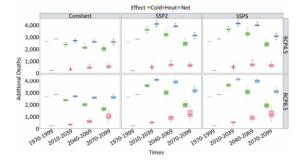
Figure 1. Projected cold, heat, and net temperature-related deaths from the period 1970-1999 to the 2070-2099 for RCP4.5 and RCP8.5 based on the three population scenarios and the 31 GCMs.
To provide an overall perspective, we assessed the projected risk of the additional number of deaths based on a set of SSP and RCP matrices (Supplementary Figure S2 available in www.besjournal.com), even though not all the combinations of RCPs and SSPs are internally consistent given the assumptions associated with the RCPs and SSPs (e.g., RCP8.5 and SSP1)[7].
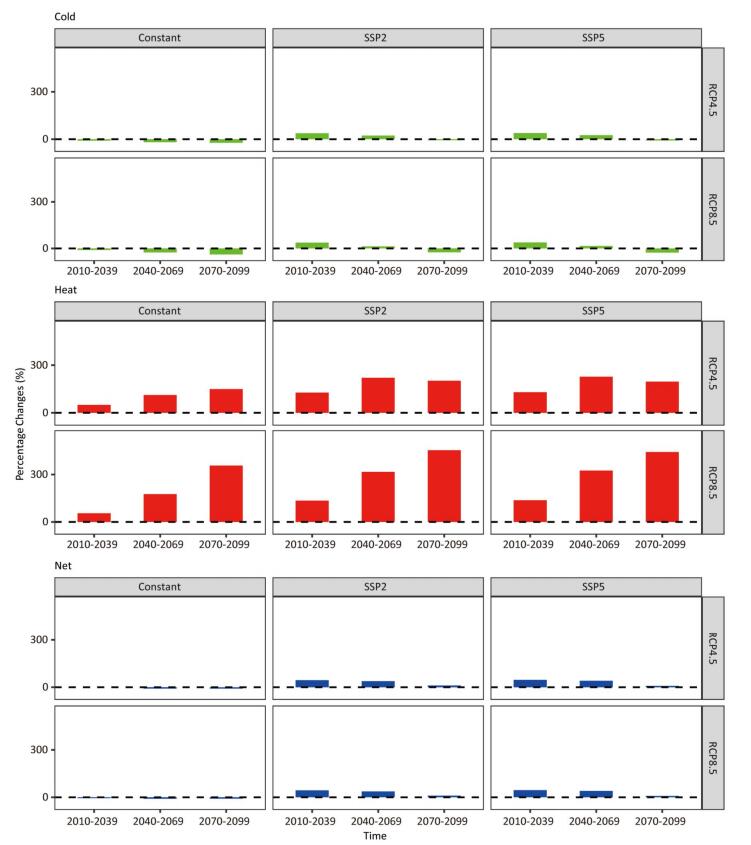
Figure 2 shows the median percentage change of cold, heat, and the net temperature-related deaths in the 2010-2039, 2040-2069, and 2070-2099, using the RCP4.5 and RCP8.5 for the three population scenarios. Cold-related deaths for the constant population scenario continued to gradually decrease since the period 1970-1999. In the cases of the SSP2 and SSP5 scenarios, cold-related deaths increased slightly in the 2010-2039, and then gradually decreased. In the 2070-2099, cold-related deaths decreased by 26% compared to those in the period 1970-1999. The median estimate of cold-related mortality increased by approximately 38%, 23%, and -6%, respectively, in the case of the pathway/scenario of RCP4.5/SSP2, and increased by approximately 38%, 15%, and -26%, in the case of the pathway/scenario of RCP8.5/SSP5. Heat-related deaths exhibited the largest changes compared to the baseline period (1970-1999). Heat-related deaths using RCP8.5 increased dramatically compared to those estimated based on the RCP4.5 scenario. The median estimates of heat-related mortalities increased by approximately 127%, 221%, and 202%, respectively, in the case of the pathway/scenario of RCP4.5/SSP2, and increased by approximately 137%, 325%, and 443%, in the case of the scenario of RCP8.5/SSP5. Temperature-related deaths will change slightly in the 2010-2039, 2040- 2069, and 2070-2099 (-5% to -9%). In the 2070-2099, the amplification in SSP2 is expected to be slightly higher than SSP5, and both will increase slightly (8% to 11%). To eliminate the effects of population size changes, we also calculated the fractions attributed to each time period (Supplementary Table S7 available in www.besjournal.com).

Figure 2. Percentage changes of medians of cold, heat, and net temperature-related deaths from the period 1970-1999 for RCP4.5 and RCP8.5 based on the three population scenarios.
Future scenario assumptions constitute some of the most challenging and consequential aspects of climatic impact projections in the health sector, especially the assumption of future temperature and future population, and the internal connection of these assumptions. The combination of RCPs and SSPs defines several family macroscale scenarios and interplays between adaptation and mitigation[7]. In the estimations of future temperatures, we chose two RCP scenarios, i.e., RCP8.5 and RCP4.5, their use is consistent with the conduct of many prior studies[8]. RCPs were developed to describe different forcing levels of future climate changes. In the projection of population, some studies assumed that the population would remain constant[9]. Some other studies projected the population in a specific developmental scenario[4]. We performed comparisons by alternating the population scenarios, including the constant population scenario, SSP2, and SSP5, to measure the population changes. Given the internal assumptions of RCPs and SSPs, we chose two SSP scenarios in this study, i.e., SSP2 and SSP5. RCP4.5 and SSP2 may be internally consistent and so are the RCP8.5 and SSP5.
Owing to the offsetting effects on heat and cold deaths, the net numbers of temperature- related deaths in the 2070-2099 are expected to be comparable in the cases of the RCP4.5/SSP2 and RCP8.5/SSP5 pathways/scenarios However, the ratio of cold-related and heat-related mortalities for the two scenarios were different. The RCP8.5/SSP5 scenario shows an increase in the heat-related mortality and a decrease in the cold-related mortality by a large margin. Nevertheless, the change in the pathway/scenario of RCP4.5/SSP2 is relatively smooth. These results were similar to those obtained from a previous research study conducted in the Jiangsu Province[10]. From the aspect of human adaptability, we suggest that RCP4.5/SSP2 is a better future development pathway/scenario.
There are some limitations associated with our study. Although the population will adapt to temperature changes to some extent, and the temperature-mortality relationship and MMT can in fact change over time, the extent of this adaptation is still uncertain in Nanjing. Thus, we decided not to account for a) the adaptation, and to b) take into consideration the assumption that the temperature- mortality relationship MMT will remain constant in the future. We also did not consider the future changes in meteorological factors and air pollution, or the possible correlations between these factors that may also affect the temperature-mortality relationship. In addition, according to UN data, the population in China will change in the future, but there is no specific data available for Nanjing. To avoid the introduction of larger deviations, we assumed that the overall population mortality rate in Nanjing will remain constant in the future. Thus, we did not consider the possible change of the demographic structure.
Author Contribution Statement SUN Qing Hua: performed the exposure-response relationship analyses, mortality projections, and wrote the manuscript. Radley M. Horton: performed the temperature projection analyses and edited the manuscript. Daniel A. Bader: performed the temperature projection analyses. Bryan Jones: performed the population projection analyses. ZHOU Lian: supplied the data of Nanjing. LI Tian Tian: designed the work and edited the manuscript.
HTML
Beijing Natural Science Foundation 7172145
National Natural Science Foundation of China 91543111
Special Foundation of Basic Science and Technology Resources Survey of Ministry of Science and Technology of China 2017FY101204

 Quick Links
 DownLoad: