


HTML
-
Poliovirus (PV), the causative agent of poliomyelitis, invades the central nervous system and destroys motor nerve cells in the anterior horn of the spinal cord, consequently causing limb paralysis. In rare cases, it may even cause death by paralyzing muscles that control the throat or breathing[1]. PV was one of the most feared pathogens in industrialized countries during the 20th century, affecting hundreds of thousands of children every year via outbreaks during warm summer months. Although there are highly effective vaccines to control poliomyelitis, it remains endemic in a few countries, from which spread and outbreaks continue to occur worldwide[2-4].
PV is an enterovirus and is primarily transmitted through the fecal-oral and oral-oral route[1]. It can be excreted through patient feces, flowing into the aquatic environment, and consequently spreads via water. The resistance shown by enteroviruses in the aquatic environment (including survival time and endurance to various purification measures as well as disinfectants) is radically stronger than that shown by bacteria[5]. Lukasik et al. evaluated the effectiveness levels of various disinfectants in reducing or completely eradicating viable bacteria and viruses from the surfaces of strawberries, and they reported that free chlorine concentrations of as high as 300 ppm in washing water were needed to achieve disinfection[6]. Even after disinfection and contaminants being within acceptable levels in water, viruses can at times still be detected, of which enteroviruses are the most common. It has been reported that an individual needs to ingest just one detectable virus unit to develop an infection[7-10]. Using thorough disinfection methods is the only robust way to completely eradicate pathogens in water and thereby control infections; it is therefore imperative to study the effectiveness of different water disinfection methods to tackle pathogens such as PV type 1 (PV1).
Ozone has strong oxidizing properties and has been widely used in recent years for disinfecting drinking water[11-12]. The speed of disinfection is very fast, and the inactivation effect of ozone is better than that of disinfectants such as chlorine, chloramines, and chlorine dioxide (ClO2); ozone can also oxidize and degrade organic substances in water[13-15]. The remaining ozone in water can naturally decompose so that the dissolved oxygen content in the effluent is high, the burden on the receiving water body is reduced, and the quality of water can be improved[16-17].
Roy et al. reported that ozone damages two of the four polypeptide chains present in the viral capsid of PV1; however, protein coat alteration does not significantly impair the adsorption of the virus or alter the integrity of viral particles; damage to viral nucleic acids by ozone was the foremost reason for PV1 inactivation[18]. Considering the different functions of each region of viral nucleic acids, the target sequences in the PV1 genome can be segregated into a 5′-non-coding region (NCR), coding region, 3′-NCR, and poly(A) tail[19]. Simonet and Gantzer determined that the 5′-NCR of the PV1 genome gets damaged upon ClO2 treatment, resulting in PV1 inactivation[20]. Moreover, Bhattacharya et al. reported that when RT-PCR was used to evaluate the changes in hepatitis A virus (HAV) infectivity after exposing viral samples to heat or UV irradiation, PCR signals exclusively generated by primers designed in the 5′-NCR of the viral genome helped discriminate between infectious and non-infectious HAV[21]. In our previous study, we demonstrated that ClO2 induces PV1 inactivation by damaging the 40-80 nucleotide (nt) region in the 5′-NCR of the viral genome[22]. Nevertheless, when PV1 is disinfected with ozone, the site of action of ozone in the 5′-NCR of the viral genome remains unclear. In addition, with an increase in the demand to develop molecular biological techniques such as PCR and quantitative real-time PCR to investigate the contamination of water by infectious viruses, it has become crucial to investigate the relationship between PV1 infection and integrity of the viral genome upon exposure to disinfectants[23].
In this study, we used cell culture, long-overlapping RT-PCR, and spot hybridization assays to verify and accurately locate the sites of action of ozone in the 5′-NCR of the viral genome; we confirmed our observations by employing recombinant viral genome RNA infection models. We hypothesized that if the inactivation of viruses by disinfectants is based on viral genomic damage, molecular biological techniques should be able to effectively evaluate the disinfection effect as they strictly depend on the integrity of target nucleic acids, which are used as a template.
-
Attenuated PV1 strain LSc/2ab was obtained from the National Institute for Biological Standards and Control (UK). Viruses were propagated and titrated using Vero cells. Cultures of PV1-infected cells were harvested after the development of extensive cytopathic effects (usually 24 h post-inoculation). Cells were subjected to three freeze-thaw cycles to release the virus, followed by centrifugation at 1, 200 ×g for 10 min at 48 ℃ to remove cell debris. The supernatant was then assayed for infectious PV1 and found to contain 107.25 tissue culture infective dose/mL[22]. The viral suspension was stored at -80 ℃. Before use, the suspension was thawed, sonicated for 30 s at 20 kHz (150 W), and filtered through a 0.22-μm pore size membrane to remove any large clumps or aggregates of PV1.
-
Ozone was generated using an air source; ozone generated by the ozone-generating equipment was introduced into a glass cylinder containing 100 mL distilled water, and tail gas was absorbed using a surplus of sodium sulfite solution. Immediately, 2.5 mL potassium iodide and (1:3) sulfuric acid were added to the ozone water; the solution was thoroughly mixed and incubated for 5 min in the dark. Then, titration was performed using 0.01 mol/L Na2S2O3. When a pale-yellow color was obtained, 1 mL of 5 g/L starch was added. The solution consequently turned blue; titration was continued until the solution became colorless. The titration volume of Na2S2O3 was used to calculate the concentration of ozone[24].
-
The viral suspension was added to 100 mL water sample at 20 ℃ and thoroughly mixed to obtain a concentration of 106 plaque-forming units (PFU)/L. The flow rate of ozone was 0.5 L/min, and the ventilation time was set to 0, 30, 60, 90, 105, and 120 s[24]. The ozone-sterilized viral suspension was connected to the Vero cells to detect any live viruses in the sample. The concentration of ozone in the water sample at each timepoint was measured by the above method, and three replicates were used for each timepoint.
-
The sterilized viral suspension was diluted and inoculated into a 25-cm2 cell culture flask containing a single layer of Vero cells; three replicates were used for each timepoint. After mixing 2× 1640 maintenance medium and 2% agar in equal volumes, it was added to a cell culture flask to cover the cells to form a solid medium, and the number of plaques formed was counted after 2 days of incubation in a cell culture incubator. PV1 concentration was subsequently calculated from the number of plaques formed and expressed as PFU.
$$ {\rm{PFU}} = {\rm{ Dilution}}\;\;{\rm{ factor }} \times \frac{{{\rm{P}}1 + {\rm{P}}2 + {\rm{P}}3}}{n} \times \frac{1}{v} $$ (1) In the above formula, P represents the number of plaques formed, n is the number of cell culture flasks, and v is the inoculum volume (mL).
-
Viral RNA was extracted and purified using RNeasy columns (Qiagen, USA), according to manufacturer's instructions.
-
Different regions of the viral genome were amplified using RT-PCR. Primers used for detecting viral genome sites that were damaged by ozone are listed in Supplementary Table S1, available in www.besjournal.com.
Primer Set Primer Name Sequence (5′→3′) Site (nt) 1 1F TTAAAACAGCTCTGGGGT 1-18 1R TTTGGAGGCGTTACACTG 1, 280-1, 297 2 2F CAATGCTAAACTCGCCAAAC 939-958 2R GATCCTGCCCAGTGTGTGT 2, 086-2, 104 3 3F CCCATACTCTGCCTGTCACTC 2, 006-2, 026 3R CAGCCAAAATACCGAAGTC 3, 185-3, 203 4 4F GCACTAGGTGACTCCCTC 3, 146-3, 163 4R TACGGTGTTTGCTCTTGAAC 4, 462-4, 481 5 5F CAGGAACACCAGGAAATTCT 4, 331-4, 349 5R CAGTGGGAGGTTGATTCCAT 6, 429-6, 448 6 6F TCTTGAACAAACAAACCAGAG 6, 375-6, 395 6R AAAAATTTACCCCTACAGCAGG 7, 407-7, 427 5'-NCR 5' -1a CTTGGTTTTGTGCGTCTAAG 105-124 5'-2Fb AGACGCACAAAACCAAGTT 108-126 5'-2R GAGCGAATCCAGCAAACAG 661-679 5'-3c CTGGATTCGCTCCATTGAG 669-686 Note. F, forward primer; R, reverse primer. aAmplification of the 1-124 nt region matched with primer 1F. bAmplification of the 108-679 nt region matched with 5'-2R. cAmplification of the 669-1, 297 nt region matched with primer 1R. Table Supplementary Table S1. Primers Used to Amplify PV1 Genome
First, the extracted RNA was reverse transcribed with random primers and oligo(dT) primers using PrimeScriptTM Ⅱ First Strand cDNA Synthesis Kit (Takara 6210A), as per manufacturer's instructions. The obtained cDNA was then used as a template to amplify different target regions with corresponding primers. Each 20 μL reaction mixture included 2.5 μL cDNA template, 12.5 μL Taq polymerase, 0.5 μL primers (10 μmol/L), and 4 μL distilled water. The thermal cycler conditions were as follows: 1 cycle of initial denaturation at 94 ℃ for 3 min, 30 cycles of denaturation at 94 ℃ for 30 s, annealing at 55 ℃ for 30 s, and extension at 72 ℃ for 60 s, followed by a final elongation step at 72 ℃ for 7 min. All PCR products were analyzed by electrophoresis using 1.5% (w/v) agarose gels stained with ethidium bromide.
-
Spot hybridization assays were performed using biotinylated probes[25]. A nitrocellulose membrane was pre-soaked in 2× saline sodium citrate (SSC) buffer for 2 h and air-dried before use. PV1 RNA suspensions were mixed with an equal volume of RNA fixative, incubated at 68 ℃, and then chilled in an ice bath. Two volumes of 20× SSC were subsequently added to the mixture to establish an RNase-free environment. A pencil was used to create marks on the membrane, and viral RNA samples were dot blotted. The membrane was placed on a clean filter paper and then in a nucleic acid cross-linking instrument, and irradiated with a UV lamp to immobilize the RNA on the membrane. Subsequently, the membrane was completely immersed in a hybridization solution to facilitate pre-hybridization. The hybridization solution and probes were mixed in equal volumes, and this was applied to the locations marked on the membrane. The membrane was then placed in a hybridization medium to facilitate hybridization, and it was then washed using a washing buffer. After drying the membrane, 2 μL horseradish peroxidase (HRP)-biotin was diluted in 2 mL hybridization solution, and this was carefully applied to the defined RNA sample locations on the membrane. Once dried, the membrane was placed in the hybridization solution, incubated at 37 ℃, and washed using the washing buffer. One drop of 3, 3′-diaminobenzidine and 37% H2O2 were added to 2 mL phosphate buffer saline (PBS) and uniformly mixed, and the membrane was placed in this solution at room temperature to facilitate color development. The membrane was finally placed on a filter paper and allowed to dry before a photograph was taken. The probes used for spot hybridization assays are shown in Supplementary Table S2, available in www.besjournal.com.
Probe Site (nt) Sequence (5′→3′) 1 1-40 GTGGGCCTCTGGGGTGGGTACAACCCCAGAGCTGTTTTAA 2 40-80 GCGTACAAGGGTACCGCAATACCGGAGTACTAGCCGCCACG 3 80-124 CTTGGTTTTGTGCGTCTAAGTTACGGGAAGGGAGTATAAAACAGG Table Supplementary Table S2. Probes Used for Spot Hybridization Assays
-
Viral cDNA was synthesized in vitro and transcribed using RNA polymerase into RNA, which was used to infect cells, ultimately resulting in the synthesis of infectious PV[26]. RNA extraction and reverse transcription were performed as previously described. Primers used to construct damaged PV1 RNA are listed in Supplementary Table S3, available in www.besjournal.com.
Primer name Site (nt) Sequence (5′→3′) F1 1-80 CCCGAAATTAATACGACTCACTATAGGTTAAAACAGCT CTGGGGTTGTACCCACCCCAGAGGCCCACGTGGCGG CTAGTACTCCGGTATTGCGGTACCCTTGTACGCCTTAAG F2 1-20 CCCGAAATTAATACGACTCACTATAGGTTAAAACAGCTCTGGGGTTG F3 125-144 CCGAATTCTCAAT AGAAG GGGGT ACAAA TR 7, 433-7, 471 TTTTTTTTTTTTTTTTTTTTTTTTTTTTTTCCTCCGAAT Note. Primer pair F3/TR was used to amplify the 125-7, 471 nt region; the obtained PCR products were ligated with F1 to construct PV1 lacking the 80-124 nt region. Primer pair F3/TR was used to construct PV1 lacking the 1-124 nt region. Primer pair F2/TR was used to construct complete PV1 genome. Table Supplementary Table S3. Primers Used to Construct Damaged PV1 RNA
Each 50 μL reaction mixture contained 1 μL cDNA template, 1 μL primers (5 μmol/L), 1 μL Trans HiFi (10 U/μL), 5 μL 10× HiFi buffer, 5 μL dNTPs (2.5 mmol/L), and 36 μL distilled water. The thermal cycler conditions were as follows: 1 cycle of initial denaturation at 94 ℃ for 3 min, 30 cycles of denaturation at 94 ℃ for 30 s, annealing at 53 ℃ for 30 s, and extension at 72 ℃ for 60 s, followed by a final elongation step at 72 ℃ for 10 min. All PCR products were analyzed by electrophoresis using 1.5% (w/v) agarose gels stained with ethidium bromide.
The recovered PV1 DNA fragment was treated with EcoRI to form a sticky end between the 3′-end of the upstream fragment and the 5′-end of the downstream fragment of the injury site. Each 100 μL reaction mixture included 25 μL 10× EcoRI buffer, 10 μL template DNA, 10 μL EcoRI, and 55 μL ultrapure water. The reaction was performed at 37 ℃ for 2 h, and the DNA was precipitated using absolute ethanol. The upstream and downstream DNA fragments were ligated with T4 DNA ligase to obtain PV1 double-stranded genomic DNA that was damaged in the 5′-NCR partial region.
After constructing the recombinant PV1 genome, T7 RNA polymerase was used to synthesize recombinant viral genomic RNAs in vitro using the newly constructed PV1 genomic DNA with T7 bacteriophage transcript promoter. The reaction mixture comprised 10 μL 10× T7 RNA polymerase buffer, 10 μL dNTPs (2.5 mmol/L), 20 μL DTT (50 mmol/L), 2.5 μL RNase inhibitor (40 U/μL), 10 μL PV1 template DNA (20 ng/mL), and 5-25 U T7 RNA polymerase; DEPC water was used to obtain a final volume of 100 μL. After incubation at 37 ℃ for 30-60 min, 10 U of RNase-free DNase Ⅰ and RNase inhibitor were added to 1 U/μL, followed by incubation at 37 ℃ for 10 min. The solution was then transferred to a column and total RNA was extracted.
-
The infectivity of recombinant PV1 genomic RNAs was analyzed using plaque-forming assays[27]. Vero cells were grown on a 25-cm2 square to form a monolayer and washed twice with PBS in DEPC water. Viral RNA was serially diluted 10-fold with Hanks balanced salt solution containing 1 mg/mL DEAE-dextran, and chilled for 30 min in an ice batch. Subsequently, 1 mL DEPC-treated PBS was added to each cell culture well, and 200 μL of different concentrations of gradient RNA solution was added to each well. The culture flask was thoroughly stirred; two wells were inoculated for each dilution gradient. After adsorption for 30 min at room temperature, it was mixed with 2× 1640 maintenance medium and 2% agarose and then spread into a cell culture plate. At the same time, PV1 RNA extracted from viral particles was used as a control to infect Vero cells, and infectivity of the synthesized PV1 RNA was compared.
If no plaques formed in the first round of transfection, the culture supernatant was used to re-infect Vero cells, and the inoculation cycle was repeated three times. RNA isolated from the supernatant of the third inoculation was extracted using the extraction method described earlier, and RT-PCR was performed using the primer pair listed in Supplementary Table S1 to exclude the possibility of false-negative or latent infection.
Virus and Cells
Preparation and Concentration Determination of Ozone Water
Disinfection via Ozone
PV1 Infection
RNA Extraction
Primers and RT-PCR
Probes and Spot Hybridization
Construction of Damaged PV1 RNA
Infectivity Determination of Recombinant PV1 Genomic RNAs
-
The concentration of ozone in water (mg/L) increased with an increase in ventilation time, and the concentration became stable after saturation (Supplementary Table S4, available in www.besjournal.com).
Ventilation Time (s) Ozone Concentration (mg/L) 0 0.00 30 0.60 60 1.08 90 1.44 105 1.44 120 1.44 Note.Water volume was 100 mL, flow rate of ozone was 0.5 L/min, and temperature was 20 ℃. Table Supplementary Table S4. Relationship between Ventilation Time and Ozone Concentration
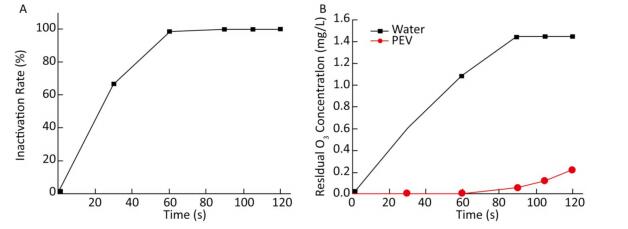
As ozone-depleting substances were present in the water body containing PV1, the concentration of ozone in water was 0 mg/L when ventilation was started. When equilibrium was reached, the concentration of ozone increased with ventilation time. Time-and dose-dependent effects of ozone on PV1 inactivation and antigenic injury were observed. An increase in the concentration of ozone or ventilation time resulted in a decline in PV1 survival rate and an increase in the degree of antigenic injury (Figure 1). The time required for ozone to inactivate PV1 was very short-PV1 was completely eradicated by ozone upon disinfecting water for 105-120 s (Supplementary Table S5, available in www.besjournal.com).
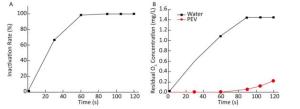
Figure 1. (A) Ozone-induced changes of PV1 inactivation rate. (B) Dissolved concentration curve of ozone in 100 mL distilled water and 100 mL PV1-containing water. The baseline conditions were: initial concentration of PV1 was 106 PFU/L in 100 mL water sample, ventilation flow was 0.5 L/min, and temperature was 20 ℃.
Ventilation Time (s) Ozone Concentration (mg/L) Inactivation Rate (%) 0 0.00 0.0 30 0.00 66.7 60 0.00 99.0 90 0.06 99.9 105 0.12 100.0 120 0.22 100.0 Note. Water volume was 100 mL, initial concentration of PV1 was 106 PFU/L in the water sample, flow rate of ozone was 0.5 L/min, and temperature was 20 ℃. Table Supplementary Table S5. Relationship between Ventilation Time, Ozone Concentration, and PV1 Inactivation Rate
-
Primers designed to amplify the full-length PV1 genome were validated by RT-PCR using untreated (native) PV1 RNA as a template. All expected targets, 6 long and 3 short fragments, were amplified successfully (Supplementary Figure S1, available in www.besjournal.com). Furthermore, the 6 long fragment sequences were verified by sequencing and aligning to the 7441-nt region, which were demonstrated by BLAST to be identical to those published earlier[28].
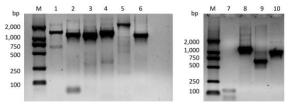
Figure Supplementary Figure S1. Validation of primers designed to target different regions in the PV1 genome. Lane M is DL2000 DNA markers (2, 000 bp, 1, 000 bp, 750 bp, 500 bp, 250 bp, 100 bp); lanes 1-6 are the amplification products of the primer set 1 to the primer set 6; lanes 7-10 are the amplification product of the primer set 1, 5'-1/1F, 5'-2F/5'-2R, 5'-3/1R.
-
PV1 infectivity was completely inhibited upon disinfecting the water sample with ozone for 105 s. When water samples exposed to different disinfection times were separately subjected to RT-PCR to study the PV1 genome, region-specific sensitivities to ozone were revealed. The first region lost to detection was the 1-1, 297 nt region in the 5′-NCR (Figure 2). Further study was conducted to elucidate the relationship between damage to the PV1 genome and changes to viral infectivity, and the obtained results showed that the 1-124 nt region was damaged (Figure 3). As ozone concentration or disinfection time increased, other regions of the genome were damaged after 120 s of disinfection. These findings indicated that different regions of the PV1 genome have different resistance to ozone. The 1-124 nt region was the most sensitive and its damage was consistent with the disappearance of PV1 infectivity. The rest of the genome showed stronger resistance, and damage to other regions, as evident from the data presented in Table 1, was not completely consistent with changes to PV1 infectivity. These observations indicated that ozone-induced inactivation of PV1 occurs via damage to the 1-124 nt region in the 5′-NCR.

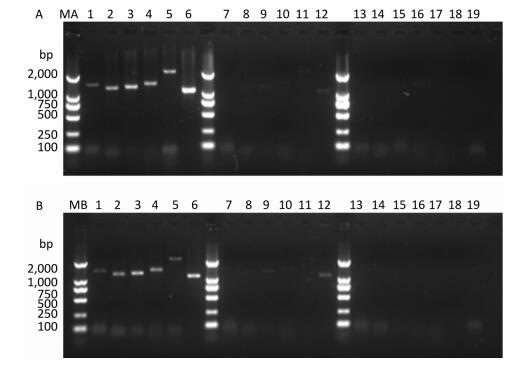
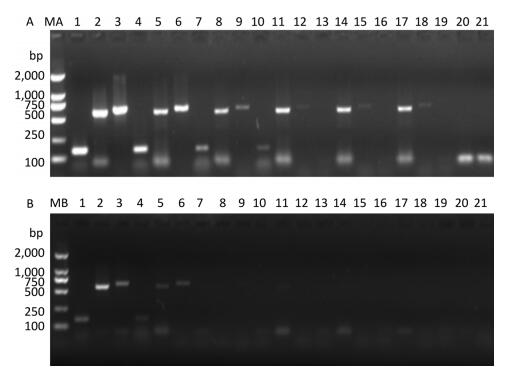
Figure 2. Detection of RT-PCR products in virus-containing water samples sterilized by ozone at different times.(A) The RT-PCR products of PV1 cDNA synthesized with random primers. (B) The RT-PCR products of PV1 cDNA synthesized with oligo-dT primers. Lanes 1-6 were Positive controls, correspond to the amplification products of primer set 1 to primer set 6, respectively. Lanes 7-12: Disinfection time of 105 s, lanes 13-18: Disinfection time of 120 s, lane 19 was a negative control for primer set 1. Lanes MA and MB, DL2000 DNA markers (2, 000, 1, 000, 750, 500, 250, and 100 bp).
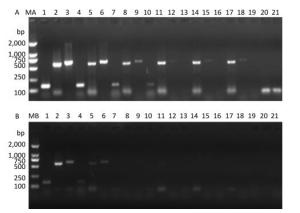
Figure 3. Precise detection of RT-PCR products in virus-containing water samples sterilized by ozone at different times.(A) The RT-PCR products of PV1 cDNA in the 5'-NCR synthesized with random primers. (B) The RT-PCR products of PV1 cDNA in the 5'-NCR synthesized with oligo-dT primers. Lanes 1-3 were positive controls, correspond to the amplification products of primer sets 5'-1/1F, 5'-2F/5'-2R, and 5'-3/1R, respectively. Lanes 4-6: Disinfection time of 30 s, lanes 7-9: Disinfection time of 60 s, lanes 10-12: Disinfection time of 90 s, lanes 13-15: Disinfection time of 105 s, lanes 16-18: Disinfection time of 120 s, lane 19-21 were negative controls. Lanes MA and MB, DL2000 DNA markers (2, 000, 1, 000, 750, 500, 250, and 100 bp).
Ventilation Time (s) Ozone Concentration (mg/L) Infectivity Nucleic Acid Region (nt) 1-1, 297 1-124 108-679 669-1, 274 939-7, 441 0 0 + + + + + + 30 0.60 + + + + + + 60 1.08 + + + + + + 90 1.44 + + + + + + 105 1.44 - - - + + + 120 1.44 - - - - - - Note.+, Positive result; -, Negative result in replicate experiments (n = 3). Table 1. Damage to PV1 RNA by Different Concentrations of Ozone
-
Spot hybridization assays reportedly have better sensitivity and the detection effect is ideal. Probe 2 was used for spot hybridization. The method could detect 17 PFU/mL of viral RNA (Supplementary Figure S2, available in www.besjournal.com).
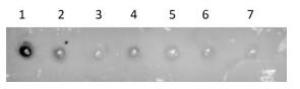
Figure Supplementary Figure S2. Sensitivity verification of the spot hybridization assay (n = 3). PV1 RNA was cross-linked on a membrane and hybridized with probe 2. Spot 1, positive control; spots 2-, PV1 detection concentration of 1.7 × 10⁶-1.7 × 101 PFU/mL.
Viral RNA was extracted from PV1 after disinfection using ozone for 0, 90, 105, and 120 s, and spot hybridization assay was used to accurately locate the 5′-NCR sensitive targets in the PV1 genome. The 5′-NCR loci corresponding to probe 3 (80-124 nt) was the most sensitive to damage by ozone (Figure 4). Moreover, loss of the integrity of this small 45-nt region was accompanied by loss of PV1 infectivity (Supplementary Table S6, available in www.besjournal.com).
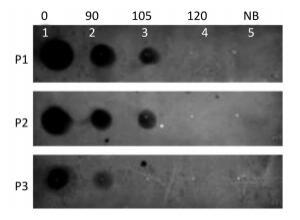
Figure 4. Spot hybridization assay to determine ozone-sensitive regions in the 5′-NCR of the PV1 genome (n = 3). PV1 RNA was cross-linked on a membrane and hybridized with biotinylated probes targeting different regions. Spot 5 corresponds to the negetive control. Spots 1-4 correspond to RNA from PV1 treated with ozone for 0, 90, 105, and 120 sec. Spots were detected with probes to P1 (1-40 nt), P2 (40-80 nt), P3 (80-124 nt) region.
Ventilation Time (s) Infectivity 1-40 40-80 80-124 0 + + + + 30 + + + + 60 + + + + 90 + + + + 105 - + + - 120 - - - - Note. +, Positive result; -, Negative result in replicate experiments (n = 3). Table Supplementary Table S6. Spot Hybridization Assay to Detect Damage to the 1-124 nt Region in the 5'-NCR
-
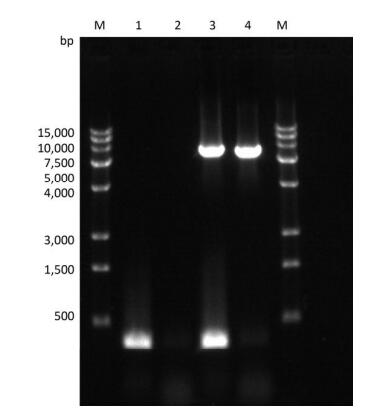
PV1 genomic DNA and RNA lacking different target sequences were constructed and verified using RT-PCR (Supplementary Figure S3, available in www.besjournal.com). The plaque-forming assay of the corresponding recombinant viral genomes indicated that the full-length viral genomic RNA had high infectivity (Figure 5), whereas the viral genome lacking the 80-124 nt and 1-124 nt regions had no infectivity (Figure 6).

Figure Supplementary Figure S3. Verification of PV1 genomic DNA with 1-124 nt region deleted. Lane M: DL15000 DNA markers (15, 000, 10, 000, 7, 500, 5, 000, 4, 000, 3, 000, 1, 500, 500), PCR products of the full-length (integrated) PV1 genomic DNA (lane 3), and negative control (lane 1); PCR products of the PV1 genomic DNA lacking the 1-124 nt region (lane 4), and negative control (lane 2).
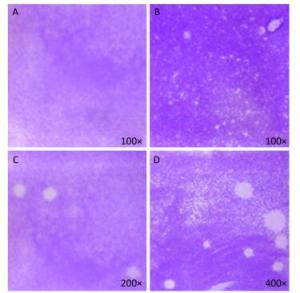
Figure 5. Plaque-forming cell assay using full-length viral genomic RNA and viral particles (n = 3). (A) Negative control, no PV1 RNA was inoculated, (B) Integrated virus RNA, (C) Complete virus particle (17 PFU), (D) Complete virus particle (170 PFU).
Figure 6. Plaque-forming cell assay to determine infectivity of recombinant PV1 RNA with sensitive targets deleted (n = 3). Recombinant viral RNA were inoculated into the culture supernatant of Vero cells. (A) RNA lacking 1-124 nt of 5'-NCR, (B) is parallel to, (C) RNA lacking 80-124 nt of 5'-NCR, (D) is parallel to C.
Viral nucleic acids were not detected in the culture supernatants from inoculated cells infected with recombinant viruses, indicating loss of infectivity when the 80-124 nt and 1-124 nt regions were missing.
Relationship between PV1 Inactivation by Ozone and Antigenic Injury
Primer Validation
Effect of Ozone on Infectivity and Genomic Integrity of PV1
Fine Mapping of 5′-NCR Sensitive Targets in the PV1 Genome
Relationship between Loss of Infectivity and Genomic Damage
-
Ozone is an effective disinfectant and is widely used to purify drinking water[12]. In this study, we found that the effect of ozone on PV1 infectivity was both time- and dose-dependent, and PV1 could be completely eradicated after ozone disinfection for 105 s. It has been previously reported that PV1 infectivity is completely inhibited upon treatment with 0.2 mg/L ClO2 for 12 min, 0.4 mg/L ClO2 for 8 min, or 0.8 mg/L ClO2 for 4 min[22]. This proves that ozone is more effective as a disinfectant than ClO2. When ozone is used to disinfect drinking water, the concentration of ozone needed is very low too. On disinfecting water with ozone at a mass concentration of 0.4 mg/L for 4 min, effective disinfection can be achieved[29]. These findings indicate that ozone has a very broad prospect as a water disinfectant.
Researchers have suggested that ozone inactivates viruses by destroying viral nucleic acids or capsid proteins. Moore and Margolin published a study in which PV1 was treated with chlorine, ClO2, ozone, and UV irradiation to determine the effectiveness of each disinfectant, and they could detect viral nucleic acids even after PV1 infectivity was completely eliminated. They speculated that viral inactivation may be associated with capsid protein damage[30]. However, Roy et al. found that although ozone can destroy the capsid protein of PV1, viral infectivity still exists. The destruction of the viral nucleic acid by ozone is the main reason for PV1 inactivation[18].
Although most related studies indicate that ozone-induced PV1 inactivation is associated with damage to the viral genome, specific sequences targeted by ozone within the viral genome have not yet been identified. Here we used RT-PCR and spot hybridization assays to identify the sites of action of ozone in the 5′-NCR of the viral genome. Our results indicated that the genetic target damaged by ozone was mainly located in the 80-124 nt region in the 5′-NCR. Moreover, our infection model confirmed that RNA lacking the 80-124 nt region in the 5′-NCR caused complete loss of infectivity. The obtained results also demonstrated that viral nucleic acids could be detected after complete elimination of viral infection and that all detectable regions were located in the coding region of the viral genome, indicating that this region is most resistant to the effect of disinfectants.
Simonet and Gantzer also reported that the 5′- and 3′-NCR of the PV1 genome appeared to be the most sensitive to ClO2 treatment[31]. In one of our previous study, Jin et al. determined that the genetic target damaged by ClO2 in the 5′-NCR is mainly located in the 40-80 nt region, resulting in PV1 inactivation[22]. With regard to other enteroviruses, Jin et al. reported that ClO2 inactivates EV71 by disrupting the 1-118 nt region in the 5′-NCR[5]; Li et al. also determined that the loss of ClO2-induced HAV infectivity is associated with damages to the 5′-NCR[32].
The 5′-NCR of the PV1 genome is mainly associated with viral transcription, replication, translation, and invasion[33]. The nucleotide sequence of this region contains a high degree of mutual complementarity between strands, which supports the formation of hairpin or stem-loop secondary structures. The 5′-NCR has six stem-loop domains, representing two functional elements. Domain Ⅰ is the 1-80 nt region that is a cloverleaf structure and associated with the replication of viral nucleic acids[34-35]. This region is bound by the polyC-binding protein and viral protease-polymerase 3CD to form the ribonucleoprotein complex B[36], which catalyzes the synthesis of plus-strand RNA of viruses. Domains Ⅱ-Ⅵ in the 130-610 nt region are associated with viral protein synthesis. Defined as an internal ribosomal entry site, they directs ribosomes near the initiation codon for RNA translation, improving the efficiency of translation[33, 37-38].
The software-predicted secondary structure showed that the 80-124 nt region is free single-stranded and linked to domain Ⅱ. Interrelated secondary structures may have a decisive influence on viral replication, which may be attenuated during the normal passage of the virus due to variations in certain bases in the secondary hairpin or stem-loop structure[39]. Deletion of the stem-loop structure region can stop the virus from multiplying[40]. From an energy point of view, the energy provided by ozone acts on the nucleic acid strand, and as the nucleotides of the single-stranded region are mainly hydrogen bonded at a lower energy level, the energy required to break the single-strand hydrogen bond connection is minimal. Free single-strand breaks between domains Ⅰ and Ⅱ can cause breaks or base mutations, leading to alterations in the secondary structure. Fragmentation of such bases directly results in the deletion of domain Ⅰ, causing loss of viral infectivity.
Traditional methods to detect viruses that involve cell culture are complex and time-consuming, and therefore, they are not feasible for evaluating subtle genetic or molecular effects of disinfectants. Spot hybridization assays and RT-PCR are rapid and scalable but limited in their ability to distinguish between active and inactive viruses[30]. A couple of studies that involved the use of RT-PCR to determine PV1 status after treatment with UV irradiation, chlorine, HCl, and NaOH reported that the detected viral nucleic acids did not correspond with the loss of viral infectivity evidenced in cell culture[41-42]. Likewise, Lim et al. reported that both long and short template RT-PCR assays markedly underestimated the extent of virus inactivation in comparison to plaque-forming assays[43]. Consequently, majority of researchers presumed that as RT-PCR or nucleic acid probes cannot distinguish between inactive and active viruses, these methods could overestimate viral infectivity and are thus unsuitable for a robust evaluation of the effects of disinfectants.
Here we hypothesized that if the inactivation of viruses by disinfectants is based on viral genomic damage, molecular biological techniques should be able to effectively evaluate the effects of disinfectants as these techniques strictly depend on the integrity of target nucleic acids, which are used as a template. Previous researchers only detected target nucleic acid fragments in the coding region of the viral genome, whereas our results suggest that this region harbors the strongest resistance to disinfectants. Furthermore, previous studies have confirmed that the target of disinfectant-induced PV1 inactivation is located in the 5′-NCR, rather than in the coding region[31-32]. Thus, it was presumed that if sequences sensitive to disinfectants were instead used as the detection targets for inactivated viruses, it would be feasible to evaluate the disinfection effect by employing molecular biological techniques. The overall results of this study support this view.
In conclusion, we evaluated the mechanisms by which ozone inactivates PV1 and determined that PV1 inactivation by ozone is associated with damage to the viral genome, rather than to the capsid protein. Our results also indicate that ozone-sensitive genomic targets are located within the 5′-NCR of the PV1 genome.
-
LI Jun Wen, JIN Min, and YANG Dong conceived and designed the experiments; CHEN Na, JIANG Han Ji, YANG Dong, and MIAO Jing performed the experiments; QIU Zhi Gang, SHEN Zhi Qiang, and YIN Jing analyzed the data; WANG Xin Wei, SHI Dan Yang, YANG Zhong Wei, and WANG Hua Ran contributed to material preparation; and JIANG Han Ji and CHEN Na wrote the paper-they equally contributed to this study and share the first authorship.
-
The authors declare no competing financial interests.
the National Key R&D Program of China 2018YFC1602500
the National Key R&D Program of China 2017YFC1601200
Tianjin Science and Technology Support Program 16YFZCSF00340

 Quick Links
 DownLoad: