


HTML
-
Sulfonamides (SAs) are one of the most commonly used antibiotics in human and veterinary medicine[1]. A survey estimated that in 2013, antibiotic usage in China was approximately 162, 000 tons, and that SAs accounted for 5% of the total of antibiotics used[2]. Sulfamonomethoxin (SMM), a SA antibiotic, is widely used in China. Owing to its abuse and slow degradation in the environment, a significant amount of SMM and its metabolites may indirectly enter food[3] and the aquatic environment[4] and may even be ingested by humans[5]. For instance, the detection rate of SAs was 30.2% among 1, 064 school children in China[5]. Currently, there is increasing concern about the neuropsychiatric effects of antibiotics on children's health. Epidemiological studies have revealed that early-life antibiotic exposure can increase the risk of mental disorders[6], and rodent studies have shown that the administration of antibiotics has long-term effects on brain neurochemistry and behavior[7]. Moreover, increasing evidence shows that exposure to antibiotics early in life may have long-term detrimental consequences for health, such as obesity[8], inflammatory bowel disease[9], and even adverse neurocognitive outcomes later in life[6]. Our previous study found that early-life SMM exposure affected brain function, including special learning and memory[10]; briefly, male pups in the high-dose group exhibited significantly longer swimming latency on days 2 (P < 0.001) and 3 (P < 0.05) than those in the control group and the medium- and low-dose groups; the time in the target quadrant clearly decreased (F = 3.157, P < 0.05). However, no difference was found in female offspring.
Increasing evidence demonstrates that early-life exposure to antibiotics is one of the most important factors influencing the brain and behavior through the gut-brain axis. In animal models, oral antibiotic use in adult or adolescent mice induced alterations in gut microbiota associated with behavioral abnormalities, including cognitive impairment[11]. In addition, short-term antibiotic use can result in persistent changes in the human microbiota[12], and early-life exposure to antibiotic may have profound effects on the composition of the microbiota in mothers and infants[13]. However, the related molecular mechanism remains largely unclear.
A major function of the gut bacteria is the digestion of carbohydrates and proteins from the diet. The principal metabolites of this digestive process are short-chain fattey acids (SCFAs), namely acetate, propionate, and butyrate[14]. Although the routes of communication between the gut microbes and the brain vary and are complex, increasing evidence supports the notion that in humans and rodents, SCFAs play crucial roles in modulating brain function, including emotion and cognition[15, 16]. For instance, acetate can cross the blood-brain barrier and activate neurons in the hypothalamus[17], and butyrate has memory-protective functions[18]. Furthermore, the gut microbiota can modulate brain-derived neurotrophic factor (BDNF) in the central nervous system (CNS) by altering the availability and activity of SCFAs in the brain[19]. Moreover, SCFAs affect host behaviors by binding to G protein-coupled receptors (GPRs) 41 and 43 in neuroendocrine cells in the gut, and SCFAs may therefore influence the gut-brain axis[20]. These results indicate that SCFAs may act as mediators between the gut and the brain.
The mammalian target of rapamycin (mTOR) pathway is a convergence point for different extracellular stimuli, and it regulates many integrated physiological functions of the nervous system, including mood, memory storage, and cognition[21]. As known to us, the mTOR can be activated by the PI3K/AKT pathway, and S6K1 or Eukaryotic translation initiation factor 4E (eIF4E)-binding protein 1 (4E-BP1) is often used as an in vivo readout of mTOR activity. Hyperactive hippocampal mTOR signaling contributes to cognitive deficits in several disease models[22]. Chronic inhibition of mTOR by rapamycin enhances learning and memory in adolescent mice and suppresses age-associated cognitive decline in older mice[23]. Moreover, propionate can regulate the mTOR signaling pathway by controlling the expression of AMP-activated protein kinase (AMPK)[24], and butyrate can activate the mTOR signaling pathway by regulating insulin sensitivity[25]. These findings suggest an indirect relationship between SCFAs and the mTOR signaling pathway.
In our previous research, we described neurobehavioral functions such as spatial learning and memory following maternal exposure to SMM during pregnancy[10]. However, the related mechanism is unclear.
In the present study, we investigated the related molecular mechanisms of the effects of maternal SMM exposure during pregnancy on the neurobehavioral development of male offspring. The current findings raise concerns about early-life antibiotic exposure; thus, additional studies should investigate the adverse effects of early-life antibiotic exposure on the growth and development of the brain or CNS.
-
ICR mice (8 weeks old) were purchased from the Beijing Vital River Laboratory Animal Center (Beijing, China), whose foundation colonies were all introduced from the Charles River Laboratories (Boston, MA, USA) and allowed to acclimatize in the animal facility for 1 week. Throughout the experiments, animals were maintained with free access to water and food under 12 h light/12 h dark cycle, and followed the guidelines for relative humane treatment. Following 1-week acclimation to the colony room, the male and female mice were paired in breeders. The existence of a vaginal plug was designated as gestational day (GD) 1. Pregnant females (n = 40) were treated with either normal saline/low/ middle/high doses of SMM sodium with a purity of 99% (CAS: 38006-08-5; Anhui HuaAo Biotechnology Co., Ltd.), namely control group, low- [10 mg/(kg·day)], middle - [50 mg/(kg·day)], and high-dose [200 mg/(kg·day)] groups[26]. And the treated groups received SMM by gavage daily from GD 1 to 18. Parturition before 8 am was designated as postnatal day (PND) 1. Within 24 h after birth, excess pups were removed so that only 5 male pups were kept with the dam (1 litter). In addition, maternal feces, hippocampus and feces of the male pups were collected during the proper period. This study was approved by the ethical committee of Anhui Medical University and the ethical clearance number for the animal study is LISC 20170323.
-
Fecal samples from the male pups were collected on PND 22 and 56, also the dams upon cessation of SMM administration (about GD 18). For each mouse, the samples were collected into Petri dishes through gently stretching the mice or rubbing their abdomen, transferred into microcentrifuge tubes, immediately frozen and stored at -80 ℃ until analysis. When prepared, each sample was weighted (approximately 60 mg) and dipped in 600 μL deionized water for 12 h at 4 ℃. Then the mixture was centrifuged at 13, 000 r/m for 15 min at 4 ℃, subsequently, a small amount of 5 mol/L HCl was added to 100 μL of the supernatant, and homogenated. Finally, the internal standard, n-hexanoic acid solution, was spiked into the supernatant and then the chromatographic analysis was carried out using an Agilent 7890 GC system (Agilent, USA). The experimental conditions of the gas chromatographic analysis were described briefly as the following[27]. Helium was supplied as the carrier gas at a flow rate of 20.0 mL/min. The initial oven temperature was 80 ℃, maintained for 3.0 min, raised to 120 ℃ at 5 ℃/min and held for 6.0 min. The temperature of the flame ionization detector and the injection port was 240 and 200 ℃, respectively. The injected sample volume for GC analysis was 1 μL and data processing was carried out with a HP Chem Station Plus software.
-
In order to observe the long-term effects of SMM exposure on hippocampal mTOR signaling pathway, we collected the pup hippocampus on PND 22 and PND56, respectively. The experimental steps were performed as the preceding literature described but made some changes[27]. After the male pups were sacrificed under anesthesia, the hippocampus were quickly dissected and stored at -80 ℃ until further processed. Following tissue homogenization, total RNA was extracted using TRI-zol Regent (Molecular Research Center, Cincinnati, Ohio, USA) according to the manufacturer's instructions. And the RNA was transcribed into cDNA (A3500, Promega, Fitchburg, Wisconsin, USA). The expression of mRNA was measured by RT-qPCR using the RealStar Power SYBR mixture (GenStar BioSolutionsCo. Ltd., Beijing, China), and the levels were determined through the 2-ΔΔCT method. The primers were synthesized by Sangon Biological Technology (Shanghai, China). And the key genes measured, primer pairs and annealing temperatures are shown in Table 1.
Name Sequence Denaturation (℃) Annealing (℃) Extension (℃) Size (bp) GAPDH Forward: 5'-ACCCCAGCAAGGACACTGAGCAAG-3' 94 95 96 97 Reverse: 5'-GGCCCCTCCTGTTATTATGGGGGT-3' PI3K3ca Forward: 5'-TGTGTTCTCTGCTCGTCAGG-3' 94 95 96 97 Reverse: 5'-GAAACACAGCGAAGTCCACG-3' AKT1 Forward: 5'-CCGCCTGATCAAGTTCTCCT-3' 95 96 97 98 Reverse: 5'-TTCAGATGATCCATGCGGGG-3' mTOR Forward: 5'-CAAGATGCTTGGGACGGGT-3' 96 97 98 99 Reverse: 5'-CATTCCGGCTCTTCAGTCCA-3' RpS6Kb1 Forward: 5'-ATTGAGCTTAAGCAGCCGGT-3' 97 98 99 100 Reverse: 5'-GTCCTCAGCTTCCCTGTGTC-3' eIF4EBP1 Forward: 5'-GCACATACCTCCTTGTGCCT-3' 94 95 96 97 Reverse: 5'-TCCCAGGTAACCCAGCCTAA-3' Note. GAPDH, glyceraldehyde-3-phosphate dehydrogenase; PI3K3ca, phosphatidylinositol 3-kinase, catalytic, alpha polypeptide; AKT1, thymoma viral proto-oncogene 1; mTOR, mechanistic target of rapamycin; RpS6Kb1, ribosomal protein S6 kinase, polypeptide 1; eIF4EBP1, eukaryotic translation initiation factor 4E binding protein 1. Table 1. Primers and Annealing Temperature for RT-PCR
-
On PND 22 and 56, brains in the high-dose group were placed into a pre-cooled mice brain matrix, cut into 3 coronal blacks of 4 mm each and fixed with 4% paraformaldehyde for 24 h. The blocks were dehydrated in ascending concentration of ethanol, embedded in paraffin, and sectioned 5 μm thickness. For immunohistochemistry, the sections were deparaffinized and dehydrated. The sections were immersed in 0.1 mol/L citric acid and steamed in a high-pressure cooker for 10 min for antigen retrieval. Endogenous non-specific biding sites were blocked using 3% hydrogen peroxide at 37% for 60 min. The sections were incubated with anti-mTOR antibody (dilution 1:500, abcam) at 4 ℃ overnight. After sequential incubation with peroxidase conjugated donkey anti-rabbit IgG, 3, 3'-Diaminobenzidine (DAB) was then used as a chromogen to view the reaction using a light microscope. The sections were counterstained by hematoxylin. All incubations were performed in a humidified chamber. The software of Image-Pro Plus (IPP) used to analyze the results of immunohistochemistry.
-
As described in the previous literature with modification[26], on PND 22 and 56, the hippocampus of male pups were separated on ice-cold plate, frozen in liquid nitrogen and stored in -80 ℃ freezer until measured. Hippocampus samples were homogenized in 600 μL RIPA lysis buffer and 6 μL PMSF. Samples were centrifuged at 14, 000 ×g for 15 min and then taked 300 μL supernatants centrifuged at 14, 000 ×g for 10 min. Finally, 200 μL supernatants were collected and the protein concentration was measured by BCA protein assay kit (Pierce, Rockford, IL, USA). After the SDS-PAGE gel electrophoresis, theproteins were transferred to PVDF membranes (Millipore). The membranes were then incubated with mouse anti-PI3K (1:1, 000, Abcam, ab22653) and mouse anti-β-actin (1:1, 000, SantaCruz, sc-81178), rabbit anti-AKT (1:5, 000, Abcam, ab179463), rabbit anti-mTOR (1:2, 000, Abcam, ab2732), rabbit anti-S6K1 (1:2, 500, Abcam, ab32359), rabbit anti-eIF4EBP1 (1:10, 000, Abcam, ab32024) and rabbit anti-SPR (1:500, Abcam, ab103353) primary antibodies overnight at 4 ℃. After washes in TBST three times for 10 min each, the membranes were incubated with goat anti-rabbit IgG antibody and goat anti-mouse IgG antibody for 1.5 h with shaking at room temperature. The membranes were then washed three times in TBST for 10 min each. Finally, membranes were processed for detection using the ECL system.
-
All of the data were expressed as the mean ± SEM. The results of the immunohistochemistry were analyzed with the independent samples t-test. Other data were analyzed using one-way ANOVA. Specific post hoc comparisons between groups were performed using Fisher's protected least significant difference (LSD) tests. Results were considered statistically significant when P < 0.05 (*P < 0.05, **P < 0.01, ***P < 0.001) as compared with controls. Statistics were performed using SPSS Version 23.0 software (SPSS, Chicago, IL, USA).
Animals and Treatment
Measurement of Fecal SCFAs
RT-qPCR Analysis of Key Genes in the mTOR Pathway
Immunohistochemical Expression of mTOR in Pups Hippocampus
Western Blotting
Data Analysis
-
We collected the fecal samples of dams and male offspring and detected SCFA levels. In dams, the acetate concentration in the SMM-treated groups was generally elevated, especially in the low-dose group (Figure 1A, P < 0.05). Notably, the propionate concentration in the middle- and high-dose groups was markedly reduced compared with that in the control group (Figure 1B, P < 0.001). Concurrently, in exposed dams, butyrate levels and total SCFA (sum of butyrate, propionate, and acetate) levels were significantly decreased compared with those in controls (Figure 1C, 1D, P < 0.001).
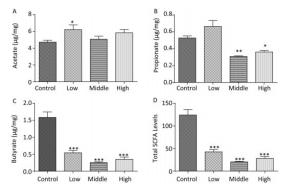
Figure 1. Fecal SCFAs levels in the dams. The fecal SCFAs levels were detected on pregnant day 18. (A) Acetate, (B) Propionate, (C) Butyrate, (D) Total SCFAs levels. Data are presented as mean ± SEM. *P < 0.05, **P < 0.01, ***P < 0.001, compared with controls.
In contrast to dams, the total SCFA levels in male offspring showed an increasing trend on PND 22 (Figure 2D). Moreover, the acetate concentration in the high-dose group (Figure 2A), the propionate concentration in the middle-dose group (Figure 2B), and SCFA levels in the high-dose group were increased compared with those in controls (P < 0.01). However, butyrate, which is known for its anti-inflammatory activity, was markedly reduced in both the middle- and high-dose groups (Figure 2C).
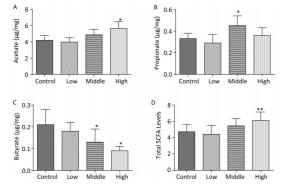
Figure 2. Fecal SCFAs levels in the male offspring on PND 22. The fecal SCFA levels were detected on postnatal day 22. (A) Acetate, (B) Propionate, (C) Butyrate, (D) Total SCFA levels. Data are presented as mean ± SEM. *P < 0.05, **P < 0.01, compared with controls.
On PND 56, the acetate concentration in the middle-dose group (Figure 3A), the propionate concentration in the low-dose group (Figure 3B), and the butyrate concentration and the total SCFA levels in both the low- and middle-dose groups were increased compared with those in controls (Figure 3C, D, P < 0.01). Thus, exposure to SMM early in life not only changed the SCFA level in dams but also had long-term effects on SCFA metabolism in male offspring. According to our study results, the compensatory increase in total SCFA levels in male offspring might have been due to the exposure of male offspring to lower doses of SMM in utero.
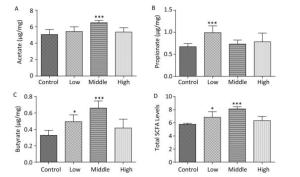
Figure 3. Fecal SCFAs levels in the male offspring on PND 56. The fecal SCFAs levels were detected on PND 56. (A) Acetate, (B) Propionate, (C) Butyrate, (D) Total SCFAs level. Data are presented as mean ± SEM. *P < 0.05, ***P < 0.001, compared with controls.
-
Table 2 presents the mRNA expression of key genes implicated in the mTOR pathway on PND 22. The mRNA expression of PI3K3ca and AKT1 in the hippocampus was significantly elevated in the SMM-treated groups (P < 0.05), and the mRNA expression of mTOR and RpS6Kb1 was increased.
mRNA Control Low Middle High F P PI3K3ca 1.00 ± 0.04 1.30 ± 0.12** 1.20 ± 0.17 1.26 ± 0.04* 4.72 0.035 AKT1 1.00 ± 0.05 1.13 ± 0.10 1.24 ± 0.06** 1.22 ± 0.07** 6.85 0.013 mTOR 1.00 ± 0.47 1.31 ± 0.32 1.23 ± 0.33 1.32 ± 0.23 0.56 0.659 RpS6Kb1 1.00 ± 0.39 1.46 ± 0.54 1.27 ± 0.46 1.53 ± 0.10 1.08 0.419 eIF4EBP1 1.00 ± 0.19 1.18 ± 0.59 0.90 ± 0.15 0.88 ± 0.05 0.53 0.673 Note. SMM, sulfamonomethoxine; mRNA, messenger RNA; mTOR, mammalian target of rapamycin. Data were presented as mean ± SEM. *P < 0.05, **P < 0.01, compared with controls. Table 2. Hippocampal mRNA Levels in the mTOR Pathway of Male Offspring on Postnatal Day 22
As shown in Table 3, on PND 56, marked increases in the mRNA expression of PI3K3ca in the low-dose group as well as of AKT1 and mTOR in the high-dose group were detected compared with those in controls (P < 0.01), and the mRNA expression of RpS6Kb1 was increased. The low- and high-dose groups also expressed higher mRNA levels of eIF4EBP1 compared with those in the control group (P < 0.05).
mRNA Control Low Middle High F P PI3K3ca 1.00 ± 0.03 1.25 ± 0.05*** 1.07 ± 0.03 1.07 ± 0.06 17.50 0.0007 AKT1 1.00 ± 0.02 0.99 ± 0.13 1.02 ± 0.13 1.26 ± 0.04* 4.93 0.0379 mTOR 1.00 ± 0.09 1.18 ± 0.01 1.15 ± 0.15 1.47 ± 0.10** 8.93 0.0086 RpS6Kb1 1.00 ± 0.06 1.15 ± 0.04 1.04 ± 0.29 1.25 ± 0.24 0.83 0.5187 eIF4EBP1 1.00 ± 0.10 1.22 ± 0.06* 1.08 ± 0.11 1.31 ± 0.09** 6.40 0.0161 Note. SMM, sulfamonomethoxine; mRNA, messenger RNA; mTOR, mammalian target of rapamycin. Data were presented as mean ± SEM. *P < 0.05, **P < 0.01, ***P < 0.001, compared with controls. Table 3. Hippocampal mRNA Levels in the mTOR Pathway of Male Offspring on Postnatal Day 56
-
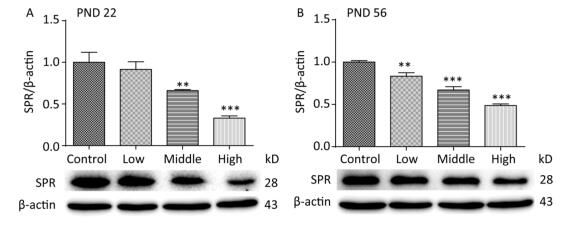
SPR catalyzes the reduction of sepiapterin to dihydrobiopterin (BH2), which is the precursor for tetrahydrobiopterin (BH4). Our previous study indicated that the serum concentration of BH4 on PND 22 was significantly reduced in male offspring treated with a high dose of SMM[27]. In the current study, we further investigated SPR protein expression in the hippocampus of male offspring. On PNDs 22 (Figure 4A) and 56 (Figure 4B), SPR protein expression was significantly decreased in all SMM-treated groups compared with that in the control group (Figure 4, P < 0.001).

Figure 4. Total protein expression of SPR in pups hippocampus on PND 22 and 56. SPR: Sepiapterin reductase, PND: postnatal day. (A) The expression of SPR on PND 22, (B) The expression of SPR on PND 56. Data are presented as mean ± SEM. **P < 0.01, ***P < 0.001, compared with controls.
-
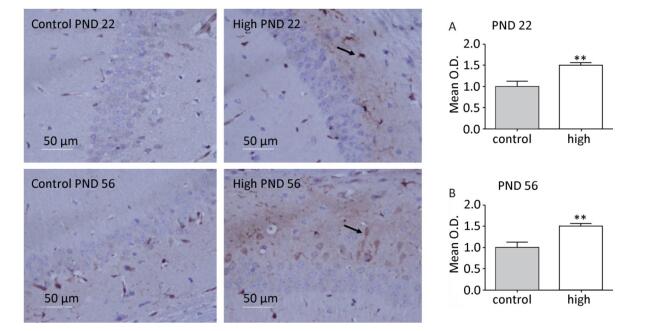
The CA1 region of the hippocampus is closely related to memory and cognitive function of the brain. Therefore, in this study, we assessed mTOR expression in the hippocampal CA1 area. The immunochemistry results (Figure 5) revealed that compared with the control group, mTOR expression in the hippocampal CA1 area increased in the high-dose group on PND 22 (P < 0.01) and PND 56 (P < 0.01).
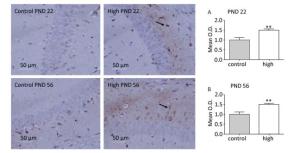
Figure 5. mTOR activity in hippocampal CA1 area. PND: postnatal day, (A) activity of mTOR on PND 22, (B) Expression of mTOR on PND 56. Data are presented as mean ± SEM. **P < 0.01, compared with controls.
-
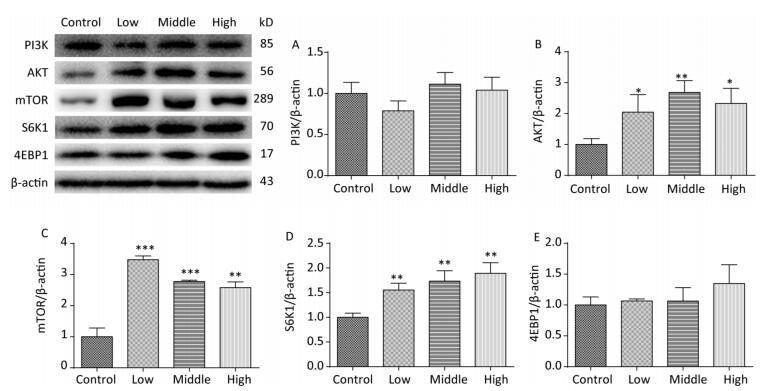
On PND 22, SMM significantly increased the expression of AKT (Figure 6B, P < 0.01), mTOR (Figure 6C, P < 0.001), and S6K1 (Figure 6D, P < 0.01) in the hippocampus in the SMM-treated groups compared with the control group. However, no difference was observed in the expression of the PI3K (Figure 6A) and 4EBP1 (Figure 6E) between the SMM-treated groups and the control group. These results provided evidence that the mTOR signaling pathway was upregulated on PND 22.

Figure 6. Expression of related proteins of mTOR signaling pathway in male offspring on PND 22. PI3K: Phosphatidylinositol 3-kinase, AKT: protein kinase B, mTOR: mammalian target of rapamycin, S6K1: ribosomal protein S6 kinase 1, 4EBP1: 4E-binding protein 1, PND: postnatal day. (A) PI3K expression, (B) AKT expression, (C) mTOR expression, (D) S6K1 expression, (E) 4EBP1 expression. Data are presented as mean ± SEM. *P < 0.05, **P < 0.01, ***P < 0.001, compared with controls.
On PND 56, the expression levels of PI3K (Figure 7A, P < 0.001), mTOR (Figure 7C, P < 0.001), S6K1 (Figure 7D, P < 0.001), and 4EBP1 (Figure 7E, P < 0.001) were upregulated in SMM-treated groups compared with control group; these results were consistent with those for mRNA expression. These findings indicate that maternal SMM exposure during pregnancy led to the upregulation of the mTOR signaling pathway in the hippocampus of offspring until puberty.
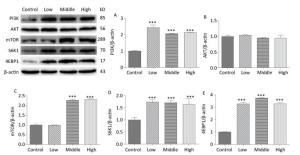
Figure 7. Expression of related proteins of mTOR signaling pathway in male offspring on PND 56. PI3K: Phosphatidylinositol 3-kinase, AKT: protein kinase B, mTOR: mammalian target of rapamycin, S6K1: ribosomal protein S6 kinase 1, 4EBP1: 4E-binding protein 1, PND: postnatal day. (A) expression of PI3K, (B) expression of AKT, (C) expression of mTOR, (D) expression of S6K1, (E) expression of 4EBP1. Data are presented as mean ± SEM. ***P < 0.001, compared with controls.
SCFA Levels in Feces of Dams and Male Pups
mRNA Expression of Key Genes Involved in the mTOR Pathway in the Male Pup Hippocampus
Expression of SPR Protein in the Hippocampus of Male Pups
Immunohistochemical Expression of Hippocampal mTOR Protein
Expression of Related Proteins of the mTOR Singling Pathway in Male Offspring
-
SAs are the most frequently dispensed drugs in animal husbandry in China, but their long-term effects on brain function have received scant attention until recently. Several clinical reports have shown an association between early-life antibiotic use and the risks of inflammatory bowel disease, obesity, and poorer neurocognitive outcomes later in life[6, 8]. Our previous study showed no significant differences in maternal bodyweight during pregnancy between SMM-treated and control groups; furthermore, organ coefficients for organs such as the brain, liver, and gastrocnemius in pups were not different from those in controls[10]. Based on these results, we speculate that SMM might not immediately affect the CNS but may indirectly affect brain function through some pathway. Compelling evidence demonstrates that intestinal bacteria contribute to neurological disorders, and scientists have reported links between the composition of bacteria in the gut and autistic behavior[28].
In this study, we measured fecal SCFA levels to assess whether maternal SMM exposure during pregnancy results in gut microbiota dysbiosis in dams and pups. The results showed that the levels of acetate, propionate, and butyrate and the total SCFA levels were generally elevated in male offspring on PND 56, which might account for the growth- promoting effect of the antibiotic. Notably, the metabolic dysbiosis induced by SMM in pups was still present even 8 weeks after cessation of SMM administration. Significantly decreases were observed in fecal butyrate, which is known to protect against mental health problems, in both dams and male offspring on PND 22. The findings indicate that the gut of pups is probably colonized at birth by altered maternal microbiota[29]. The altered microbial metabolites in early life may play a causal role in the microbiota-brain interaction associated with mental diseases.
SCFAs are the principal metabolites of digestion by the gut bacteria and may contribute toward maintaining the blood-brain barrier. Furthermore, acetate activates the parasympathetic nervous system, thus leading to the increased secretion of ghrelin[30]. Butyrate, propionate, and succinate activate intestinal gluconeogenesis, which results in central metabolic improvement through the gut- brain neural circuits[31]. The aforementioned roles of SCFAs protect against mental health problems. Moreover, the intraventricular administration of SCFAs and propionic acid in rats induces abnormal motor movements, electrographic changes, cognitive deficits, and impaired social interactions[32]. A previous population-based study showed that total fecal SCFA concentrations were significantly higher in children with autism spectrum disorder than in controls (136.6 ± 8.7 vs. 111.1 ± 6.6 mmol/kg)[33]. These results indicate that SCFAs represent a group of compounds derived from the host microbiome with long-lasting complex effects such as the development of cognitive disorders through the gut-brain axis. Currently, the definite functions of individual SCFAs or total SCFA remain unclear. Additional studies are required to understand the complex interactions between SCFAs. In other words, additional studies should be conducted to identify the potential molecular mechanisms through which SCFAs induce the development of cognitive disorders.
The current findings demonstrated reduced SPR protein expression in the hippocampus of male pups on PNDs 22 and 56; the SPR protein is correlated with the BH4 synthetic pathway. One study reported that SAs interfered with BH4 biosynthesis through the inhibition of SPR[34]; this finding is similar to those obtained in our results. Reports have demonstrated that BH4 deficiency is related to the mTOR signaling pathway; a study proposed that the mTORC1 signaling pathway in the brain is one of the potential targets for understanding abnormal behaviors associated with BH4 deficiency[35]. Based on these results, decreased SPR protein expression in this study may be involved in the upregulation of the mTOR signaling pathway.
In the present study, importantly, the upregulation of mTOR signals induced by SMM on PND 22 was still present on PND 56, even 8 weeks after cessation of SMM administration. Moreover, the mTOR level was increased in the hippocampal CA1 area in the high-dose group compared with that in the control group. A previous study indicated that mild cognitive disorders in patients with Alzheimer disease (AD) were accompanied by hyperactivation of the PI3K/AKT/mTOR pathway and increases in mTOR downstream targets, such as p70S6K and 4EBP1[36]. In addition, another study indicated that the suppression of mTOR signaling could attenuate memory deficits[37]. One study demonstrated that the hyperactive mTOR/p70S6K signaling pathway in the hippocampus was related to the development of cognitive disorders in mice with diabetes mellitus (DM)[38]. Furthermore, compared with control mice, the spatial learning and memory function of the diabetic mice was significantly impaired, and inhibiting mTOR signaling by rapamycin prevented the DM-related cognitive deficits[38]. These results indicate that the aberrant upregulation of the mTOR signaling pathway is associated with cognitive impairment. Although the levels of phosphorylated proteins were not measured in the current study, our results still support the supposition that cognitive impairment is associated with the sustained upregulation of mTOR signaling in the hippocampus.
The normal activity of mTOR is essential to memory, and hyperactivity or hypoactivity of mTOR can disrupt memory formation. For example, hyperactivation of mTOR has recently been reported to be a primary cause of intellectual disability in mouse models[39]. In addition, many genetic diseases in which intellectual disability or cognitive deficits are observed are associated with mTORC1 overactivation[40]. mTORC1 is also involved in cognitive impairment associated with Down syndrome; this impairment is related to the upregulation of mTORC1 signaling that persists during postnatal development[41]. The aforementioned findings suggest that the sustained activation of the mTOR signaling pathway may lead to cognitive impairment, which is consistent with the results of our current study.
Although research has found antibiotic-induced severe neurotoxicity in rodents and other organisms, few neurotoxic mechanisms are implicated in the gut-brain mTOR pathway. The gut microbiota can modulate BDNF function in the CNS by altering the availability and action of SCFAs in the brain[19]. This suggests that SCFAs might communicate with the brain through the regulation of BDNF levels. BDNF modulates the activity of brain nerves and the plasticity of synapses, and it has a close relationship with learning and memory function[42]. The role of the hippocampal BDNF-mTOR signaling pathway in spatial learning and memory dysfunction has been elucidated[43]. Based on these findings, we speculate that changes in SCFA metabolism induced by early-life SMM exposure might upregulate the expression of proteins involved in the hippocampal mTOR pathway and may finally contribute to impaired spatial memory and cognition in male mice offspring.
Our study has several limitations. First, we did not characterize important variables of the microbiota through high-throughput sequencing platforms, such as gut microbiota composition and diversity, in dams or pups. Second, we did not measure phosphorylated proteins involved in the mTOR pathway and mTOR levels in all SMM-treated mice through immunohistochemistry. Given that the SMM-induced dysfunction of learning and memory was more severe in male offspring, we only analyzed mRNA or protein levels in male offspring; the underlying biological basis of sex differences in cognitive behavior remains unknown. Third, the relationship between fecal SCFA and brain SPR was not investigated in this study. Finally, chronic maternal exposure during pregnancy may not completely mimic the actual exposure of the human fetus to SMM. Future studies should focus on the optimal dosing and duration of chronic SMM exposure in utero that can result in longer-term effects on host physiology and neurobiology.
-
The authors declare no conflicts of interest.
-
We are deeply grateful for the help provided by Professor XU De Xiang and all the members in the Department of Toxicology of Anhui Medical University.
Natural Science Research in Colleges and Universities of Anhui province KJ2017A189
the National Natural Science Foundation of China 81202209
Natural Science Research in Colleges and Universities of Anhui province KJ2018A0164

 Quick Links
 DownLoad: