


-
Acinetobacter harbinensis HITLi 7T, a novel species in the genus Acinetobacter, was isolated from Songhua River in Harbin, China. It is a psychrotolerant heterotrophic nitrification bacterium that grows in temperatures from 2 ℃ to 35 ℃ with an optimal growth temperature of 8 ℃- 20 ℃[1]. The strain plays an important role in ammonium removal from source water and water sanitation improvement in cold areas. Biologically enhanced activated carbon (BEAC) filters immobilized with HITLi 7T are used to treat source water in winter, exhibiting stronger ammonium removal capability and higher microbial stability during BEAC treatment at low temperatures[2]. However, the low temperature adaptation mechanism of HITLi 7T has not been clearly elucidated yet.
Temperature is a major environmental factor that affects bacterial growth. Low temperatures inhibit bacterial growth and alter physiological characteristics. Most research regarding bacterial adaptation to cold focuses on the cold shock response. Cold shock induces cold shock protein (Csp) production to reduce the harmful effect of temperature downshift[3] and induces changes in expressed genes associated with metabolism, regulation, and fatty acid biosynthesis[4].
In this study, we investigated the gene expression profiles of HITLi 7T grown at a low temperature (2 ℃) and optimal temperature (20 ℃) by high throughput sequencing and transcriptomic analysis. We systematically assessed the change of expressed gene associated with adaptation to the low temperature conditions. Some differentially expressed genes (DEGs) were validated by RT-qPCR. This study facilitates to elucidate the molecular mechanism of HITLi 7T adaptation to low temperatures and enrich our knowledge of the low temperature adaptation mechanism of the Acinetobacter genus.
HITLi 7T was grown in liquid culture containing 0.382 g/L NH4Cl, 2.0 g/L CH3COONa, 0.05 g/L MgSO4·7H2O, 0.2 g/L K2HPO4, and 0.12 g/L NaCl with pH 7.0 at 20 ℃ for 24 h, re-suspended in the flesh culture, and incubated at 2 ℃ and 20 ℃ for 4 days. The experiment was conducted in triplicate for each temperature condition. The cultures were precipitated by centrifugation at 8, 000 rpm for 5 min and then washed with DEPC treated water. The cells were harvested and immediately frozen in liquid nitrogen.
Total RNA was extracted from cells using the Trizol reagent according to the manufacturer's instructions (Invitrogen). The quality and concentration of total RNA were checked by gel electrophoresis and with a spectrophotometer. Library construction and Illumina sequencing were performed at Huada Gene Technology Co., Ltd., Shenzhen, China. The library was constructed using 5 μg total RNA with TruSeq RNA Sample Prep Kit v2 from Illumina. The final library was detected by determining the average molecule length using Agilent 2100 bioanalyzer instrument (DNA 1000 Reagents) and quantifying concentration by qPCR (Taqman probe). The paired-end library was sequenced with the Illumina HiSeq 2000 system.
The raw reads were trimmed by removing low-quality reads (Q value < 20) and adapter sequences. The clean reads were assembled with Trinity assembler v2.0.6. The assembled sequences were clustered and redundancy was checked to obtain non-redundant transcripts with TGICL software v2.0.6. These transcripts were annotated to NT, NR, GO, COG, KEGG, SwissProt, and InterPro databases using Blastn, Blastx, Diamond, Blast2GO, and InterProScan5 software.
The RSEM package was used to measure gene expression level. Differential expression analysis was performed using DEseq2 method. The RPKM values were used for deriving the log fold changes. The probability threshold P-value ≤ 0.05 and the absolute value of log2 (Fold Change) ≥ 1 were used as criteria for judging differentially expressed genes (DEGs). A principle component analysis (PCA) was conducted using DESeq2 to determine the overall reproducibility of RNA-Seq biological replicates. The DEGs were clustered using the pheatmap function in R software. All DEGs were classified and enriched in function and biological pathways by comparison on GO and KEGG databases using the phyper function in R software.
To validate the RNA-Seq results, 16 up-regulated genes were selected to perform RT-qPCR. The primers used in RT-qPCR were given in Supplementary Table S1 (available in www.besjournal.com). RT-qPCR was performed using StepOne (ABI, America) in a final volume of 20 μL containing 1 μL of cDNA, 10 pmol of each primer, 10 μL of 2 × SuperReal Color PreMix, 2 μL of 50 × ROX together with no template as negative control. A two-step reaction procedure was adopted: pre-denaturation at 95 ℃ for 15 min, denaturation at 95 ℃ for 10 s, annealing at 60 for 30 s, 40 cycles. All procedures were performed in triplicate. The relative gene expression levels were calculated using the 2-ΔΔCT method with 16S rRNA as a reference gene.
Gene ID Sequence 5'to 3' Size (bp) Reference Unigene1084_All GCGTAAAGGCCAGCGTATTG
AGAGTGTGTCATGCGTCCAG180 This study Unigene751_All ATGCCAGTGCTGATGTCGAA
CGCATCACGTTCACGAATCC119 This study Unigene648_All CCGGTAACCGAAGTGTGTGA
AAGGGTAAGGGCTTGATGGC105 This study Unigene933_All TATGTGTCCGTTCAGCGAGG TGAACAGCCAGTCGCAGAAT 116 This study Unigene1454_All GGTTTCAGGAGAGCTGGCAT
ATGGCGTCTGCCATGAGAAA102 This study Unigene1683_All GAATGCCGACGTCTTGAAGC
CATCTCCCAGCCTCGATCAC73 This study CL16.Contig5_All ACGCTCAGTACGTGGTTTGT
GATCGTCCTGCTACTCCACG141 This study Unigene463_All GGCGGTGACTGGTTAAGTGA
CATCGGCGTTACGGTCAAAC112 This study Unigene1324_All AATCGACTGTCGTGCCACTT
AGCCTTACAATGGTCGGTGG118 This study Unigene536_All TTCAGAAATAGGCGCTGCGA
CACTGGCCGTACTGGGTATC92 This study Unigene560_All ACGGTGATGACTGCACCATT
AATGCCCGCTTTTGAAACCC129 This study Unigene1443_All AGGGTGAATAATGGCGGCAA
AAGAAAAGCGTGAGCAAGCG83 This study Unigene530_All CTAAACACGCTGAAGCGGC
TCTGCTTTGGCTTTGGTTGC70 This study Unigene3_All GCGTGCAAGCACCTTTTGTA
GGAAGCTTTTATGGCGCTCG117 This study Unigene728_All TCGATGGTTTTCCCTGGTCG
AGAGATGCGTATTGGCCGAG102 This study CL12.Contig1_All CAGCAGGGCGTATGTTC
TCGCTAACTCTGGCTTC185 This study 16s RNA CTCCTACGGGAGGCAGCAG
ATTACCGCGGCTGCTGG162 This study Note. 16 up-regulated genes at low temperature involved in metabolism, regulation, translation, stimulus response and DNA repair are randomly selected for confirmation by RT-qPCR. The specificity of these primers was verified by conventional PCR amplification and gene sequencing. Table Supplementary Table S1. Primers Used for RT-qPCR
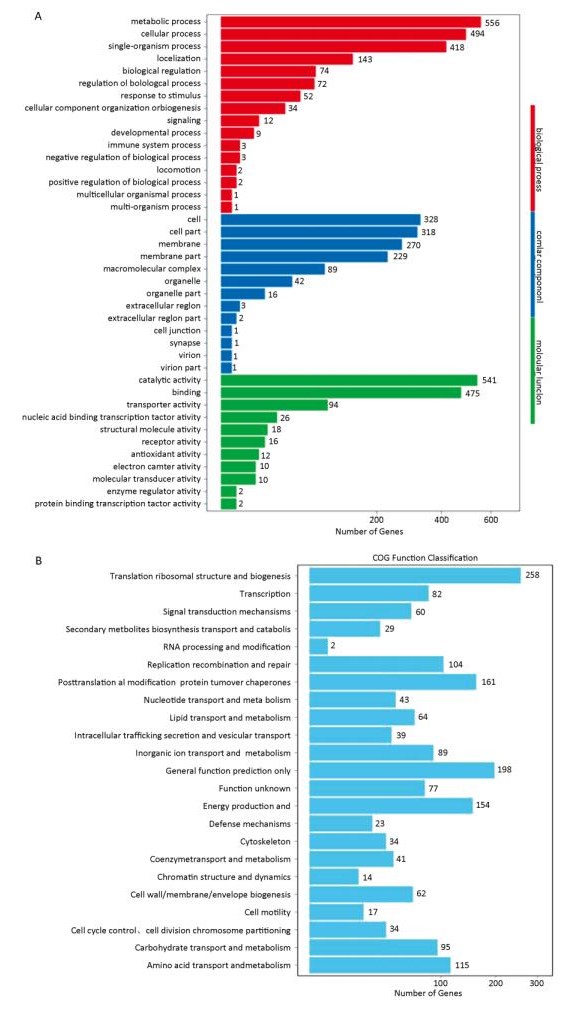
The sequencing results of three parallel samples were similar; 13.73 Mb and 13.08 Mb clean reads were generated from treated and control samples, respectively. Removing partial overlapping and short sequences (< 300 bp in length) yielded 3, 104 unique genes with an average size of 1, 277 bp. These unique genes were annotated on the relevant databases. In total, 2, 535 unique genes were annotated on 7 databases, accounting for 81.6% of total unique genes (Table 1). KEGG analysis revealed that 56.6% of unique genes participated in metabolic processes and 20.7% were assigned to genetic information processing (Supplementary Figure S1A, available in www.besjournal.com). GO classification showed that 953 unique genes were assigned to 40 GO terms. More unique genes were attributed to metabolic and cell processes (Supplementary Figure S1B). COG annotation indicated that 1, 384 unique genes were clustered to 23 COG categories. The largest group is translation and ribosomal structure biogenesis, containing 258 genes (Supplementary Figure S1C).
Values Total Nt Nr Swiss Prot KEGG COG Inter pro GO Inter Section Overall Number 3, 104 948 1, 720 1, 575 1, 742 1, 384 2, 115 953 577 2, 535 Percentage (%) 100.0 30.5 55.4 50.7 56.1 44.5 68.1 30.7 18.5 81.6 Table 1. Results of Functional Annotation of Unique Genes

Figure Supplementary Figure S1. Function annotation statistics of unique genes.
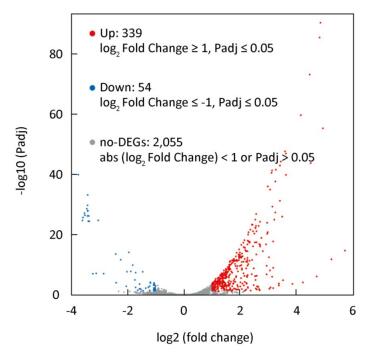
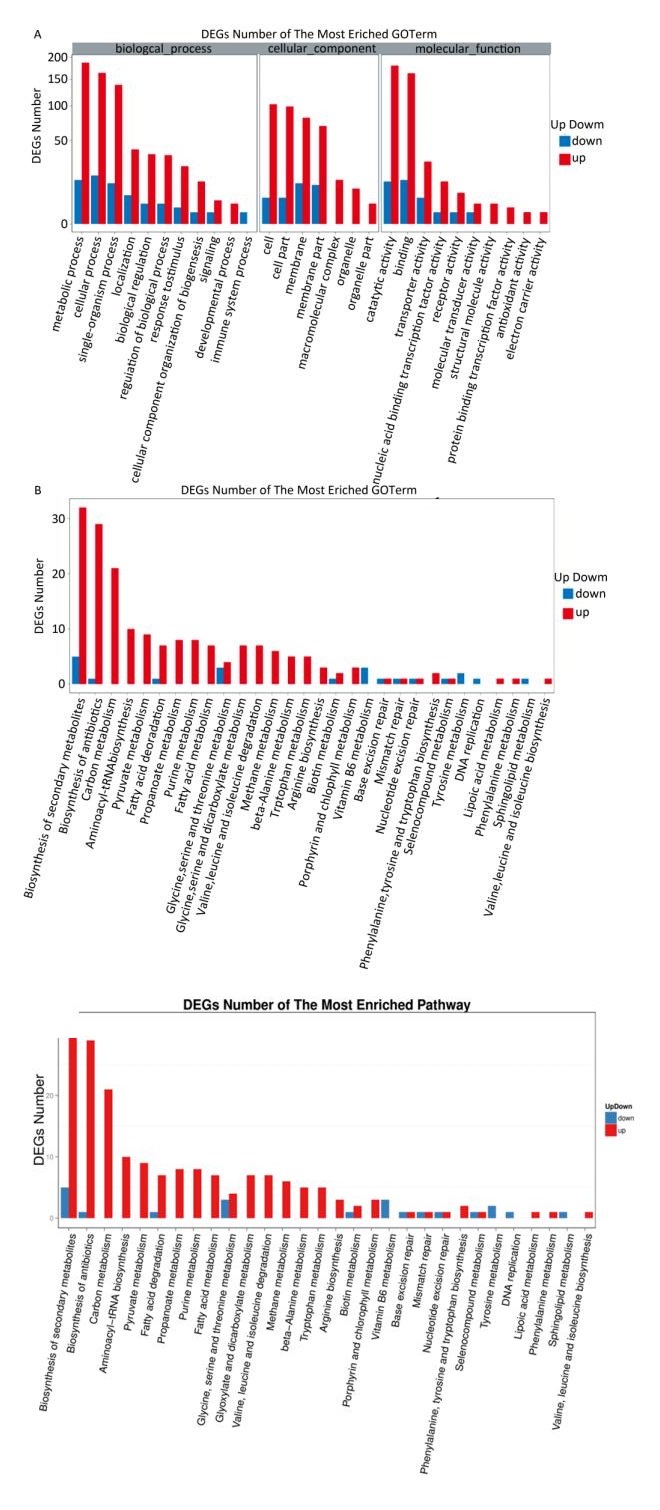
In total, 393 DEGs were identified, of which 339 and 54 were up-and down-regulated, respectively, at 2 ℃, accounting for 86.3% and 13.7% of total DEGs, respectively (Figure 1). The results indicated that the larger number of DEGs induced up-regulation to adapt to low temperature conditions. GO function annotation showed that 289 DEGs were enriched in 28 GO terms (Supplementary Figure S2A, available in www.besjournal.com). Most DEGs were associated with metabolic, cellular, regulatory, and stimuli response processes. KEGG analysis indicated that 80 DEGs were enriched in 30 pathways. Most DEGs participated in metabolism pathways (Supplementary Figure S2B).

Figure 1. Volcano plot of differentially expressed genes.

Figure Supplementary Figure S2. GO and KEGG function annotation of differently expressed genes.
Of down-regulated genes, 39 were predicted to encode a hypothetical protein with unknown function and 19 were putatively involved in biological processes. The majority of hypothetical protein genes were down-regulated more than five times. Thus, further work is necessary to evaluate the possible role of these genes in low temperature adaptation. The gene Unigene1254_All encoding ClpV1 family T6SS ATPase and the gene Unigene1274_All encoding type Ⅵ secretion protein EvpB were putatively related to type Ⅵ secretion system (T6SS) and down-regulated (3.0-fold and 3.3-fold) in low temperature conditions, implying reduced T6SS-mediated intoxication toward cell growth at low temperatures. Some down-regulated genes were listed in
Supplementary Table S2 available in www.besjournal.com.Gene ID Description Fold Change CL6.Contig1_All hypothetical protein 13.5 Unigene630_All hypothetical protein 12.2 Unigene473_All IclR family transcriptional regulator 3.4 Unigene399_All biotin synthase BioB 4.1 Unigene1254_All ClpV1 family T6SS ATPase 3.0 Unigene1274_All type Ⅵ secretion protein EvpB 3.3 CL55.contig1_All MFS transporter 5.4 Unigene1085_All proline/sodium symporter 2.8 Unigene1160_All cation/acetate symporter 3.9 Unigene919_All fumarylacetoacetase 3.5 Unigene999_All alcohol dehydrogenase 3.7 CL6.Contig4_All hypothetical protein 12.0 Unigene183_All hypothetical protein 10.5 Unigene1621_All hypothetical protein 9.4 Table Supplementary Table S2. Down-regulated DEGs at Low Temperature
The majority of up-regulated genes were involved in metabolic, regulatory, substance transport, translation, stimuli response, and cell division processes (Supplementary Table S3, available in www.besjournal.com), indicating that the adaptation of HITLi 7T to low temperatures involves the extensive regulation of biological processes. A significant effect of low temperature on metabolism was observed. A large number of genes associated with carbohydrate and amino acid metabolism appeared to be up-regulated, implying the increase of the basal metabolic activity of HITLi 7T at low temperatures and supply of sufficient substrate and energy for rapid growth at low temperature.
Functional Group Gene ID Description Fold Hange TCA cycle Unigene581_All
Unigene226_Allfumarate hydratase
2-oxoglutarate dehydrogenase4.2
3.1Unigene788_All isocitrate dehydrogenase 2.4 Unigene569_All dihydrolipoyl dehydrogenase 2.5 Unigene230_All phosphoenolpyruvate carboxylase 2.9 Unigene1260_All aconitate hydratase B 2.7 Unigene463_All succinate dehydrogenase flavoprotein subunit 3.1 Unigene103_All malate synthase G 3.0 Pentose phosphate pathway Unigene1253_All fructose-bisphosphatase 2.1 Unigene585_All transketolase 2.8 Pronanoate mechanism Unigene1166_All acyl-CoA dehydrogenase 2.9 Unigene569_All dihydrolipoyl dehydrogenase 2.5 Unigene899_All acetyl-CoA synthetase 2.6 Unigene115_All acyl-CoA dehydrogenase 4.6 Unigene945_All aminoglycoside phosphotransferas 3.3 Unigene652_All acyl-CoA dehydrogenase 2.8 Unigene1172_All acetyl-CoA acetyltransferase 5.6 Unigene758_All acyl-CoA dehydrogenase 2.8 Glycolysis Unigene1068_All phosphoglycerate mutase 3.3 Unigene650_All glucose-6-phosphate 1-epimerase 2.8 Unigene195_All phosphoenolpyruvate synthase 2.5 Unigene899_All acetyl-CoA synthetase 2.6 Unigene569_All dihydrolipoyl dehydrogenase 2.5 Unigene1253_All fructose-bisphosphatase 2.1 Unigene54_All phosphoenolpyruvate carboxykinase 5.8 Pyruvate mechanism Unigene195_All phosphoenolpyruvate synthase 2.5 Unigene103_All malate synthase G 3.0 Unigene1324_All 2-isopropylmalate synthase 8.3 Unigene1447_All histidine kinase 2.3 Unigene820_All malate dehydrogenase 2.0 Unigene569_All dihydrolipoyl dehydrogenase 2.5 Unigene899_All acetyl-CoA synthetase 2.6 Unigene1172_All acetyl-CoA acetyltransferase 5.6 Unigene581_All fumarate hydratase class Ⅱ 4.2 Unigene300_All 4-hydroxy-3-methylbut-2-enyl diphosphate reductase 2.7 Unigene1068_All phosphoglycerate mutase 3.3 Amino acid metabolism Unigene340_All amidase 3.2 Unigene1102_All glutamate synthase 10.8 Unigene1429_All imidazole glycerol phosphate synthase 6.4 Unigene1528_All glutathione synthase 2.5 Unigene1419_All argininosuccinate lyase 3.4 Unigene582_All glutamine--fructose-6-phosphate aminotransferase 3.4 Unigene2_All glutamine synthetase 2.1 Unigene1324_All 2-isopropylmalate synthase 8.3 Unigene226_All 2-oxoglutarate dehydrogenase 3.1 Unigene402_All glutamate-1-semialdehyde aminotransferase 5.9 Unigene1172_All acetyl-CoA acetyltransferase 5.6 Unigene1166_All acyl-CoA dehydrogenas 2.9 Unigene115_All acyl-CoA dehydrogenase 4.6 Unigene945_All aminoglycoside phosphotransferase 3.3 Unigene652_All acyl-CoA dehydrogenase 2.8 Unigene758_All acyl-CoA dehydrogenase 2.8 CL5.Contig1_All glycerate dehydrogenase 2.1 CL5.Contig2_All glycerate dehydrogenase 2.6 Unigene1599_All L-glutamate gamma-semialdehyde dehydrogenase 7.7 Unigene1090_All diaminopimelate decarboxylase 3.8 Unigene988_All 3-phosphoshikimate 1-carboxyvinyltransferase 6.3 Unigene50_All N-acetylglutamate synthase 2.3 Unigene729_All lipid-A-disaccharide synthase 2.8 Unigene1165_All anthranilate phosphoribosyltransferas 3.1 Unigene788_All isocitrate dehydrogenase 2.4 Unigene585_All transketolase 2.8 Unigene1324_All 2-isopropylmalate synthase 8.3 Unigene1165_All anthranilate phosphoribosyltransferase 3.1 Protein transport Unigene1163_All outer membrane lipoprotein carrier protein LolA 2.7 Unigene99_All signal recognition particle protein 3.7 Unigene390_All permease 3.6 Lipid transport Unigene1076_All lipid A export permease 3.2 CL13.Contig1_All LPS biosynthesis protein 2.8 CL13.Contig2_All LPS biosynthesis protein 2.1 Amino acid transport Unigene1071_All lysine transporter 2.2 Unigene1122_All threonine transporter RhtB 5.9 Unigene1415_All D-alanine/D-serine/glycine permease 2.1 Unigene375_All amino acid transporter 10.6 Unigene536_All branched-chain amino acid transport system Ⅱ carrier protein 6.0 Ion transport Unigene551_All macrolide transporter 3.4 Unigene107_All ferrous iron transporter B 12.3 Unigene1595_All MFS transporter 3.4 Unigene1416_All SNF family Na+-dependent transporter 4.6 Unigene1_All MATE family efflux transporter 3.6 Unigene1261_All MFS transporter 3.3 Unigene29_All uracil transporter 2.4 Unigene1177_All NAD(P)(+) transhydrogenase 5.9 Unigene9_All ATPase 4.1 Unigene11_All sulfate transporter 3.7 Unigene1240_All sodium:proton antiporter 3.1 Unigene1642_All sodium:proton antiporter 2.8 Unigene984_All zinc ABC transporter 2.2 Unigene1348_All potassium-transporting ATPase subunit B 9.0 Unigene120_All cation transporter 2.0 CL10.Contig3_All copper ABC transporter 3.0 Unigene605_All magnesium transporter 2.8 Unigene1086_All betaine/carnitine/choline family transporter 3.0 Unigene1261_All MFS transporter 3.3 Unigene583_All TonB-dependent receptor 3.7 Unigene1693_All TonB-dependent receptor 2.0 Unigene243_All iron-sulfur cluster insertion protein ErpA 7.0 Transcription Unigene1333_All integration host factor subunit alpha 9.3 regulator Unigene1454_All RNA polymerase factor sigma-32 RpoH 2.4 Unigene1683_All RNA polymerase sigma factor RpoD 3.9 Unigene109_All RNA polymerase-associated protein RapA 4.0 Unigene738_All hypothetical protein 2.4 Unigene933_All AraC family transcriptional regulator 5.9 Unigene1500_All Fur family transcriptional regulator 2.7 Unigene392_All transcriptional regulator Crp 2.3 Unigene578_All DNA-binding response regulator 2.1 Unigene1508_All LysR family transcriptional regulator 4.0 Unigene113_All transcriptional regulator 2.6 Unigene1519_All AraC family transcriptional regulator 2.6 Unigene1290_All AraC family transcriptional regulator 2.7 Unigene1675_All ArsR family transcriptional regulator 5.8 Unigene1599_All bifunctional proline dehydrogenase (RHH-type transcriptional regulator) 7.7 Unigene1288_All TetR family transcriptional regulator 3.5 CL12.Contig1_All cold-shock protein 10.3 Unigene1079_All hypothetical protein 2.6 Unigene806_All DNA-binding protein 8.1 Unigene1296_All ribosomal RNA small subunit methyltransferase B 6.5 Unigene1431_All transcription-repair coupling factor 2.2 Nucleic acid replication and repair Unigene1069_All DNA gyrase subunit B 5.5 Unigene1583_All DNA topoisomerase Ⅳ subunit B 4.9 Unigene747_All DNA topoisomerase Ⅰ subunit omega 3.5 Unigene15_All DNA topoisomerase Ⅳ 2.5 CL16.Contig5_All DEAD/DEAH box helicase 37.8 CL16.Contig4_All DEAD/DEAH box helicase 30.7 CL16.Contig2_All DEAD/DEAH box helicase 28.8 CL16.Contig1_All DEAD/DEAH box helicase 28.2 Unigene561_All DEAD/DEAH box helicase 6.7 CL16.Contig3_All DEAD/DEAH box helicase 8.4 Unigene382_All ATP-dependent DNA helicase PcrA 4.8 Unigene1417_All replicative DNA helicase 2.4 Unigene1094_All DNA replication protein 2.4 CL33.Contig2_All DNA primase 2.6 CL44.Contig1_All primosomal protein N' 2.0 Unigene1080_All DNA mismatch repair protein mutS 2.6 Unigene1679_All DNA methyltransferase 4.4 Unigene1611_All DNA recombination/repair protein RecA 5.8 Unigene545_All single-stranded-DNA-specific exonuclease RecJ 4.4 Unigene1520_All excinuclease ABC subunit A 3.7 Unigene543_All DNA polymerase Ⅲ subunit alpha 2.0 Translation Unigene825_All 30S ribosomal protein S15 2.0 Unigene1084_All 30S ribosomal protein S1 8.6 Unigene1296_All ribosomal RNA small subunit methyltransferase B 6.5 Unigene559_All ribosome biogenesis GTPase 2.8 Unigene648_All multifunctional CCA protein 5.3 Unigene644_All ribonuclease R 5.0 Unigene92_All ribonuclease E 5.3 Unigene792_All SsrA-binding protein 4.7 Unigene1622_All peptidyl-prolyl cis-trans isomerase 2.0 Unigene7_All aspartyl/glutamyl-tRNA amidotransferase subunit B 3.1 Unigene192_All valine--tRNA ligase 2.0 Unigene197_All methionine--tRNA ligase 7.6 Unigene369_All cysteine--tRNA ligase 3.2 Unigene290_All aspartate--tRNA ligase 2.8 Unigene201_All glutamate--tRNA ligase 3.8 Unigene189_All threonine--tRNA ligase 4.2 Unigene464_All glutamine--tRNA ligase 3.9 Unigene1081_All tyrosine--tRNA ligase 4.3 CL20.Contig1_All phenylalanine--tRNA ligase subunit beta 4.5 Unigene751_All hypothetical protein/translation initiation factor IF-1 7.8 CL53.Contig1_All translation initiation factor IF-2 2.5 Unigene1064_All elongation factor P 3.6 Unigene981_All elongation factor P--(R)-beta-lysine ligase 2.8 Unigene1285_All peptide deformylase 4.2 Temperature response Unigene560_All molecular chaperone HscA/hsp70 17.8 Unigene1443_All molecular chaperone DnaJ/hsp70 10.3 Unigene837_All molecular chaperone DnaK/hsp70 7.9 Unigene1424_All molecular chaperone HtpG/hsp90 4.9 Unigene1000_All ATP-dependent chaperone ClpB 3.7 CL12.Contig1_All cold-shock protein 10.3 Unigene1615_All DNA-binding protein /Cold shock protein domain 2.5 Unigene1345_All ATP-dependent Clp protease ATP-binding subunit 9.6 Oxidative stress response CL47.Contig2_All
Unigene902_All Unigene1524_Allalkyl hydroperoxide reductase subunit F Catalase Superoxide dismutase 4.8 4.3 2.9 Unigene446_All thiol reductase thioredoxin 3.0 Unigene1177_All NAD(P)(+) transhydrogenase 5.9 Unigene734_All thiol:disulfide interchange protein 4.1 Unigene740_All flavoprotein 4.8 Cell division Unigene328_All Cell division protein ZipA 5.2 Unigene1241_All cell division protein FtsX 2.2 Unigene940_All cell division protein FstK 2.1 Unigene1589_All UDP-N-acetylmuramate:L-alanyl-gamma-D-glutamyl-meso -diaminopimelate ligase 3.1 Table Supplementary Table S3. Up-regulated DEGs at Low Temperature
Carbohydrate metabolism provides energy and the carbon skeleton for cell growth; 39 genes related to carbohydrate metabolism appeared to be up-regulated. Seven genes involved in glycolysis and eight genes involved in citric acid cycle (TCA) were up-regulated, suggesting the enhancement of glycolysis and TCA at low temperatures. Additionally, several genes involved in pentose phosphate, propanoate, pyruvate, glycolate, carboxylic, and sugar metabolism were also up-regulated. Thus, we speculate that the increase of carbohydrate metabolism was one of the main mechanisms of HITLi 7T low temperature adaptation.
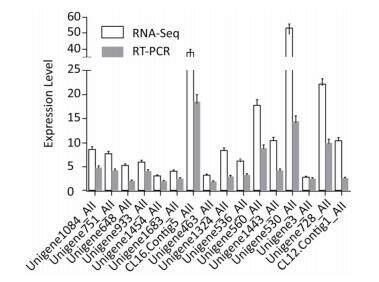
Of genes related to amino acid metabolism and transporters, 42 were up-regulated, indicating the activation of amino acid metabolism at low temperatures. Some genes involved in lysine, leucine, arginine, histidine, glutamite, glutamate, and tryptophan synthesis were up-regulated, indicating that HITLi 7T strived to accumulate and utilize these amino acids at low temperatures. Additionally, several genes related to lysine and leucine degradation and transport also appeared to be up-regulated, demonstrating the remolding of lysine and leucine metabolism, as well as uptake and utilization enhancement of lysine and leucine at low temperatures. Leucine is critical for production of branched-chain fatty acid[5]. The up-regulation of genes (Unigene1324_All and Unigene536_All) encoding leucine synthesis and branched-chain amino acid transport may promote branched-chain fatty acid synthesis at low temperatures; the expression of these genes was validated by RT-qPCR (Figure 2).
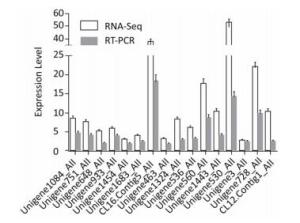
Figure 2. Validation of differently expressed genes by RT-qPCR.
Transcription regulation of HITLi 7T in low temperature conditions was controlled by many global regulators, including RNA polymerase sigma factors, transcription regulator activators, temperature sensors, and AraC, Fur, IclR, Crp, LysR, ArsR, TetR, ArgP family transcription regulators. Sigma factor, as a bacterial transcription initiation factor, is responsible for regulating transcription initiation. Two RNA polymerase sigma factors encoding genes, Unigene1683_All (σ70) and Unigene1454_All (σ32), were up-regulated in low temperature conditions, implying the activation of transcription initiation. Additionally, σ32 is likely to positively regulate the expression of heat shock genes in HITLi 7T at low temperatures due to the up-regulation of several heat shock genes (hscA, dnaJ, dnaK, htpG, clpB). Two transcription regulator activators, integration host factor subunit alpha (Unigene1333_All) and RNA polymerase-associated protein RapA (Unigene109_All), were 9.3-fold and 4.0-fold up-regulated in low temperature conditions, respectively, hinting the activation of transcription rate, frequency, and extent at low temperature. Additionally, a large number of transcription regulator encoding genes, such as AraC, Fur, IclR, Crp, LysR, ArsR, TetR, and ArgP family transcription regulators, were also up-regulated. These transcription regulators regulated multiple metabolic processes. Their up-regulation enhanced metabolic ability of the cell in low temperature conditions. The RT-qPCR results of the genes AraC (Unigene933_All), rpoH (Unigene1454_All), and RpoD (Unigene1683_All) were consistent with transcriptome analysis (Figure 2).
Of genes related to temperature and oxidative stress response, 15 were up-regulated. The Csps encoding gene (CL12.Contig1_All) exhibited an enhanced expression level of over 10-fold. Six hsps genes exhibited the enhanced expression (3.6-fold to 17.7-fold). Csps facilitate efficient translation at low temperatures by hampering the formation of the stable secondary mRNA structure acting as transcriptional activators or RNA chaperones. Hsps facilitates protein fold under stress by acting as molecular chaperones. Generally, hsps genes are up-regulated in increased temperatures[6-7]. However, the opposite result was observed in our study. This is likely due to differences in molecular responses of different bacteria at low temperatures. The up-regulation of Csp (CL12.Contig1_All) and hsp (Unigene560_All and Unigene1443_All) were verified by RT-qPCR (Figure 2). Previous proteome analysis of HITLi 7T also revealed the overexpression of two chaperone proteins in low temperature conditions [8]. These findings revealed that Csps and hsps played an important role in low temperature adaptation in HITLi 7T by improving DNA binding and protein folding. The oxidative stress response genes, including catalase (Unigene902_All), superoxide dismutase (Unigene1524_All), flavoprotein (Unigene740_All), and alkyl hydroperoxide reductase subunit F (CL47.Contig2_All), were observed to be up-regulated, suggested that low temperature adaptation of HITLi 7T also involved the oxidative stress response.
Low temperatures inhibit translation due to decreased ribosomal structural integrity and tRNA synthesis. Of genes associated with translation, 24 were up-regulated at low temperatures, including ribosome-associated genes, translation initiation factor IF2, IF1, translation elongation factor p, and tRNA synthesis- and transport related-genes. The up-regulation of these genes activated the translation of HITLi 7T in low temperature conditions. Thus, we speculated that the translation activity of HITLi 7T at a low temperature was enhanced by increasing ribosomal activity, mRNA longevity, translation initiation, and elongation as well as tRNA synthesis and transport. The RT-qPCR results of three genes (Unigene1084_All, Unigene751_All, and Unigene648_All) were consistent with transcriptome analysis (Figure 2) further revealed that translation level modulation may be an important process involved in cellular response to low temperatures.
To maintain nucleic acid structure and improve DNA replication and transcription at low temperatures, some genes related to DNA replication and recombination and RNA and DNA repair appeared to be up-regulated. Six DEAD-box RNA helicase encoding genes were significantly up-regulated (5.2-fold 37.8-fold), suggested that DEAD/DEAH box helicase played an important role in HITLi 7T low temperature adaptation. DEAD-box proteins participate in transcription and translation as RNA helicase and chaperone and play a key role in cold tolerance in a multitude of organisms[9-10]. One gene (CL16.Contig5_All) was validated by RT-qPCR (Figure 2). Several DNA gyrase and topoisomerase, exo- and endonucleases, DNA polymerase, DNA binding protein, DNA methyltransferase, DNA mismatch repair protein, and DNA recombination/repair protein genes involved in DNA replication and repair were induced in low temperature conditions. These findings indicated that the genes responsible for maintaining the activity and integrity of DNA and RNA are activated at low temperatures.
Of genes associated with protein, lipid, amino acid, organic, and ion transport and those associated with cell division proteins, 44 and 4, respectively, were up-regulated in low temperature conditions, indicating the improvement of substance transport and cell division at low temperatures. In addition, 66 hypothetical protein genes with uncharacterized function appeared to be up-regulated in low temperature conditions. Thus, more experiments are required to illuminate the function of these genes.
In conclusion, this study provides new insights into the low temperature adaptation of HITLi 7T. The low-temperature adaptation of HITLi 7T was elaborate and involved nearly every cellular process, mainly relying on basal metabolism regulation.
HTML
the National Natural Science Foundation of China 51578178
the National Natural Science Foundation of China 51608149
Heilongjiang province Research Council BHL-Q18106

 Quick Links
 DownLoad: