


-
Research on nutrigenomics has accumulated sufficient data in the past two decades that have demonstrated phenotypes of single nucleotide polymorphisms (SNPs) between healthy and micronutrient-deficient populations. For instance, Zhang et al. showed that the genes MTHFR C677T, MTRR A66G, and MTR A2756G were the genetic factors responsible for low absorption and bioavailability of vitamins such as folate, B6, and B12. It has also been reported that these nutrients are closely associated with the prevalence of neural tube defects in newborn infants[1, 2]. Furthermore, nutritional genotype studies have facilitated the use of MD-SNPs (single nucleotide polymorphisms associated with micronutrient deficiency) as risk biomarkers, i.e., vitamins A, D, E, and B12, and folate and calcium, iron, zinc, and selenium[3-6]. It has been agreed that diagnosing or evaluation of micronutrient deficiency is a barrier to bottleneck technology because of the presence of numerous indexes for various micronutrients, and it is also difficult to understand the genetic information related to micronutrient deficiency.
Multi-SNPs can be analyzed by techniques such as mass spectrometry, electrophoresis, and microarray hybridization[7]. However, the efficiency of these technologies is restricted by the cross-impact in the PCR of primers and DNA samples done in a single reaction tube. A microfluidic chip is composed of microdroplets, microchannels, and microchambers[8]. Each microchamber can be used to amplify only one primer pair. Li et al. reported a design of 116-plex PCR using a hydrophobic patterned microfluidic chip; however, interchamber contamination was detected because of the linkage among chambers[9]. In this study, MD-SNPs were extracted from published studies of GWAS, reviews, and meta-analyses, which are epidemically related to micronutrient deficiency, and a method was established using a modified microfluidic chip for analyzing MD-SNPs. The study is intended to explore the possibility of describing the potential risk of MD from the genetic viewpoint for an individual.
MD-SNPs were retrieved from published studies of GWAS, reviews, and meta-analyses from among genetic and epidemic studies using large populations. A total of 52 DM-SNPs were included based on the criteria of research quality and used for measuring the deficiency biomarkers of vitamins A, D, E, B12, and folate and calcium, iron, zinc, and selenium.
In this study, blood samples were obtained from the 'Nutrition observation in rural boarding school students' study conducted by the Institute for Nutrition and Health, Chinese Center for Disease Control and Prevention. The study protocol was evaluated and approved by the Institutional Ethics Committee for Human Study (No. 2016-019). Blood samples were collected by local CDCs from voluntary student subjects. Students, their parents, and school leaders and teachers were fully informed about the study, and informed consents were signed by the parents. Venous blood samples collected in serum separator tubes were promptly centrifuged at 3, 000 × g for 15 min, retained blood cells, and frozen at -80 ℃. The samples were transported to the institute laboratory by a licensed company for blood transportation and stored at -80 ℃ until use for analysis.
The following chemicals and reagents were used in this study: 2× PCR Master mix from LGC Corporation (Shanghai, China), DL 1500 DNA marker from TaKaRa (Dalian, China), 50× TAE from Sangon Biotech (Shanghai, China), ethidium bromide from TianGen Biotech (Beijing, China), and PCR-compatible adhesive tape from BioRad (Shanghai, China). Chip PCR was performed on a MasterCycler Nexus flat (Eppendorf, Germany). DNA templates were extracted by automated nucleic acid purification workstation (Bioteke Corporation) in combination with magnetic bead-based reagent technology (Bioteke Corporation) according to the manufacturer's instructions. The concentrations of the purified DNA samples were detected by Nanodrop 1000 spectrophotometer (CapitalBio Corporation, Beijing, China), and then the DNA samples were diluted with ultrapure water to the desired concentrations. The heat sealing instrument and the blocking instrument were purchased from CapitalBio Corporation (Beijing, China). Chip scanning images were obtained and processed using a LuxScan-10 K/A scanner (CapitalBio Corporation, Beijing, China). PCR primers were designed by Primer Premier 6 and synthesized by Sangon Biotech (Shanghai, China), with the primers carrying standard FAM-or HEX-compatible tails and the target SNP in the 3′ end (Supplementary Figure S1, Supplementary Table S1, available in www.besjournal.com). Next-generation sequencing experiment was conducted by Sangon Biotech (Shanghai, China).
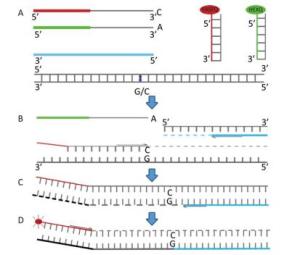
Figure Supplementary Figure S1. Steps and principle of allele-specific extension on primer arrays. (A) Primer pairs mix containing two different, allele specific, competing forward primers with unique tail sequences and one reverse primer; Master mix containing FRET cassette plus enzymes with high fidelity activity in an optimized buffer solution; test DNA with the SNP of interest; (B) In the first round of PCR, one of the allele-specific primers matches the target SNP and, with the common reverse primer, amplifies the target region; (C) In the second round of PCR, reverse primer binds, elongates and makes a complement copy of allele-1 tail; (D) In the third round of PCR, FAM-labelled oligo binds to new complementary tail sequence and is no longer quenched, in further rounds of PCR, levels of allele- specific tail increase. The fluorescent substance-labelled part of the FRET cassette is complementary to new tail sequences and binds, releasing the fluorescent substance from the quencher to generate a fluorescent signal.
Chip ID Nutrients Rs Primer Allele FAM Primer Allele HEX Primer Common Allele FAM Allele HEX 1 VD rs10741657 AATAAGACTTTCCTTGACAGCCCTT AATAAGACTTTCCTTGACAGCCCTC CCTGGTGGTTGGGGAGATACTTTA A G 2 calcium rs780094 GCCTCAACAAATGTATTGATCAGCAAAT CCTCAACAAATGTATTGATCAGCAAAC CCAGTTTTTTAGACCATGACTGACACAT A G 3 VD rs12785878 GTCTGATATCACAAAGCTTCG GGCTGTCTGATATCACAAAGCTTCT CCACGGGGCCAGGAGAGGAT G T 4 VB12 rs526934 CCAAAAATCATGCATTGAATTTCAGGG CCCAAAAATCATGCATTGAATTTCAGGA GGAAAGTTATCTTTTGGTCTTGATATGCAA G A 5 Iron rs1421312 GATTATTATTACATCCATTTGACAGAACTC ATTATTACATCCATTTGACAGAACTT CTGGGCCAGTGGCTTAGCCATT C T 6 Iron rs6794945 CAATTACTTTTTTCAAGTGGCTCTC CCTCAATTACTTTTTTCAAGTGGCTCTT CACAATTGCATAATACCAGGAACTGCAAA C T 7 Iron rs4820268 GATTGTCTCAACGGCAGCGAT GATTGTCTCAACGGCAGCGAC CCTACCTTCCTGGCACTGCTCTT A G 8 Iron rs7638018 AGGTAGTTCTTAAAAGTTCATGTTTGACT GGTAGTTCTTAAAAGTTCATGTTTGACC GTGGCTTGCCCAAGAAAGGATTCAA A G 9 Iron rs2118981 AAATCACCCTTCCAGCCCTTAATGA CACCCTTCCAGCCCTTAATGG GGTAGGAGTGTGTTAACACGTGGAA T C 10 Folate rs1042613 GGAAATTTCTCAAGGAGCATTCAGC CGGAAATTTCTCAAGGAGCATTCAGT CCTGGGCTGCAGCGTTTGGATT G A 11 Folate rs202676 AAGCTGAGAACATCAAGAAGTTCTTAC GAAAGCTGAGAACATCAAGAAGTTCTTAT TGTCCATATAAACTTTCGAGGATGTACTTA C T 12 Zinc rs2120019 CGCTGTGCCGCTGTGTCAC GCGCTGTGCCGCTGTGTCAT CCTCGCTTGCTTCCTGCATATTGTA C T 13 VD rs1790349 ATCCTTGGACTGGACTGACAG CTATCCTTGGACTGGACTGACAA GGAAGTGCACCAAACAGCAAGACAA C T 14 VD rs2298849 AACAGCCTCACCTAATTCGTACAC AACAGCCTCACCTAATTCGTACAT CCACTGGCAAAACACATTACTATTATGAAT C T 15 calcium rs17005914 GAGGCTTGTATCCTGTTTGCTAAG GGAGGCTTGTATCCTGTTTGCTAAA CTTCTGTGGCTCTTTGCTTTAGTTTACAT C T 16 VD rs2060793 GGGCTAATCAGCTGATCTTTGAGTT GGCTAATCAGCTGATCTTTGAGTC GTGATTATATTGGGCCCACCTGGAT A G 17 VD rs11234027 GCTGTGTTCTTAGGTGAG ACATGCTGCTGTGTTCTTAGGTGAA CGATTGGGCATTGTTTCACCAGTGTA G A 18 VD rs3829251 CACTGCCTCTTCCACGGG CCTCACTGCCTCTTCCACGGA CCTTCCACTGTCCTCACATAGAGAA G A 19 VE rs11057830 GGCTGCCGGGGACCGGA GCTGCCGGGGACCGGG CACGTTAGTCCCCTCCCTCCAT A G 20 Iron rs3811647 CCCTTCCTAGATGTATAATCCTAGAC CCCTTCCTAGATGTATAATCCTAGAT CTAAGCTGAGGGAGTTTACAGACAGAT G A 21 Iron rs2111833 GTACTTCCCCAGCTACTACTCG CGTACTTCCCCAGCTACTACTCA AGGTGCCAGGAGCAGTGGGTTT C T 22 Folate rs1801133 AAAGCTGCGTGATGATGAAATCGG GAAAAGCTGCGTGATGATGAAATCGA CTGACCTGAAGCACTTGAAGGAGAA C T 23 Iron rs3811658 CCCTGAAAAGACTCAATCTCTGG GTCCCTGAAAAGACTCAATCTCTGA AAGAACCAGGTGACCACAAGCACTT C T 24 Folate rs1801131 GGAGGAGCTGACCAGTGAAGA GGAGGAGCTGACCAGTGAAGC GGTAAAGAACGAAGACTTCAAAGACACTT T G 25 VB12 rs602662 GAGAACATTGACACCTCCCACG GGAGAACATTGACACCTCCCACA GCCATCGCCAGCAAACACCACAT G A 26 Iron rs855791 AGGACCTGTGCAGCGAGGC CAGGACCTGTGCAGCGAGGT GTGGCGTCACCTGGTAGCGATA C T 27 Folate rs2236225 CCAACAAGCTTGAGTGCGATCC GCCAACAAGCTTGAGTGCGATCT CGCACATGGCAATTCCTCCATCATT C T 28 Folate rs1051266 GAAGCAAAGGTAGCACACGAGGT AAGCAAAGGTAGCACACGAGGC GACCCCGAGCTCCGGTCCT A G 29 Folate rs12659 AGCTTCCCGCCTGGGCCA GCTTCCCGCCTGGGCCG CTTCGGAGCTGGAGCGCATGAA A G 30 Iron rs1880669 CTCTGCAGGAGAAAAGAAAATGAAA CTCTGCAGGAGAAAAGAAAATGAAG CCCAATCTATAAATCAGGGTTTAATGCCTT T C 31 Iron rs2543519 TCCAATGAGGGGGTCACTG GCTTCCAATGAGGGGGTCACTA CCTCCCTCTCTTCCCTCCTCAA C T 32 VD rs1993116 TCATATTCTTGTCTTCTGCCTGCG CATATTCTTGTCTTCTGCCTGCA GAAATCACTGCTCCTAAGGAGTTTGTAAT C T 33 Iron rs10904850 GAACTGGATTCAGCCCTTCACG GGAACTGGATTCAGCCCTTCACA AATTTGGGAGGATAAAATGGGACAGTGTA G A 34 Iron rs2235321 CATGCGTGGCGTCACCTGG GCATGCGTGGCGTCACCTGA CTGTGCAGCGAGGTCTATCGCTA G A 35 Iron rs4434553 GACCTGAGTAGGAGCTGATGTTT GACCTGAGTAGGAGCTGATGTTC CCACCAAGTTTCCCTTTCGGGTTT A G 36 Folate rs1801394 CATGTACCACAGCTTGCTCACAT CATGTACCACAGCTTGCTCACAC AGGCAAAGGCCATCGCAGAAGAAAT A G 37 Folate rs2274976 CCTCATACAGCTTTCCCCACT CCTCATACAGCTTTCCCCACC CGAGGCCTTTGCCCTGTGGATT A G 38 calcium rs7481584 CGTTGTGCGTGGGCTGGGAAT GTTGTGCGTGGGCTGGGAAC GTGTCTCTGCTCTGCCCGAGTT A G 39 VE rs7834588 GGAGACAGTCAGCAAAGAGCC CTGGAGACAGTCAGCAAAGAGCT GGTCCTTGTCTCTAGGGAAATCACAT C T 40 VB12 rs1051552 AAGAAGTGAGCCTTGTACTTTCCAC AAGAAGTGAGCCTTGTACTTTCCAG CGTGGGGTTTTTGCTGTGCGGA C G 41 Folate rs1801181 CCTGCAGCTCCTGCGCG CTCCTGCAGCTCCTGCGCA CGGTGGCGGTGGCCGTGAA C T 42 Iron rs173107 GAGCATGTTATAAATACACAATCTTTATAGATA AGCATGTTATAAATACACAATCTTTATAGATC GCAAGATGAACTTGTGAACACATGTCTAA A C 43 Iron rs1799852 GACCAGTATGAGCTGCTTTGCC GGACCAGTATGAGCTGCTTTGCT CATCTACCGGCTTCCGGGTGTT C T 44 Iron rs8177248 CAGAAACCAAAGACCAACATTGCC GCAGAAACCAAAGACCAACATTGCT ACTTGGACGTGGTCTCACAGAACAT C T 45 Folate rs1001761 GAGCAGGCATCCAGGTAAATCC AGAGCAGGCATCCAGGTAAATCT GGGGGGATCAACTGAGATGGCTT G A 46 Folate rs162036 CATCAGGGCTGTTACCTTTCTTCT ATCAGGGCTGTTACCTTTCTTCC CGTCCTTTTGAAAATAAAGGCAGACACAA A G 47 Folate rs2851391 AATGCCCGTTTTACAGACAGACACA GCCCGTTTTACAGACAGACACG TCCGGCAAGCCACGTGACCAA T C 48 Folate rs2847149 GAGTGGAGTGTGACCCTGGC GGAGTGGAGTGTGACCCTGGT CTGTAGGTGGCGCTGCTGTGAA G A 49 Selenium rs7700970 ACGTTAAAGAGTATTTGAAGAACACCG CACGTTAAAGAGTATTTGAAGAACACCA TTTAATCCCTCAGCAGACAGTTCTTCAAA C T 50 Selenium rs921943 GAGACCCTGCATTTTCTAGAATCAAC AGAGACCCTGCATTTTCTAGAATCAAT GTGTAGAGCTTCTAACTAGTAGAAACAGAA C T 51 Iron rs16827043 GAGATGATTTCTGGAATCAGTTACCA GAGATGATTTCTGGAATCAGTTACCG GCCACAGCGGCTACTGTCCTTT A G 52 VA rs10882272 CCGATTCTCTTAAAAGGGTCCATG GCCGATTCTCTTAAAAGGGTCCATA GAGCAATTGAAGAATTTCTAAGGAACAGTT C T Table Supplementary Table S1. The Primers Design for 52 SNPs
The primer mix contained the following three primers: a common reverse primer, a tailed allele primer 1, and a tailed allele primer 2 in a ratio of 5:2:2. The primer mix (0.14 μL, 2 μmol/L for each forward and reverse primers) was preloaded in a reaction chamber. The master mix containing FRET cassette plus enzymes with high-fidelity activity in an optimized buffer solution was stored at -20 ℃ in the refrigerator, kept cool using ice when taken out from the refrigerator, and vortexed before use.
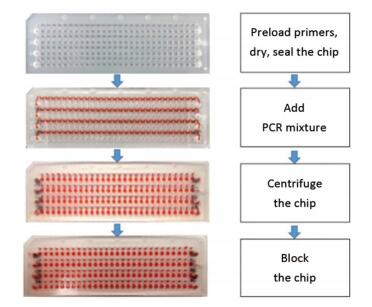
The chip was made up of the material polymethylmethacrylate (PMMA) and fabricated by machining to the final dimensions of 7.5 cm (length) × 2.5 cm (width) × 2 mm (thickness). There were 28 microchambers in a column and four parallel columns in a chip that enabled the simultaneous testing of 112 SNPs in the three genotypes of wild-, hybrid, and mutant types. Each column consisted of a circular inlet and outlet, a 'sine-shaped' sample-infusing channel, 28 linking channels, and 28 circular reaction chambers. A modified method has been previously established to prepare the microfluidic chip[10]. Before use, the chip was washed with ethanol and ultrapure water and dried using nitrogen gas. Then, the primer pairs were pipetted into different reaction chambers and allowed to dry at room temperature for 30 min. A piece of single-sided, PCR-compatible adhesive tape was used to seal the top side of the chip at 175 ℃ for 1 min. After sealing, the primer-loaded chip was stored at 4 ℃ before use. An aqueous PCR mixture containing the PCR master mix and the DNA template was loaded into the infusing channels by pipetting from the inlets. The outlets and the inlets on the bottom side were sealed with the adhesive tape to achieve a fully hermetic system. Then, the chip was centrifuged at 4, 000 rpm for 1 min so that the PCR mixture was uniformly transferred into the reaction chambers and thoroughly mixed with the preloaded primer mix, and the final reaction volume was made up to 0.8 μL. Each linking channel was blocked at 150 ℃ for 1 min. Then, the chip was placed on a MasterCycler Nexus flat and pressed with a PMMA block to ensure tight contact and avoid distortion of the chip under high temperature (Figure 1).
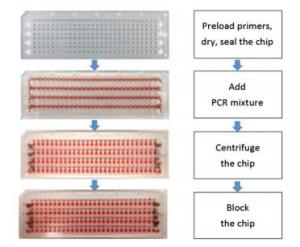
Figure 1. Workflow protocol of the chip.
The temperature program of PCR in the chip was set as follows: hot-start activation at 94 ℃ for 15 min, followed by ten touchdown cycles (94 ℃ for 20 s; touchdown at 61-55 ℃, dropping at 0.6 ℃ per cycle) and then 26 cycles of amplification (94 ℃ for 20 s; 55 ℃ for 60 s). After thermal cycling for 100 min, the amplified products were detected by LuxScan-10 K/A scanner at ≤ 40 ℃ for 15 min. The fluorescence intensity values (FIVs) were used to identify the three distinct genotypes of the wild-, hybrid, and mutant types.
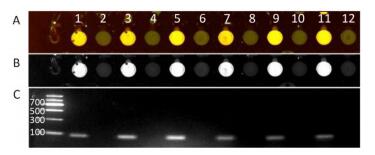
Cross-contamination test was conducted as follows: odd-numbered chambers in a column of a chip were preloaded with the primer mix, whereas even-numbered chambers were not. In addition, gel electrophoresis was conducted using solutions from the corresponding reaction chambers. Specificity of primer mix and accuracy: each chamber preloaded with the primer pairs was loaded with different DNA templates at a concentration of 10 ng/μL with the master mix by pipetting into the infusing channels. The results were compared with the expected results obtained by next-generation sequencing (NGS). The selection of the appropriate DNA reaction concentration was done as follows: 52 different DNA templates were diluted to 1, 5, 10, and 15 ng/μL to test the appropriate DNA reaction concentration, respectively. The repeatability of the multiplexed SNPs was observed using four repeats of 52 MD-SNPs in one DNA template. All these experiments were repeated six times. The established method was used to measure the DNA templates from six different samples to evaluate the possible MD risk of vitamins A, D, E, B12, and folate and calcium, iron, zinc, and selenium.
The SPSS software 18.0 was used for statistical analysis of the results. The independent t-test was used for comparison of FIVs of the reaction and control chambers for the cross-contamination test. Mean and RSD values were calculated for the repeatability and suitable concentrations of DNA test. The evaluation results of six samples of MD-SNPs were expressed as the number of wild-, hybrid, and mutant types of measured SNPs. Significant differences in the tests were determined based on a threshold P value of 0.05.
The FIVs of the odd-numbered tested chambers were found to be significantly higher than those of the even-numbered chambers (Supplementary Figure S2, available in www.besjournal.com). This suggested that the cross-contamination of primers that occurred among the chambers was efficiently prevented by blocking the chamber linkage as a modification of the previously reported method (Supplementary Table S2, Supplementary Figure S2, available in www.besjournal.com). The three genotypes of mutant, hybrid, and wild types could be identified specifically and accurately by the measurement. The sample chambers revealed an average of at least two times higher FIVs than those of NTCs (control chambers). The modified method was adopted in this study with a blocking step, which demonstrated less contamination compared to that without the blocking method. The microfluidic chip, like high-throughput technology, was able to simultaneously amplify a large number of target DNA fragments in a chip, and the physical isolation of different primer pairs is a simple and effective strategy to avoid the drawbacks of conventional multiplex PCR. We applied this advantage to reduce the mutual interference and the competition among different primers in one tube for multiple PCR.

Figure Supplementary Figure S2. The cross contamination testing of adjacent reaction chambers. Odd number and even number represented reaction chambers with and without pre-loaded primers, respectively. 'A' is the fluorescencepseudo color image; 'B' is the corresponding grayscale image; 'C' is the electrophoretagram of the amplicons in each reaction chamber which corresponded to the product in the chamber of 'A' or 'B' above. Lane marked M represents the DNA marker. The molecular weights of the bands from the top to bottom were 1, 200, 900, 700, 500, 300, and 100 bps.
Evaluation of Microfluidic Chip Fluorescent Substances FIV (x ± SD) in Reaction Chambers FIV (x ± SD) in NTCs P Cross contamination test FAM 27837.54 ± 3249.60 4500.41 ± 548.63 < 0.00001 HEX 19852.31 ± 1902.48 5210.61 ± 746.32 < 0.00001 Repeatability FAM 29895.12 ± 14649.51 3965.03 ± 337.25 < 0.00001 HEX 34716.24 ± 11665.07 3538.09 ± 230.71 < 0.00001 Table Supplementary Table S2. Evaluation of MD-SNPs Chip
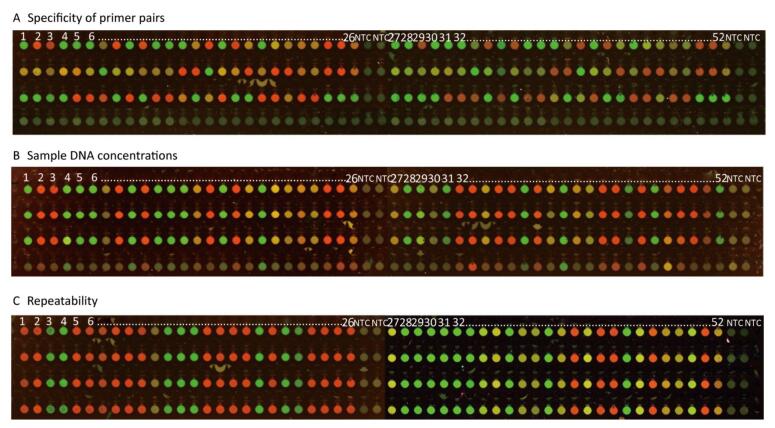
We observed that 52 SNPs of the wild, hybrid, and mutant types that resulted from the MD-SNPs chip (Figure 2A) were completely similar to those resulting from NGS, suggesting the high accuracy of the method. As a qualitative method, the primer pairs of MD-SNPs designed in this study could be successfully amplified under the given conditions, replicated target DNA fragments with additional florescence carriers of FAM and HEX.
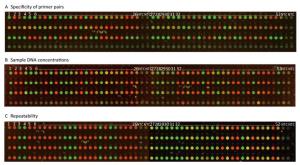
Figure 2. Fluorescence pseudo color image.
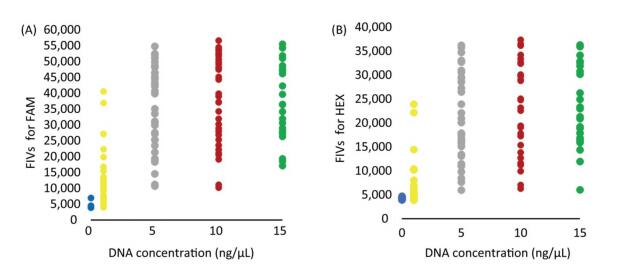
The FIVs obtained with the DNA concentrations of 5, 10, and 15 ng/μL were all above 20, 000 and 10, 000 in FAM and HEX, respectively, which were significantly higher than those of NTCs and 1 ng/μL. Results showed that the FIVs of NTCs were below 6, 000 and 5, 000 but partly overlapping with the FIVs obtained with the DNA concentration of 1 ng/μL (Supplementary Table S3 available in www.besjournal.com). Therefore, the DNA concentration of 5 ng/μL was considered as appropriate for selecting the 52 MD-SNPs, although the optimal concentration for each primer pair may differ. The DNA concentrations of 10 and 15 ng/μL were also acceptable for the measurement but require more DNA (Figures 2B and 3).
DNA Concentration (ng/μL) Fluorescent Substances FIV (x ± s) P 15 FAM 38754.14 ± 11702.86 < 0.00001 HEX 24424.71 ± 8139.68 < 0.00001 10 FAM 38192.20 ± 13535.86 < 0.00001 HEX 23382.29 ± 9423.48 < 0.00001 5 FAM 35586.34 ± 13089.01 < 0.00001 HEX 21570.18 ± 9225.07 < 0.00001 1 FAM 11788.97 ± 8543.16 < 0.00001 HEX 6704.82 ± 4704.99 0.0150 0 FAM 5453.31 ± 681.43 HEX 4528.88 ± 660.45 Table Supplementary Table 3. Evaluation of MD-SNPs Chip in DNA Reaction Concentration
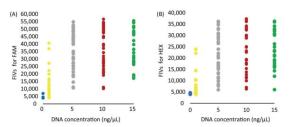
Figure 3. Statistical FIVs for FAM (A) and HEX (B).
The RSD of repeatability was between 0.67% and 26.06%, and there were no significant differences between inner chip repeats and among chip repeats (Figure 2C, Supplementary Table S2).
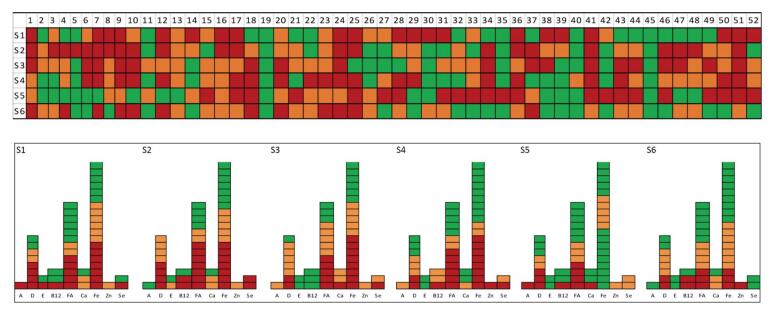
The MD risk of six students is shown in a colored image in a pattern of SNP genotypes using three colors. The wild-type is depicted in red, the hybrid type in orange, and the mutant type in green (Supplementary Figure S3, available in www.besjournal.com). The risk of individuals for a micronutrient could be identified by the differences in the red-colored areas. The genotype for each SNP of a micronutrient in a subject could be presented using the image. The six samples were also measured by NSG, which showed completely similar results. The MD-SNPs chip method was used to measure the MD risk of six students, which revealed significant differences in the genetic potential. It was also found that the amplification FIVs of the different primers pairs were varied in a large range in the study. Factors, including optimization with ratios of the primer pairs, require further research. We consider that this study has demonstrated the potential of the MD-SNPs microfluidic chip method to be used as a tool for collecting genetic individual nutrition information for healthcare. Combination of this method with current laboratory measurements might comprehensively explain the individual MD risk in terms of both genetic and diet environmental conditions, thus facilitating precise nutrition intervention. Additional studies are required to evaluate the accordance of MD by both traditional indexes and MD-SNPs. Transcription of MD-SNPs is obviously an important aspect for further study.
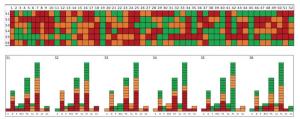
Figure Supplementary Figure S3. The color grade of 9 MD-SNPs in 6 measured individual samples, s: sample.
ZHANG Chun Hong participated in the experiment, analyzed the data, and wrote the manuscript; HUO Jun Sheng designed the research and had primary responsibility for the final content; CHEN Shan designed and participated in the experiment; XU You Chun participated in review and editing of the manuscript; SUN Jing, Project Administration; HUANG Jian, validation; LI Dan (The Second Military Medical University), validation. All authors read and approved the final manuscript.
The authors declare no conflict of interest.
HTML
Rural compulsory education student nutrition improvement plan-student nutrition and health condition in-depth monitoring and evaluation project 2016-019

 Quick Links
 DownLoad: