


HTML
-
Dietary assessment is a fundamental task in epidemiological studies, whose objective is to investigate the associations between dietary habits and health outcomes. The 24-h dietary recalls (24 h DRs), weighed food records, and narrative diet histories are considered as short-term dietary assessment tools and are relatively accurate dietary collection methods[1]. In contrast, the food frequency questionnaire (FFQ) covers a longer period of dietary history varying from months to years, which can be used to evaluate dietary habits[2]. Although it appears to be slightly difficult to collect dietary information accurately using FFQ by recalling, results of long-term diet history could be more meaningful than those of short-term diet intake, particularly when the aim is to assess the relationships between food and its associated long-term diseases accompanied by modifiable risk factors such as obesity and diet-related noncommunicable diseases (NCD)[3-5].
A significant proportion of NCD can be attributed to suboptimal nutrition, such as undernutrition or overnutrition. Suboptimal nutrition has been believed to be the underlying cause of the majority of NCD in children and ultimately responsible for a substantial proportion of child mortality[6]. When considering that nutrition is an important modifiable risk factor and children are at a unique point for early intervention, reliable assessment of diet in children becomes a major research priority. Dietary assessment in children is of great interest because an increasing number of epidemiological studies have focused on childhood diet and its relationship with the onset of diet-related diseases, which is important in informing disease prevention efforts and understanding the complex relationship.
FFQ is a cost-effective method for dietary assessment in large population groups. All FFQs should be tailored to the population of the target market because of the vast difference in food items that contribute to the daily supply of nutrients, as well as the wide range of dietary habits among populations. Food intake also largely varies depending on the ethnic, social, and cultural background of the study population[7, 8]. Several FFQs have been validated for use in children and adolescents, such as those in Malaysia, New Zealand, Peru, and the USA[4, 9-11]. In China, a valid FFQ has been developed for use in the general adult population[12]. However, till date, there is no validated FFQ for use in Chinese adolescents. Previous studies conducted in China on adolescents have been using adults' FFQ instead. The absence of adolescents' FFQ has been a hindrance in China nutrition survey projects.
This study was designed to develop a semi-quantitative FFQ and to validate the FFQ for Chinese children aged 12-17 years. The reliability and the relative validity of the FFQ were assessed. Results using 24 h DRs were also obtained, a method that has been found to be suitable for comparison to establish validity[13].
-
Adolescents aged 12-17 years were enrolled in this study using a multilevel cluster sampling method. Participants were recruited from four middle schools in Yanqing district of Beijing and Wanzhou district of Chongqing in China. The two cities were selected as being representative of the northern and southern areas according to nutrition experts' advice, and four classes were randomly selected from 52 classes. Among the 52 classes, the total number of adolescents was 2, 792, of whom 165 were selected. The selection criterion was healthy (i.e., with no medical conditions and allergies nor specific dietary restrictions affecting food intake) children residing in the local area for more than 6 months.
Based on the study of Willett[14], the number of subjects required to assess reproducibility and validity was at least 110. From 165 potential participants, 161 participants volunteered to complete the two FFQs and three consecutive days' 24 h DRs. This sample size was considered as appropriate for studies validating dietary intake tools. Data collection was conducted from May 2018 to July 2018. All the procedures involving human participants/patients were approved by the ethics committee of the National Institute for Nutrition and Health, Chinese Center for Disease Control and Prevention. All participants/parents provided their written informed consent.
-
Participants were enrolled in this study for a period of 1 month (Figure 1). We collected two FFQs over the course of this study period. The first FFQ (FFQ1) was collected in May, and the second FFQ (FFQ2) was collected in June. Three consecutive days' 24 h DRs were collected after FFQ1 with 1-week interval, and the days were consecutive, which reduced random errors due to date selection, and the method was consistent with previous methods used in China[15-17]. The three consecutive days' 24 h DRs were designed on Sunday, Monday, and Tuesday, which covered two weekdays and one weekend day to account for intraindividual variation between day types. The questionnaires of each individual participant were administered by an interviewer face-to-face. Socio-demographic information and anthropometric measurements were also collected.
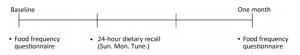
Figure 1. Flow chart of the validation study for the food frequency questionnaire (FFQ).
-
A semi-quantitative FFQ was developed according to the methods proposed by Willett[14]. A data-driven approach was adopted to determine the food list of FFQ, as described by Block et al.[18], using data from a nationally representative 3-day 24 h DRs survey (n = 28, 139) conducted during 2010-2012 in children and adolescents. The FFQ consisted of 72 items of food commonly consumed in the previous month, including the following three sections: the food list, the frequency response, and the average intake. The frequency response included the following four categories: (1) how many times per day, (2) how many times per week, (3) how many times per month, and (4) almost never eat or drink. There was no unified portion size in China, and therefore, food types and portion size of local food were surveyed in markets, and visual aids, which consisted of photographs of utensils and food portions, were used to assist with description of amounts consumed.
-
Intakes obtained by the 3-day 24 h DRs were used as reference data for analyzing relative validity. Data collection included the following four steps: a quick list, detailed pass, forgotten food, and final review[19]. A quick food list was provided to participants, and they were also given verbal and written instructions on how to complete the list. To facilitate accurate recording, the instructions included standardized examples of the methods of recording and the food record was structured into daily meal times. In the detailed pass, the research interviewers evaluated the completed food list chronologically on the next day and explored for food description details, preparation methods, and amounts consumed. Visual aids displaying the photographs of utensils and food portion size were used to assist with determination of amounts consumed, after which the research interviewers attempted to elicit any forgotten items such as snacks and beverages consumed, if applicable. Finally, the interviewer gave a final check and review to complete the first 24 h DR. And the same procedure was followed for the second and third 24 h DR.
-
The daily nutrient consumption of participants was calculated using the China food composition database. Nutritional values for each food were calculated by matching the food code from the China food composition database. If one food was not listed in the database, food containing similar ingredients was used instead to calculate the nutritional values. For a food group, according to the similarity of ingredients, nutrient profile, and/or culinary usage among the food and the grouping scheme used in other studies, the FFQ's 72 food items and the 24 h DRs' food list were reduced to 17 predefined food groups, respectively.
-
During the final interview, anthropometric measurements of the children were obtained. Height was measured without shoes to the nearest 0.1 cm, and body weight was measured in the morning on an empty stomach in light clothes to the nearest 0.1 kg. These measurements were conducted according to the standard of measuring steps by unified trained investigators. Height and weight measurements were used to calculate body mass index (BMI). BMI z-scores were used to determine whether participants were obese or not using the Chinese children and adolescents standards[20].
-
All data were double-entered into Epidata. Spearman's correlations, Bland-Altman plots, and quartile agreement were used to assess validity. Reliability statistics included intraclass correlation coefficients (ICCs) and quartile agreement. ICCs are preferred for test-etest reliability as they can measure agreement between the same metric compared with Spearman's correlation coefficient, which evaluates agreement in rank order of measures with the same or different metrics. The Bland-Altman plots are shown based on the estimated mean (standard deviation, SD) of difference between the two dietary assessment methods.
When the difference in measurement results obeys normal distribution, 95% of the difference should be between mean ± 1.96 SD. Data are described as n (%) for categorical variables, and mean and SD or median and interquartile range (IQR) were used for describing continuous variables. All statistical analyses were performed using SAS, version 9.4 (SAS Institute Inc., Cary, NC, USA), and a P value of < 0.05 was considered to be statistically significant; all P values were two-sided.
Study Participants
Study Design
Development of FFQ
Collection of Food Dietary Records
Dietary Assessment
Anthropometric Assessment
Statistical Analysis
-
Characteristics of the study population are presented in Table 1. A total of 160 parent-child pairs completed the study (99.4%). Mean age of the participants (50.6% males) was 14.6 years, mean height was 164.3 cm, mean weight was 59.0 kg, and mean BMI was 21.7 kg/m2. Furthermore, 5.6%, 61.3%, 15.6%, and 17.5% of children were underweight, normal weight, overweight, and obese, respectively. Half of the participants were from junior middle schools.
Socio-demographic Variable Total Male (n = 81) Female (n = 79) Age (years, mean ± SD) 14.6 ± 1.4 14.7 ± 1.5 14.5 ± 1.4 Height (cm, mean ± SD) 164.3 ± 8.7 169.3 ± 8.1 159.1 ± 5.8 Weight (kg, mean ± SD) 59.0 ± 15.1 64.5 ± 16.8 53.3 ± 10.4 Body mass index (BMI) (kg/m2, mean ± SD)b 21.7 ± 4.5 22.4 ± 5.2 21.0 ± 3.5 Underweight (n, %) 9 (5.6) 6 (7.4) 3 (3.8) Normal weight (n, %) 98 (61.3) 41 (50.6) 57 (72.2) Overweight (n, %) 25 (15.6) 14 (17.3) 11 (13.9) Obesity (n, %) 28 (17.5) 20 (24.7) 8 (10.1) Grade level of school (n, %) Junior middle school 80 (50.0) 40 (49.4) 40 (50.6) senior middle school 80 (50.0) 41 (50.6) 39 (49.4) Father's education level (n, %) Primary education 6 (3.8) 3 (3.7) 3 (3.8) Secondary education 102 (63.8) 52 (64.2) 50 (63.3) Higher education 52 (32.5) 26 (32.1) 26 (32.9) Mother's education level (n, %) Primary education 14 (8.8) 8 (9.9) 6 (7.6) Secondary education 91 (56.9) 48 (59.3) 43 (54.4) Higher education 55 (34.4) 25 (30.9) 30 (38.0) Father's employment status (n, %) Not employed 2 (1.3) 1 (1.2) 1 (1.3) Employed 158 (98.8) 80 (98.8) 78 (98.7) Mother's employment status (n, %) Not employed 38 (23.8) 20 (24.7) 18 (22.8) Employed 122 (76.3) 61 (75.3) 61 (77.2) Note.aNumbers in this table represent means ± standard deviations (SD) and n (%) for continuous and categorical variables, respectively. bBMI cut-off points adapted from Chinese standard for children and adolescents. Table 1. Socio-demographic Characteristics and Anthropometric Measurements of Participants (N = 160)a
-
Table 2 shows the descriptive statistics for the mean (SD) and median (IQR) intake of 17 types of food groups and 15 types of nutrients between FFQ1 and FFQ2. Compared with FFQ2, the food intake of cereal, fresh vegetables, fresh fruits, dairy products, and red meat was slightly higher in FFQ1. Intake of other foods such as tubers, beans, poultry, eggs, nuts, and sweetened beverages was not significantly different between FFQ1 and FFQ2. Compared with FFQ2, the nutrient intake of energy, carbohydrates, cholesterol, vitamin A, calcium, phosphorus, and potassium was slightly higher in FFQ1. Intake of other nutrients such as protein, fat, dietary fiber, vitamin C, and iron was not significantly different between FFQ1 and FFQ2.

Table 2. Reliability of Intakes of Food Groups and of Nutrients between FFQ 1 and FFQ 2 (N=160)
Table 2 also shows the results from the reliability assessment of FFQ1 vs. FFQ2. The median ICC of food groups between FFQ2 and FFQ1 was 0.41 (range: 0.21-0.66). The ICCs of nutrients ranged from 0.56 to 0.76. When food groups and nutrient intakes were categorized into quartiles, the agreement rates between FFQ1 and FFQ2 in the same quartile ranged from 27.5% to 49.4%, whereas those in the same or adjacent quartiles ranged from 70.0% to 95.0%, and misclassification to an extreme quartile was rare (< 10%).
-
Table 3 reports the descriptive statistics for the mean (SD) and median (IQR) intake of 17 types of food groups and 15 types of nutrients between FFQ2 and 24 h DRs. Compared with 24 h DRs, the intake of fresh vegetables, fresh fruits, dairy products, sweetened beverages, energy, cholesterol, and calcium was slightly higher in FFQ2. Intake of other foods and nutrients was not significantly different between FFQ2 and 24 h DRs.

Table 3. Agreement between Intake of Food Groups and Nutrients between 24 h DRs and FFQ 2(N=160)
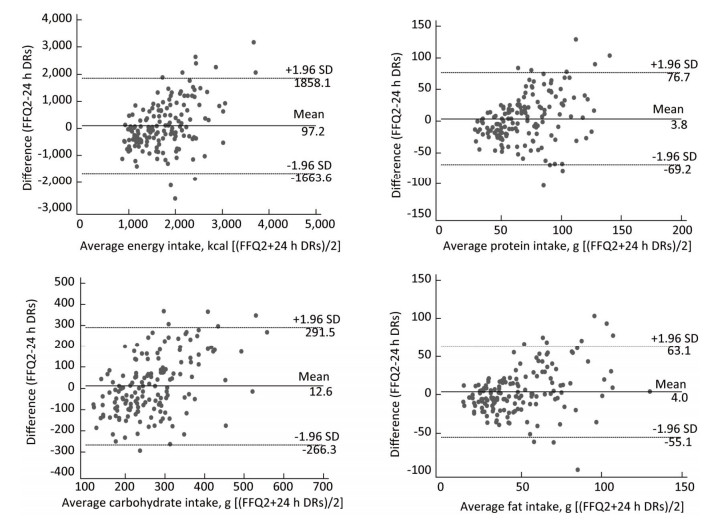
Results obtained from the validity assessment of FFQ2 vs. 24 h DRs are presented in Table 3 and Figure 2. The Spearman's correlation coefficients (rs) of food groups and nutrients between FFQ2 and 24 h DRs ranged from −0.04 to 0.59 and 0.08 to 0.45, respectively. When food groups and nutrient intakes were categorized into quartiles, the agreement rates between FFQ2 and 24 h DRs in the same quartile ranged from 23.8% to 45.0%, whereas those in the same or adjacent quartiles ranged from 50.0% to 100.0%. Misclassification to an extreme quartile was rare. Figure 2 depicts the Bland-Altman plots for energy, protein, carbohydrates, and fat. With the exception of a few, the majority of data points lied between 95% limits of agreement, closer to the middle horizontal line.
Figure 2. Bland-Altman plots for nutrients between FFQ2 and 24 h DRs (N = 160).
Study Sample Characteristics
Reliability of FFQ1 vs. FFQ2
Validity of FFQ 2 vs. 24 h DRs
-
This study examined the reliability and validity of a semi-quantitative FFQ to assess a wide range of food groups and nutrients among children aged 12-17 years living in urban and rural areas of China. In this validation study, 24 h DRs on three consecutive days were used as a reference method, which conforms to the generally accepted minimum number of three recalls required for representation[21]. Results of usual food intake and correlation coefficients suggest that the FFQ was reproducible and performed well compared with 24 h DRs among Chinese children aged 12-17 years.
The FFQ covers a longer period of dietary history varying from months to years, which can be used to evaluate dietary habits. However, adult FFQs always cover one year to estimate their dietary habits. For a population with a complicated dietary behavior, such as Chinese adolescents, it appears to be slightly difficult to collect dietary information accurately using FFQ by recalling. In this study, we collected the dietary information using adolescents' FFQ that covers a month to reduce recall bias.
The number of food items listed in the FFQ tends to vary widely in different studies. Willet[22, 23] suggested that there was a rapidly decreasing marginal gain in information obtained using increasingly detailed questionnaires. This implies that food lists must be carefully selected with a large amount of information. Too long questionnaires would result in tiredness and disgust among participants, which would eventually impair the precision and accuracy of the questionnaires. Therefore, the FFQ used in this study, which was composed of a list of 72 food items, appears to have an optimal length. According to the study of Willett[14], the number of participants necessary to conduct reproducibility and validity studies was at least 110, and if there were more participants, valuable information would be obtained for the assessment of the questionnaires. In this study, 160 participants finally volunteered and completed the FFQs and the 24 h DRs. This sample size was considered to be appropriate for the validation of FFQ.
The reliability results obtained in this study were comparable to those of some studies on children from other countries[4, 9-11, 24, 25]. When the food intakes were categorized into quartiles, FFQ1 vs. FFQ2 produced good agreement rates in the same or adjacent quartiles, and misclassification to an extreme quartile was rare (< 10%). The ICCs computed in this study (range: 0.21-0.76) for food groups and nutrients were quite similar to those reported in previous studies on adolescent populations (ICC range: 0.01-0.83)[24-27]. However, the ICCs computed for nutrients were higher than those computed for food groups, which was due to the food intake frequencies that are more variable than those of nutrient intakes. Consistent with previous studies[28], we found that reliability was related to consumption frequency, which resulted in higher ICCs for foods with higher intake frequencies. If the questionnaires were completed by participants with parents present, perhaps the results would have been better. However, as far as the results were concerned, the FFQ demonstrated acceptable reliability in the sample of Chinese children based on their food and nutrient intakes.
Regarding validity, a major component was the selection of an appropriate reference method to assess FFQ. There is no gold standard for this measurement. However, it is crucial that the errors of both methods be as independent as possible. In the absence of an absolute gold standard for dietary assessment, the 24 h DRs were selected as the reference method. This method was advantageous in its ability to capture all food intakes without depending on memory and thus had the fewest correlated errors with FFQs[14]. The correlations obtained for validity between FFQ2 and 24 h DRs in our study were similar to those reported in other studies[25, 29]. The cross-classification analysis revealed that the majority of participants were correctly classified into the same or adjacent quartiles (range: 50.0%-100.0%), and < 10% of them were misclassified into an opposite quartile.
The overall correlation coefficient of validity was less than that of reliability. One possible explanation for several instances of the observed poor validity was that some of these foods were not being consumed regularly (e.g., poultry, desserts, salted vegetables, and fungus algae) and therefore were not recorded during the 24 h DR period. This was an expected limitation because the 24 h DR method that was used as reference to validate the FFQ covers only a limited period of time. The somewhat limited agreement between the FFQs and the 24 h DRs could also be due to the fact that they were measuring different aspects of diet. One was measuring the usual intake, and the other was measuring the current intake. These reasons led to a slightly lower correlation coefficient between FFQ2 and 24 h DRs.
However, not all foods or nutrients have low correlation coefficient in validity. If some foods were consumed regularly, the correlation coefficient between FFQ2 and 24 h DRs was higher. For example, in our study, dairy products, red meat, fresh fruits, and sweetened beverages were consumed regularly by the children, and the Spearman's correlation coefficient and the cross-classification analysis results were higher.
The results of this study also demonstrated that intake of fresh vegetables, fruits, dairy products, and sweetened beverages in FFQ2 was slightly higher than that in 24 h DRs, which was also observed in the majority of studies. The NHANES study conducted in the USA found that FFQ food intake estimates for children aged 4-15 years were generally higher than those of 24 h DRs estimates[30]. A study from Belgium on children aged 11-18 years reported that all foods, except cheese, soft drinks, and chips, were overrated[31]. The potential explanation that was proposed was that it was due to recall bias. Participants tend to overestimate their actual intake when attempting to recall the frequency of multiple food items consumed in an FFQ. The higher intakes derived from the FFQs were predictable and have been observed in previous studies[32, 33].
In addition, for a country as complex as China in terms of food, it appears to be slightly difficult to collect dietary information accurately using FFQ by recalling from adolescents as they are less able to estimate food intake compared with adults. However, based on the results, we could infer that foods with certain size or servings exhibited higher correlation. For example, dairy products, fruits, beverages, and eggs, always with a certain size, showed higher correlation. This reminds us of the need to promote food portions in China.
The major strengths of this study include a high participation rate and adequate sample size, appropriate questionnaire length, detailed data collection by trained interviewers, preparing the food diary, and using food photo album and prepared recipes for estimating portion size and intake amount. Previous studies have identified the need for additional foods in the picture library and some important aspects in training and supervising field workers to reduce error sources during data collection[34]. An additional strength of this study is the use of the same nutrient database to calculate intake from 24 h DRs and FFQs. Nevertheless, some limitations still exist in this study. Because the FFQ covers only the past month, it was unable to capture seasonal variations in food intake. Although diet records are recognized as the gold standard, errors in recording as well as changes in dietary habits as a result of keeping a record are inevitable. These limitations may have decreased the apparent validity of the FFQ.
-
The FFQ demonstrated acceptable validity and reproducibility in a sample of Chinese children and adolescents based on their food and nutrient intakes. The comparability of the validity to that reported in the current literature suggests that FFQ assessment of dietary intakes in Chinese children remains feasible for the purpose of ranking individuals' dietary exposures in epidemiological studies.
-
No potential conflict of interest was reported by the authors.
-
The authors would like to thank the Beijing Center for Disease Prevention and Control, the Chongqing Center for Disease Control and Prevention, the Yanqing Center for Disease Control and Prevention, and the Wanzhou Center for Disease Control and Prevention, and also thank all the participants and project staffs. This project would not have been possible without all of their support.
the Science & Technology Basic Resources Investigation Program of China 2017FY101103
the Science & Technology Basic Resources Investigation Program of China 2017FY101101

 Quick Links
 DownLoad: