


HTML
-
CAdmium (Cd) is a heavy metal that is commonly found in the environment, and the source of Cd can be natural (weathering of rocks, volcanic eruptions, or forest fires) or anthropogenic (industrial emissions and urban pollution)[1]. Cd is non-biodegradable and continues to be a significant water and food contaminant despite efforts to reduce its use. Cd presents a problem in the context of global health and the environment, as this metal possesses a very long biological half-life (from 10 to 30 years) and a low excretion rate[2]. Given this, attention has recently been focused on non-occupational exposure to Cd and the possible health risks[3-5]. Epidemiological data revealed that lifetime exposure to environmentally relevant levels of this metal posed a risk of various diseases at the organ level and nervous tissue disorders[6-8]. Experimental studies of subacute and prolonged oral exposure to Cd, which is the main route of exposure, revealed a broad spectrum of toxic effects in many tissues, with the kidneys and liver being the most affected organs[9-14]. Increased levels of Cd were observed in the lungs of rats and mice exposed to oral Cd[15-18], but, to our knowledge, data regarding the immune pulmonary response to this metal have not been documented. A single study examined the effects of prolonged oral Cd intake on the neuronal pathways that regulate bronchial tone in mice[19]. Recent epidemiological data imply that obstructive lung disease, among other disorders, showed an association with lifetime exposure to environmentally relevant levels of dietary Cd[5, 20]. Thus, there is a need to investigate the pulmonary effects of Cd when this metal is orally ingested.
Previous studies revealed that oxidative stress and inflammation[21-24] in combination with tissue infiltration by leukocytes and their proinflammatory effects (production of reactive oxygen species and cytokines)[22, 23, 25] are the underlying mechanisms of Cd-induced toxicity in various organs.
Given the data provided by the previously discussed studies, the aim of our current work is to examine if the lungs are an inflammatory target of orally ingested Cd. Using a rat model that was orally administered Cd-spiked drinking water for 30 days, we examined the basic aspects of Cd-induced immunotoxicity in the lungs (antioxidant enzyme defense, cell infiltration, and innate immunity cytokine responses), and we studied the effects of Cd on the activity of leukocytes (production of reactive oxygen and nitrogen species, cytokine production) within the lungs. The influence of Cd in regard to immunological homeostasis of commensal microorganisms within the lungs was also investigated.
-
Cadmium chloride was purchased from Serva (Serva, Feinbiochemica, Heidelberg, Germany). L-epinephrine, hexadecyltrimethylammonium bromide (HTAB), N-(1-naphthyl) ethylenediamine dihydrochloride, sulfanilamide (p-aminobenzenesulfonamide), o-dianisidine dihydrochloride, and myeloperoxidase (MPO) were all purchased from Sigma (Sigma Chemical Co., St. Louis, MO, USA). Nitro blue tetrazolium (NBT) and hydrogen peroxide (H2O2) were purchased from AppliChem (AppliChem, Darmstadt, Germany) and from Zorka Farma (Sabac, Serbia), respectively. N, N, Nx, Nx- ethylenediaminetetraacetic acid (EDTA) disodium salt dihydrate was obtained from USB Corporation (Cleveland, OH, USA). Sucrose was purchased from Lachner (Neratovice, Czech Republic). Sodium nitrite was purchased from Fluka Chemika (Buchs, Switzerland). RPMI-1640 (Biowest, Nuaillé, France) culture medium was supplemented with 2 mmol/L glutamine, 20 µg/mL gentamycin (Galenika a. d., Zemun, Serbia), and 5% (v/v) heat-inactivated fetal calf serum (Biowest, Nuaillé, France). MPO and NBT were dissolved in water. All solutions used in cell culture experiments were prepared under sterile conditions and were filter sterilized (Minisart, pore size 0.20 µm, Sartorius Stedim Biotech, Goettingen, Germany) prior to use.
-
All animal procedures were performed in accordance with Directive 2010/63/EU on the protection of animals used for experimental and other scientific purposes and were approved by the Ethical Committee for the Use of Laboratory Animals of the Institute for Biological Research 'Sinisa Stankovic', University of Belgrade (No 05-12/15).
Male Dark Agouti (DA) rats (5-7 weeks old), previously shown to be more reactive to Cd exposure[26, 27], were conventionally housed (12-h light/dark cycle, ambient temperature of 22 ± 2 ℃ and 60% relative humidity, unlimited access to standard rodent pellet and water) in the unit for experimental animals at the Institute for Biological Research 'Sinisa Stankovic', Belgrade, Serbia. Rats were exposed for 30 days to Cd doses that cover environmentally relevant Cd concentrations[28-31] that mimic human exposure[32-34]. CdCl2 was prepared in distilled water at concentrations of 5 mg/L (5 ppm) and 50 mg/L (50 ppm) of Cd (Ⅱ) ion. Control rats were given distilled water. Cd solutions and water were replaced with freshly prepared solutions twice per week. Four individuals were assigned per group in two independent experiments.
-
Animals were anesthetized by i.p. injection of 40 mg/kg bw of thiopental sodium (Rotexmedica, Tritau, Germany) after a 30-day period of oral Cd intake. Blood (withdrawn from the abdominal aorta with a syringe containing 5 U/mL of heparin), liver, and kidneys were collected at necropsy, flash frozen in liquid nitrogen, and stored at −80 ℃ until use for Cd content determination.
Lungs were aseptically removed, cleared of blood, and weighed. Relative lung mass was calculated according to the following formula: lung mass/body mass ×100. The upper half of the left lung was used for Cd content determination, and the rest of the left lung was used for preparation of tissue homogenates. The middle lobe of the right lung was processed for histological analysis. The rest of the right lung was used for isolation of lung cells by enzyme digestion.
-
Cd content in blood and in liver, kidney, and lung tissues was determined by inductively coupled plasma mass spectrometry (ICP-MS) (ICAP, Q, X Thermo Scientific series 2). The entire system is controlled by Qtegra Instrument Control Software. Samples were decomposed in the microwave digestion system (Ethos One, Milestone Italy) at 180 ℃ in a mixture of concentrated HNO3 (65%, Distill acid, Hotel Berghof, Germany) and H2O2 (30%) by applying a temperature program consisting of a 10 min warm-up to 180 ℃ followed by heating for 15 min. Samples were filtered, and all dilutions were performed with metal-free ultrapure water. All reagents were of analytical grade and supplied by Merck (Darmstadt, Germany). A single-element stock solution containing 1, 000 mg/L of Cd was used for the preparation of standards for analysis by ICP-MS. The internal standards used were 6Li, 45Sc, 115In, and 159Tb (VHG standards, Manchester, UK). The concentrations were expressed as µg of Cd per g of wet tissue.
-
Lung tissue obtained at necropsy was fixed in 4% formaldehyde (pH 6.9) and processed for embedding in paraffin wax for subsequent sectioning at 5 µm. Sections were stained with hematoxylin and eosin (H & E) and evaluated for histopathological changes using a Leica DMLB microscope (Leica Microsystems, Wetzlar, Germany). The parameters analyzed included intraparenchymal hyperemic vessels/prominent alveolar septal vessels, edema (interstitial, perivascular and peribronchiolar), infiltration of inflammatory cells (intraparenchymal, perivascular and peribronchiolar), and respiratory epithelial desquamation. The extent of histopathological changes was assessed in accordance with best practice guideline in toxicologic pathology[35] and graded semi quantitatively using an arbitrary grading scale ranging from 0 to 4[36], where 0 = within normal limits and 1-4 = minimal, mild, moderate, and severe changes, respectively. The number of goblet cells in pulmonary airways was determined in tissue sections stained using the Alcian blue/periodic acid-Schiff method (AB/PAS) and was expressed as cell number per millimeter of epithelial length of small (diameter less than 300 µm) and large (diameter above 300 µm) airways, respectively.
-
Tissue samples were homogenized on ice using an IKA T18 basic homogenizer (IKA Works INC., Wilmington, NC) in ten volumes of sucrose buffer (0.05 mol/L Tris-HCl, pH 7.4, 0.1 mol/L EDTA, 0.25 mol/L sucrose), sonicated (3 × 15 s on ice, at 30% of the maximum intensity amplitude) by a laboratory sonicator (Bandelin electronic, UW 2070, Berlin, Germany), and then ultracentrifuged at 100, 000 × g for 1 h and 45 min at 4 ℃. Supernatants were used for cytokine measurements and determination of antioxidant enzyme and MPO activity.
-
The activity of SOD was determined by the epinephrine method[37], and CAT activity was determined by the rate of H2O2 decomposition measured spectrophotometrically at 240 nm as previously described[38]. SOD and CAT activities were measured using a Shimadzu UV-1800 spectrophotometer (Kyoto, Japan). One unit of enzyme activity was defined as previously described[26]. Values are expressed as enzyme activity units (U)/mg protein. Protein concentration was determined by the Lowry assay[39].
-
Myeloperoxidase activity in lung homogenates and isolated lung leukocytes was measured on the basis of the oxidation of o-dianisidine dihydrochloride by cells[40]. MPO was evaluated by addition of 33 µL of lung tissue homogenate or 106 cell lysates to 967 µL of substrate solution (0.167 mg/mL o-dianisidine dihydrochloride and 0.0005% H2O2 in 50 mmol/L potassium phosphate buffer, pH 6.0). Absorbance was read at 450 nm by an ELISA 96-well plate reader (GRD, Rome, Italy). Values are expressed as MPO units (U)/mg of protein in tissue homogenates or as U/106 cells.
-
Lungs were finely minced, dispensed in RPMI-1640 culture medium supplemented with 2 mmol/L glutamine and 20 µg/mL gentamycin, and incubated by gentle mixing for half an hour in the presence of 1 mg/mL collagenase type Ⅳ (Worthington Biochemical Corporation, Lakewood, NJ, USA) and 30 µg/mL Deoxyribonuclease I (DNase I, Sigma, Sigma Chemical Co., St. Louis, MO, USA) at 37 ℃. The cells obtained were resuspended in culture medium supplemented with 5% (v/v) heat-inactivated fetal calf serum and voriconazole (5 µg/mL) (Pfizer PGM, Poce Sur Cisse, France). Total cell counts and viability were determined by trypan blue exclusion using a LUNA-IITM automated cell counter (Logos Biosystems, Anyang, South Korea). Differential lung leukocyte counts were determined on cytospin preparations of lung cells stained according to the conventional May Grünwald-Giemsa protocol by differentiating at least 300 cells from air-dried cytospin preparations.
For cytokine production, 0.2 × 10⁶ cells/well in 96 well plates were cultured for 48 h in medium alone or in the presence of heat-inactivated Staphylococcus epidermidis (104).
-
A cytochemical NBT reduction assay for the respiratory burst based upon the capacity of cells to reduce NBT[41] was used. NBT (10 µL, 5 mg/mL) was added to the lung leukocyte suspension (0.4 × 10⁶ cells/well of 96-well plate, in 100 µL) and incubated for 30 min. Formazan produced by the cells was extracted overnight in 10% SDS - 0.01 N HCl and was measured at 540/670 nm by ELISA 96-well plate reader.
-
As an indicator of NO formation, the concentration of the stable NO oxidation product, nitrite, was measured using a Griess assay[42] in medium conditioned by lung leukocytes by mixing of 50 µL aliquots of conditioned medium with an equal volume of Griess reagent (a mixture of 0.1% naphthalenediamine dihydrochloride in water and 1% sulphanilamide in 5% phosphoric acid). The absorbance was measured after a 10 min incubation at room temperature at dual wavelength of 540/670 nm by an ELISA 96-well plate reader.
-
Cytokine concentrations in lung homogenates or lung leukocytes were determined using commercially available ELISA sets for rat TNF, IL-10 and IFN-γ, and mouse IL-17 cross-reactive with rat (eBioscience Inc., San Diego, CA, USA) and rat IL-1β and IL-6 (R & D systems, Minneapolis, USA) according to the manufacturer's instructions. Cytokine titers were calculated by a reference to a standard curve constructed using known amounts of respective set-provided recombinant cytokines.
-
Results are expressed as means ± standard deviation (SD). Statistica 7.0 (StatSoft Inc., Tulsa, OK) software was used for statistical analysis. The results presented were pooled from two independent experiments in which four animals were assigned to each treatment group per experiment. Statistical significance was defined by a Mann-Whitney U test. A probability level of less than 0.05 was considered significant.
Chemicals
Animals and Cd Treatment
Tissue Collection and Processing
Cd Determination
Pulmonary Histology
Preparation of Lung Homogenates
Measurement of Superoxide Dismutase (SOD, EC 1.15.1.1) and Catalase (CAT, EC 1.11.1.6) Activity in Lung Homogenates
Determination of MPO Activity
Pulmonary Leukocyte Preparation and Composition
Lung Leukocyte Respiratory Burst
Nitric Oxide (NO) Production
Enzyme-linked Immunosorbent Assay (ELISA)
Data Display and Statistical Analysis
-
Rats were given Cd in distilled water at 5 ppm (lower dose) and 50 ppm (higher dose) for 30 days. This resulted in an average daily Cd intake (calculated on the basis of water consumption) of 0.35 ± 0.04 mg/kg and 3.51 ± 0.29 mg/kg in the groups receiving 5 ppm and 50 ppm of Cd, respectively. There was no difference in body mass gain during the period of Cd consumption in all experimental groups (228.4 ± 14.6, 233.2 ± 17.6, 219.9 ± 41.8 at 0 ppm, 5 ppm, and 50 ppm, respectively). Consumption of Cd resulted in a dose-dependent increase in the metal levels in peripheral organs, with the highest levels being observed in the kidneys and liver (Table 1). Substantial levels were noted in the lungs and blood also.
Cd Dose (ppm) Lungs Blood Kidney Liver 0 3.5 ± 1.6 9.4 ± 0.9 12.6 ± 0.4 6.2 ± 1.5 5 6.8 ± 1.2* 21.6 ± 15.5* 413.5 ± 26.3* 195.6 ± 101.0* 50 107.7 ± 5.5*, # 25.6 ± 1.3* 5214.3 ± 188.8*, # 260.6 ± 138.8*, # Note.Data are presented as mean values ± SD. Significance at: *P < 0.05 vs. controls (Cd dose 0 ppm) and #P < 0.05 vs. low (5 ppm) Cd dose. Table 1. Cadmium Concentration in Tissue (µg/kg)
-
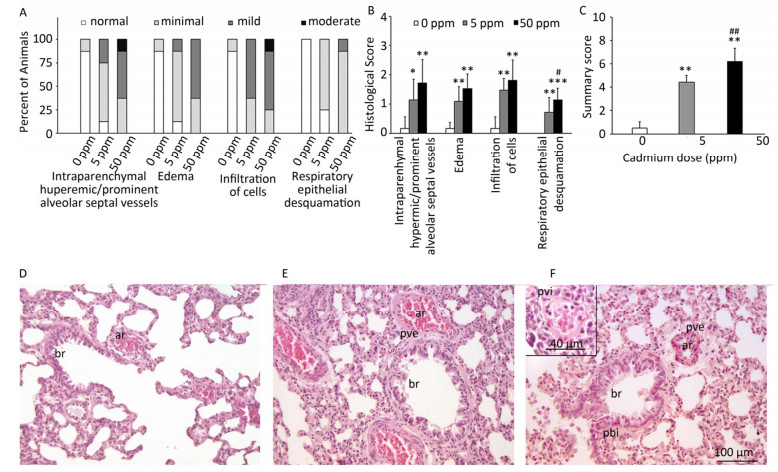
Histological analysis of lung tissue from a control group (Figure 1D) revealed a normal histological structure (despite minimal hyperemic blood vessels, edema and infiltration noted in some animals) (Figure 1A, B). Treatment with lower Cd doses resulted in more prominent tissue changes ranging from minimal to mild in almost all rats (Figure 1A, B), with perivascular edema and infiltration being particularly noticeable (Figure 1E) and peribronchiolar edema and desquamation of respiratory epithelium exhibiting minimal intensity. Lungs from rats exposed to higher Cd doses (Figure 1F) were more seriously affected and exhibited histopathological scores for almost all parameters ranging from minimal to moderate (Figure 1A, B). Perivascular edema and perivascular, peribronchial, and interstitial inflammatory infiltration were the most remarkable changes associated with this treatment group. A detailed examination of all histopathological scores revealed a dose-dependent increase following Cd consumption (Figure 1C).

Figure 1. Effect of oral Cd intake on the lung. (A) Distribution of histological scores for specified parameters in control and Cd-treated animals. (B) Histopathological scores for observed parameters. (C) Summary of analyzed histopathological scores. (D, E, F) Representative micrographs of lung sections from control animals (D) and animals exposed to cadmium at 5 ppm (E) and 50 ppm (F) stained with H & E. Inset on F: remarkable perivascular infiltration. Abbreviations: ar - arteriole, br - bronchiole, pve - perivascular edema, pvi - perivascular infiltration, pbi - peribronchial infiltration. Bar = 100 µm, 40 µm (inset). Data are expressed as mean values of eight animals per treatment group ± SD. Significance at: *P < 0.05, **P < 0.01 and ***P < 0.001 vs. Cd 0 ppm; #P < 0.05 and ##P < 0.01 vs. Cd 5 ppm.
The number of goblet cells in larger intrapulmonary airways was substantially increased after treatments with Cd (Figure 2B, C) compared to that observed in controls (Figure 2A). Consumption of higher Cd doses resulted in the appearance of goblet cells in intrapulmonary airways with a diameter of less than 300 μm (Table 2 and Figure 2B, C).
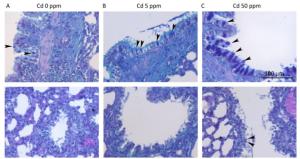
Figure 2. Goblet cell numbers in airways of animals exposed to Cd. (A) Control animals. (B) Animals exposed to 5 ppm of Cd. (C) Animals exposed to 50 ppm of Cd. Representative micrographs of intrapulmonary respiratory airways of large (up) and small (down) diameter obtained from sections stained using the AB/PAS method. Bar = 100 μm; arrowheads - goblet cells.
Cd dose (ppm) Goblet Cells (N/mm of luminal perimeter) Small airways Large airways 0 0 ± 0 1.7 ± 0.9 (0-1.9) 5 0 ± 0 10.6 ± 2.5 (8.1-13.1) 50 2.3 ± 3.3 (0-10.1) 58.3 ± 46.2 (34.6-137.1) Note.Small airways-airways with diameter less than 300 µm. Large airways-airways with diameter larger than 300 µm. Data are presented as mean values ± SD. Range is given in parenthesis. Table 2. Number of Goblet Cells in Pulmonary Airways Following Oral Cd Administration
-
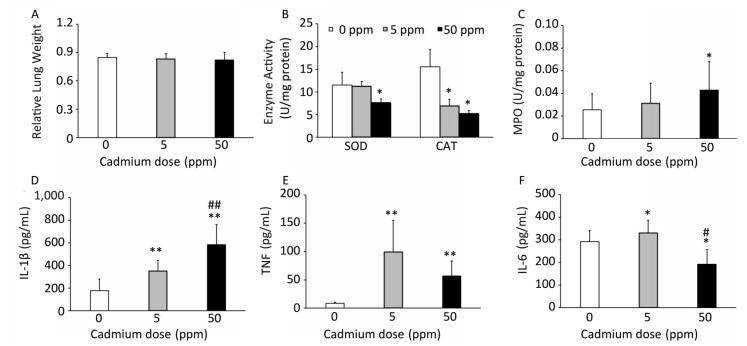
Consumption of Cd caused no changes in relative lung mass (Figure 3A). Examination of basic oxygen free radical scavenging enzymes in lung tissue homogenates, specifically SOD and CAT, revealed a significant decrease in activity of both enzymes at the higher Cd dose and a decrease in CAT activity at the lower dose (Figure 3B).
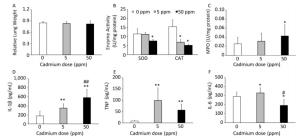
Figure 3. Effect of oral Cd intake on the relative lung mass, enzyme activity, and proinflammatory cytokine levels in lung homogenates. (A) Relative lung weight. (B) SOD and CAT activity. (C) MPO content. (D) IL-1β. (E) TNF. (F) IL-6. Data are expressed as mean values of eight animals per treatment group ± SD. Significance at: *P < 0.05 and **P < 0.01 vs. Cd 0 ppm; #P < 0.05 and ##P < 0.01 vs. Cd 5 ppm.
An increase in MPO activity was observed only in response to the higher Cd dose (Figure 3C). Measurement of proinflammatory cytokine concentrations in lung homogenates revealed a dose-dependent increase in IL-1β concentrations (Figure 3D), increased levels of TNF at both Cd doses (Figure 3E), and increased IL-6 at the lower Cd dose (Figure 3F), while lower levels of IL-6 were noted at 50 ppm compared to those in controls.
-
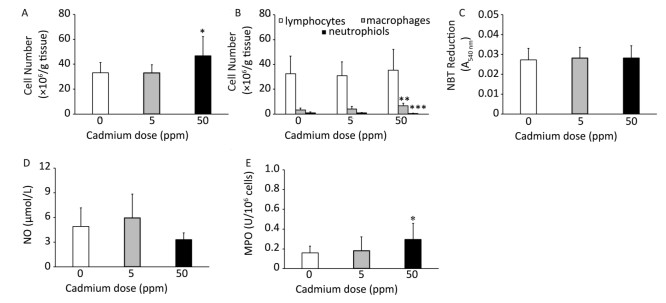
Higher Cd dose intake resulted in an increase in the number of leukocytes isolated from lung tissue by enzyme digestion (Figure 4A) that resulted from an an increased number of macrophages in the lungs (Figure 4B). No significant change was noted in the number of isolated lymphocytes, while the number of granulocytes decreased following higher Cd dose consumption (Figure 4B).
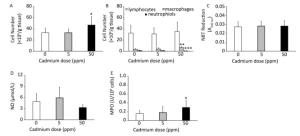
Figure 4. Effect of oral Cd intake on lung leukocyte activity. (A) Number of lung cells. (B) Absolute number of lymphocytes, macrophages, and neutrophils. (C) NBT reduction. (D) NO production. (E) MPO content. Data are expressed as mean values of eight animals per treatment group ± SD. Significance at: *P < 0.05, **P < 0.01 and ***P < 0.001 vs. Cd 0 ppm.
Examination of the activity of isolated lung leukocytes revealed no changes in NBT reduction capacity (Figure 4C) and NO production (Figure 4D), but the activity of intracellular MPO increased following higher Cd dose consumption (Figure 4E). Measurement of proinflammatory cytokine production by lung leukocytes revealed decreased IL-1β (Figure 5A) and TNF (Figure 5B) at both Cd doses and increased IFN-γ production at a higher Cd dose (Figure 5D), with unchanged levels of IL-6 (Figure 5C) and IL-17 (Figure 5E). No changes in the anti-inflammatory cytokine IL-10 were observed (Figure 5F).
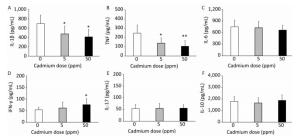
Figure 5. Cytokine response of lung leukocytes after oral Cd administration. (A) IL-1β. (B) TNF. (C) IL-6. (D) IFN-γ. (E) IL-17. (F) IL-10. Data are expressed as mean values of eight animals per treatment group ± SD. Significance at: *P < 0.05 and **P < 0.01 vs. Cd 0 ppm.
-
To determine if altered activity of lung leukocytes could potentially influence immunological homeostasis within the lungs, we exposed lung leukocytes isolated from controls and from animals receiving lower and higher Cd doses to a commensal microbe, Gram-positive bacteria S. epidermidis (Figure 6, Panel B). S. epidermidis did not affect cytokine production by lung leukocytes isolated from control rats (0 ppm), with the exception of lower IL-1β levels following S. epidermidis stimulation (Figure 6, Panel A). In contrast to controls, lung leukocytes obtained from animals orally exposed to Cd responded to S. epidermidis exposure by exhibiting a dose-dependent increase in IL-1β and increased levels of TNF, IFN-γ, and IL-17 at the higher dose (Figure 6, Panel B). Measurement of anti-inflammatory/regulatory cytokine IL-10 revealed increased levels of IL-10 at both Cd doses compared to those of controls.
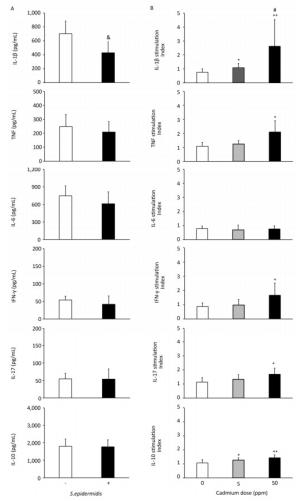
Figure 6. Effect of S. epidermidis exposure on IL-1β, TNF, IL-6, IFN-γ, IL-17, and IL-10 production by Cd-exposed lung leukocytes and stimulation index. (Panel A) Non-stimulated and S. Epidermidis-stimulated cytokine production by lung leukocytes from control animals. (Panel B) Responsiveness of lung leukocytes isolated from control and Cd-exposed animals to S. epidermidis stimulation in vitro. Data are expressed as mean values of eight animals per treatment group ± SD. Significance at: & P < 0.05 vs. non-stimulated; *P < 0.05 and **P < 0.01 vs. Cd 0 ppm; #P < 0.05 vs. Cd 5 ppm.
General Considerations
Lung Histology
Effects of Cd Intake on Lungs
Effects of Cd Intake on Lung Leukocyte Activity
Effects of Cd Intake on Lung Leukocyte Responsiveness to Challenge with Commensal Microorganisms
-
Cd is one of the most toxic metals present in the environment, and long-term exposure to this metal increases the risk of developing disorders in various organs[6-8]. Oxidative stress and inflammation[21-24] in combination with infiltration of leukocytes into the tissue resulting in proinflammatory effects (production of reactive oxygen species and cytokines)[22, 23, 25] is the underlying mechanism of Cd-induced toxicity. In the present study, the effects of 30-day oral intake of 5 ppm and 50 ppm of Cd on pulmonary immune responses was examined in rats. Signs of chronic inflammation in lung tissue were observed in Cd-treated animals. Depending on the cell activity examined, Cd either caused no effect or exerted either a stimulatory or an inhibitory effect on lung cells. These data demonstrate for the first time that orally ingested Cd that enters the organism via intestinal absorption affects pulmonary inflammation and immune reactivity.
Following oral ingestion of Cd, the highest amount of this metal was detected in the kidneys and liver, indicating that these are the target organs for Cd accumulation within the body[43]. Significant Cd concentrations were also observed in the lungs of rats, which is consistent with other studies[15, 16, 18]. Within the lungs, Cd exerted toxicity as indicated by changes in SOD and CAT activity. The observed reduction in the activity these host antioxidant defenses was most likely a result of the tissue attempting to counter-attack the increased production of reactive oxygen species (a recognized marker of Cd toxic potential) and to limit tissue damage[44, 45]. This response, however, may also have been due to a direct effect of Cd on these enzymes, as it is established that this metal can interact with SOD[46]. Leukocyte infiltration into the lungs may be secondary to tissue injury induced by reactive oxygen species production. Increased levels of MPO in lung homogenates reveal increased activity of infiltrated leukocytes. Given their aggressive effector activities[47], infiltrated cells might further amplify tissue damage.
Edema and increased cell infiltration in the lung tissue indicate an increase in vascular permeability following oral-Cd exposure. The particularly noticeable perivascular edema, as well as the highest score compared to that of interstitial and peribronchiolar edema following oral Cd exposure, support this assumption. Cd is known for its effects on the vascular endothelium and adhering junctions between endothelial cells[48]. Changes in respiratory epithelium desquamation are dose dependent and likely represent the consequences of tight-junction disruption between epithelial cells as shown in alveolar epithelial cells in mice following Cd treatment[48]. Subchronic exposure to oral Cd resulted in an increase in the number of goblet cells in the airways with a diameter over 300 µm and, at a higher dose, in the appearance of these cells in the airways with a diameter below 300 µm. Although rodents (mice and rats) possess a very small number of goblet cells in the lungs, with the majority present in the upper airways[49], the number of these cells and the accompanying mucus secretion increases in response to infectious and/or inhaled irritants, and this may lead to mucus plug formation and airway obstruction[50-52].
In agreement with previous data that revealed proinflammatory cytokine responses in the organs affected by oral Cd administration, including gut[53] and liver[54], increased levels of innate immunity inflammatory cytokines in lung homogenates following Cd oral intake resulted in the induction of lung innate immune responses. Increased levels of IL-1β, TNF, and IL-6 (at low Cd dose solely) may be important for induction and/or progression of immunologically relevant lung diseases. In this context, increased airway hyperresponsiveness was reported in mice exposed for prolonged (20 weeks) periods to a low Cd dose (10 ppm)[19]; however, lower levels of TNF at 50 ppm as compared to those at 5 ppm, as well as lower (compared to control) IL-6 levels at 50 ppm, suggest that a higher Cd dose may also exert inhibitory effects. Given that we observed decreased production of IL-1β and TNF by lung leukocytes after enzymatic digestion, it can be assumed that other lung cell types (endothelial and epithelial cells) are responsible for increased cytokine levels in lung homogenates. In this regard, increased cytokine production by bronchial cells[55], alveolar epithelial cells[56], and vascular endothelial cells[57] was demonstrated in response to Cd stimulation.
Oral Cd administration differentially affects cytokine production by lung leukocytes (decreased IL-1β and TNF, increased IFN-γ, and absence of effect on IL-6, IL-17 and IL-10). These data are in agreement with the long-known disparity in the effects of Cd on the production of different cytokines by leukocytes[58, 59]. A more recent study revealed differential effects of Cd on cytokine production by primary lung cells (fibroblasts and macrophages)[60], adding to the list cells that react to Cd by differential cytokine responses. Simultaneous decreased production of IL-1β and TNF (cytokines of prime importance for prompt innate immune defense), but increased production of IFN-γ (the main effector of injurious immune reactions), depict perturbation of lung leukocyte cytokine responses that in a broader context, may be relevant to disease development.
The effect of Cd on proinflammatory cytokine responses in the lungs implies that Cd-exposed animals may be more susceptible to disturbances in immune homeostasis within this tissue. In support of this, increased cytokine production by lung leukocytes from Cd-exposed animals in response to exposure toe commensal microbe, such as Gram-positive bacteria S. epidermidis that is considered to be a normal component of the microbial community of upper respiratory tract[61] that may pose a threat to human health in settings of compromised immune function[62-64], was observed. Stimulation of proinflammatory cytokine production (particularly IFN-γ and IL-17 that are the main mediators of effector activities of cellular immune responses) by S. epidermidis exposure may amplify lung injury. Increased production of anti-inflammatory cytokine IL-10 in response to S. epidermidis exposure in Cd-primed lung cells may represent an attempt of the host to limit a potentially harmful proinflammatory response.
In conclusion, the data presented in this study highlighted the effects of orally ingested Cd on pulmonary inflammation and immune reactivity. Data presented in this study may shed light on the link between dietary Cd levels and adverse health effects. These findings support epidemiological data that link long-term exposure to environmentally relevant levels of dietary Cd with obstructive lung disease and other disorders[5, 20].
-
The authors declare that there is no conflict of interest.
the Ministry of Education, Science and Technological Development of the Republic of Serbia #173039

 Quick Links
 DownLoad: