


HTML
-
The age of nanotechnology is at hand; however, the hazards associated with nanomaterials and their application should be explored to ensure the safe exploitation of the technologies with minimal or no adverse effects on health. Considering that metal-containing nanoparticles (MNPs) have some excellent functions in sound, light, electric, magnet, adsorbability, catalysis, and antibacterial property, they are currently applied extensively in various regular consumer goods and industrial products. MNPs such as nano-zinc oxide (nano-ZnO)[1, 2], copper oxide nanoparticles (CuO-NPs)[3, 4], nano-lead sulfide (nano-PbS)[5], and nano-aluminum oxides (nano-Al2O3)[6] are present in several regularly used products, including sunscreen, plastics, glass, ceramics, batteries, fire retardants, rubber, and optical and electronic devices. They are also present in water treatment equipment and several skin care products. To safeguard human health in the course of the exploitation of nanotechnologies, more scientific knowledge on the potential hazards of different MNPs is required. However, it is critical to note that the data available currently is not adequate for the analysis of MNP toxicity and to elucidate the associated potential health hazards. The pulmonary toxicity of some MNPs are well known. Rani et al. (2013) reported the histopathologic injury in rat lung following CuO-NPs intratracheal instillation[7]. Lai et al. (2018) reported the severe pulmonary inflammation in C57BL/6 mice was induced at day 14 when 5 mg/kg CuO-NPs was employed through endotracheal instillation. Moreover, fibrosis began at day 21[8]. ZnO-NPs induced dose-and-time-based regional inflammation[9]. Nano-Al2O3 was cytotoxic to pulmonary cells in vitro[10]. Damage to rat pulmonary tissue has been reported by PbS-NPs-induced oxidative damage and inflammatory response[11]. However, there is limited knowledge regarding the toxicokinetics of MNPs through a biological barrier and their transport and distribution within tissues. This lack of knowledge makes the targeting of organs and determination of toxicity thresholds challenging. In addition, different studies have reported inconsistent results on the toxicity of MNPs[12], with different laboratories even reporting contrasting results. These inconsistencies in the literature regarding of the toxicity of MNPs gives rise to uncertainty regarding toxicity analysis and hazard prediction of MNPs. Therefore, further studies are urgently needed. Experiments and studies on the toxicity of MNPs should be sustained to enrich existing databases containing information on the toxicity of various MNPs. A good database would enable stakeholders to evaluate the health hazard of MNPs and facilitate the adoption of effective risk control measures. MNPs are known to exhibit unique toxic effects, which are associated with their physicochemical properties such as small sizes, diverse shapes, and large specific surface area. Therefore, both the chemical constituents and physical properties of MNPs should be considered in toxicological studies. In addition, different MNPs and their corresponding metallic compounds exhibit variations in toxicity. Such variations in toxicity should be investigated further because these results could facilitate the understanding of mechanisms of nanotoxicity. Overall, the results of such studies would supplement current MNP toxicological databases.
In the present study, we compared the impacts of four MNPs, including spherical CuO-NPs (divided into CuO-40, CuO-80, and CuO-100 based on particle size), nano-Al2O3 (classified as sheet and short-rod-shaped based on particle shape), nano-ZnO, and nano-PbS, in addition to their metallic counterparts, including CuSO4, Al2(SO4)3, Zn(CH3COO)2, and Pb(NO3)2 on the air-blood barrier (ABB) permeability in vitro. The aim was to evaluate the potential presence of pulmonary toxicity of the MNPs and the metallic salts. The MNPs in examined in the present study were selected based on their widespread application and the need to update information on their toxicity. Four metallic chemicals, including CuSO4, Al2(SO4)3, Zn(CH3COO)2, and Pb(NO3)2 were chosen as the counterparts of the MNPs for comparison. MNPs were physicochemically characterized using X-ray diffraction (XRD), transmission electron microscopy (TEM), magnetic granulometry, and Brunauer–Emmett–Teller (BET)-specific surface area detection. Well-structured models, such as air-liquid interface model[13], dynamic in vitro exposure system[14], 3D blood-testis barrier model[15], in vitro blood-brain barrier model[16], and 3D blood-brain barrier model[17], are suitable for the recreation of the characteristics observed in in vivo physiological conditions. Thus, an in vitro ABB model was developed for application in the toxicity study. The model was developed by co-culturing alveolar epithelium and pulmonary microvascular capillary endothelial cells. Subsequently, permeability impact tests for the selected materials were performed using the model. Permeability coefficients were calculated to denote the permeability changes in ABB quantitatively. Based on the results of the experiments, small spherical CuO-NPs, both sheet and short-rod-shaped nano-Al2O3, Al2(SO4)3, and Pb(NO3)2, increased ABB model permeability, which indicated that the materials had the potential to penetrate the ABB into the pulmonary tissue and the bloodstream. The study also found that some of the tested nanomaterials exhibited higher effects on ABB permeability compared to their chemical counterparts, e.g., small spherical CuO-NPs compared to CuSO4. In addition, MNP size could influence the toxicity level since smaller-sized CuO-NPs exhibited significantly greater effects than the larger CuO-NPs in the present study. The results could supplement existing databases on the toxicology of MNPs, and could be applied in early pulmonary toxicity risk warning systems for substances of high concern.
-
One-day-old Wistar rat pups were purchased from Beijing HFK Bioscience Co., Ltd. [Certificate No. SCXK (Beijing) 2014-0004]. The animal study procedures were approved by local animal ethics committee (Record No. 2016003). A549 (adenocarcinomic human alveolar basal epithelial cell line) cells were purchased from Peking Union Medical College Cell Bank (Beijing, China). MNPs including spherical CuO-NPs, sheet and short-rod-shaped nano-Al2O3, nano-ZnO, and nano-PbS were synthesized and provided by the laboratory of the School of Environment and Energy Engineering, Beijing University of Technology (Beijing, China). The metallic compounds including CuSO4, Al2(SO4)3, Zn(CH3COO)2, and Pb(NO3)2 were analytical grade and obtained from Sinopharm Chemical Reagent Co., Ltd. (Shanghai, China). Dulbecco's modified Eagle's Medium (DMEM)/Ham's F-12 (1:1, v/v) medium and fetal cattle serum (FCS) were purchased from GIBCO-BRL (Grand Island, NY, USA). Endothelial cell growth supplement (ECGS) was obtained from ScienCell (San Diego, CA, USA). Heparin sodium, Lucifer yellow (LY, MW457) and hydroxypropyl methylcellulose (HPMC) were purchased from Sigma (Louis, MO, USA). Resazurin powder was purchased from Alfa Aesar (Tianjin, China). Polyethylene terephthalate transparent hanging cell inserts (PET, pore size 1.0 µm) were purchased from Millipore (Bedford, MA, USA).
-
XRD patterns of MNPs were recorded by Bruker/AXS D8 Advance X-ray diffractometer. A JEOL JEM-2010 transmission electron microscope (TEM) was used to record morphological images and to determine the primary size of materials. The granulometric distribution of CuO-NPs were determined by calculating and categorizing the directional diameters of 200 particles in TEM images. BET specific surface areas of CuO-NPs were determined using a Micromeritics ASAP 2020 surface area analyzer. MNPs were dispersed with 0.5% HPMC with a fully stirring to be 500 mg/L stock suspension consulting a report[18]. The suspension was diluted with DMEM/F12 medium to be application solution when test.
-
Pulmonary capillary endothelial cells (PCECs) were prepared from neonatal Wistar rats using tissue pasted method referring to a report[19] with some modification. Briefly, rat lung was isolated. Distal pulmonary tissue was harvested and immediately minced into small pieces of approximately 1 mm × 1 mm × 1 mm. The tissue pieces were seeded into a flask arranged in a lattice uniformly. The flask was placed upside down in an incubator for 3 h. Afterward, the flask was turned over and 3-mL PCEC growth medium (DMEM/F12 supplemented with 15% FCS (v:v), 1% (v/v) ECGS and 120 U/mL heparin sodium) was added. As the migrated cells reached confluence, tissue debris in the flask was picked out using a pipette. PCECs were identified based on an immunocytochemical assay of factor Ⅷ -related antigen. A549 cells were cultured in DMEM/F12 supplemented with 10% FCS (v:v).
-
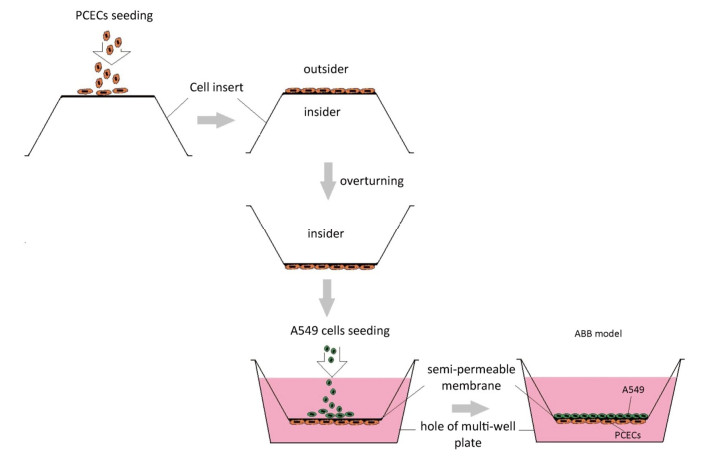
ABB model was developed via the co-culture of A549 cells and PCECs as described in a previous report[20]. Briefly, 200 μL PCECs suspension at a concentration of 2 × 10⁵ cells/mL was firstly seeded on the outside surface of an inverted cell insert. The culture was maintained at 37 ℃ for 12 h. The insert was then turned over and placed into the matched 12-well plate filled with 2, 500 μL PCECs medium. 800 μL A549 suspension at 1 × 10⁴ cells/mL was seeded into the inner surface of the fixed insert. The co- culturing system was incubated for 5 days. The media in both insert and well were changed completely every 2 days until the model was formed. The model preparation procedure is presented in Figure 1.
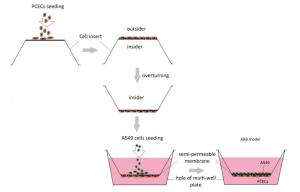
Figure 1. ABB model preparation.
-
TEER was measured using an electrical resistance system (Millicell-ERS, Millipore, Bedford, MA, USA). According to the manufacturer's instructions, a short electrode was placed inside insert and a long one into outside liquid. The resistance value was observed on a readout screen. TEER value was calculated by subtracting the electrical resistance of the blank and a correction for the growth surface area of the insert based on the following equation: TEER (Ω·cm2) = (Ωmodel - Ωblank)·S[21], here S is the effective membrane area (cm2).
-
To evaluate the barrier property of ABB model, leakage test for LY was performed according to a previously reported method[22, 23]. Five inserts with cells were adopted as the model group, and another 5 inserts without cells as the blank group. During the test, 800 μL DMEM/F12 medium containing 20 µmol/L LY was added into both the model group and blank group inserts (as the donor chamber in the model). In addition, another 2, 500 μL DMEM/F12 medium was added into the matched well (as the acceptor chamber in the model), the volume of which was adequate to maintain level equal to that of the medium in the insert. Subsequently, samples of the same volume were collected from acceptor chambers at 10, 20, 30, 40, 50, and 60 min. After each collection, inserts were transferred into another medium-contained well. When the sample collection was completed, the concentrations of LY in the collected samples were determined by measuring fluorescence intensity (FI) at 428/540 nm (Ex/Em) using Multimode Microplate Reader (Varioskan flash; Thermo, USA). Permeability coefficient (P) was calculated as Siflinger-Birnboim described[23]. Cleared volume (ΔC) and average cumulative cleared volume (ΔTCL) were calculated according to the following equations: ΔC (μL) = (ΔCacceptor × Vacceptor)/C0 and ΔTCL = ∑ΔC. ΔCacceptor, Vacceptor, and C0 here referred to the concentration of LY in acceptor chambers, acceptor chamber volume, and the initial concentration of LY in the donor chamber, respectively. The clearance curve of ΔTCL versus time was estimated by linear regression analysis and the slope of the clearance curve was Ps (permeability times surface area). PStest (Ps of PCECs monolayer) was calculated as following equation: 1/PStest = 1/PStotal - 1/PSblank. PStotal and PSblank here referred to Ps of the model group (containing a PCEC monolayer and the PET membrane of the insert) and the blank group (PET membrane only), respectively. Considering the growth surface area of insert (S, 1.1 cm2), P was determined based on the following equation: P (cm/min) = PStest/S.
-
Cells were treated with test samples under different concentrations (five wells in each concentration) at 37 ℃ for 1 h. After exposure, the medium in multi-well plate was changed with growth medium containing 10 μmol/L resazurin and incubated at 37 ℃ for another 1 h. FI at 530/590 nm (Ex/Em) was read using a multimode microplate reader. Cell inhibition rate (IR) was determined using the following equation: IR (%) = [(FIcontrol-FItest)/(FIcontrol-FIbasement)] × 100%. The IC-50 value was calculated according to the following equation: IC-50 = lg-1[Xm-i(∑P-0.5)].
-
The experiment was carried out to test differences in the ABB permeability following exposure to test materials. Test was divided into 11 treatment groups, including CuO-40, CuO-80, and CuO-100, sheet nano-Al2O3, short-rod-shaped nano-Al2O3, nano-ZnO, nano-PbS, CuSO4, Al2(SO4)3, Zn(CH3COO)2, and Pb(NO3)2 groups, a non-treatment group, as well as a blank group (no cell was seeded in insert). When test, the square root (sqrt) of IC-50 (the smaller one of the two IC-50 values of A549 and PCECs) of the test samples in 800 μL DMEM/F12 medium containing 20 µmol/L LY tracer were added into the donor chamber. Inserts of the HPMC group were added in 800 μL DMEM/F12 medium containing 0.5% HPMC and 20 μmol/L LY tracer. Inserts of non-treatment group and blank group were added into 800 μL DMEM/F12 medium containing 20 µmol/L LY only. In addition, another 2, 500 μL DMEM/F12 medium was added into the acceptor chamber. The following procedures including sample collection, LY measurement, and P value calculation was carried out using the same methods mentioned in the leakage test.
-
TEER, P value were presented as mean ± SD. Linear regression analysis was used to estimate clearance curve in the model experiment. Shapiro-Wilk and Bartlett's tests were used for the normality and homoscedasticity tests before parametric tests. Statistical significance was analyzed by ANOVA followed by two-sided Dunnett-T test for multiple comparisons. Changes were considered statistically significant at P < 0.05.
Materials
Characterization of Nanomaterials
Cell Preparation
Development of ABB Model
Measurement of Transepithelial/Transendothelial Electrical Resistance (TEER)
Leakage Test of Model
Determination of Cell Half Maximal Inhibitory Concentration (IC-50)
Permeability Experiment
Statistical Analysis
-
The synthesized MNPs were visible fine powder. Based on the position and relative intensity of diffraction peaks in the XRD patterns, the composite materials were determined as CuO, Al2O3, ZnO, and PbS. In addition, the TEM images revealed that nano-CuO was nearly spherical, the two types of nano-Al2O3 were sheet and short-rod-shaped, and nano-ZnO and nano-PbS were irregularly shaped (Figures 2, 3). Through the calculation and classification of the directional diameters of 200 particles in the TEM images, the dominant particle sizes of three batches of CuO-NPs were determined to be approximately 40, 80, and 100 nm, respectively (Figure 2). For convenience in the present study, they were named as CuO-40, CuO-80, and CuO-100. The average crystallite sizes of CuO-40, CuO-80, and CuO-100 were calculated by Scherrer's formula[24] using the full width at half maximum data of XRD peaks to be 19.61, 27.69, and 24.50 nm in sequence. The corresponding BET specific surface areas by Micromeritics ASAP 2020 surface area analyzer were 8.6044 ± 0.6017, 5.8084 ± 0.5629, and 1.4979 ± 0.1129 m2/g respectively. Because of their small sizes, nanomaterials aggregate easily, which considerably limits their toxic effects. To prevent agglomeration and facilitate observation in the present study, nano-samples were dispersed in 0.5 % HPMC solution. A pre-test called 'a standing test of nanomaterials in dispersant solution', aimed to test the stability of CuO-NPs including CuO-40, CuO-80, and CuO-200, revealed that the CuO-NPs (500 mg/L)-HPMC (0.5% and 1.0%) suspensions had a relatively uniform concentrations at different times (0, 3, 24, and 48 h) and at different depths below the surfaces of the suspensions (0, -10, and -20 cm). The observations indicated that the 0.5% HPMC was an optional dispersant solution for the test nanomaterials. In view of this, the 0.5% HPMC was selected for the preparation of the MNPs administration suspension preparation in the present study.
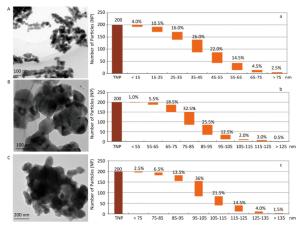
Figure 2. TEM images (A, B, and C) and the granulometric distribution (a, b, and c) of CuO-NPs [CuO-40 (A, a), CuO-80 (B, b), and CuO-100 (C, c)]. A. scale bar, 100 nm; B. scale bar, 100 nm; C. scale bar, 200 nm. The deeper coloring in image was because of the overlap of particles with each other. The particle size distribution graphs showed the dominant particle sizes of CuO-40 (a), CuO-80 (b), and CuO-100 (c) were approximately 40, 80, and 100 nm, respectively. For convenience, they were named as CuO-40, CuO-80, and CuO-100. TNP here meant total number of particle.
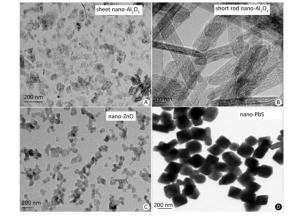
Figure 3. TEM of sheet (A) and short-rod-shaped (B) nano-Al2O3, nano-ZnO (C), and nano-PbS (D). Both nano-ZnO and nano-PbS appeared an irregular shape.
-
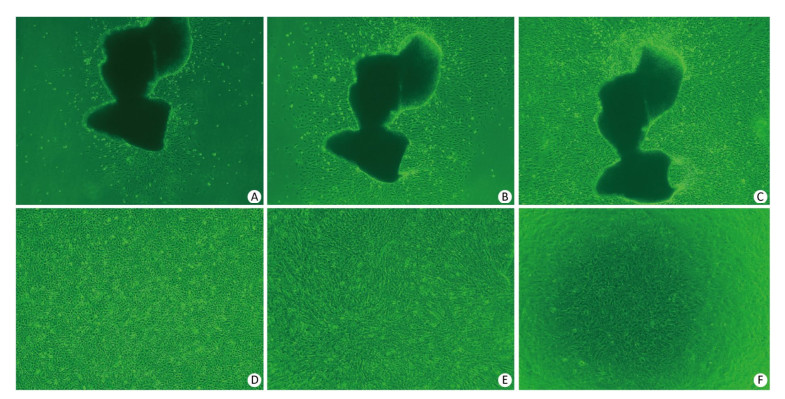
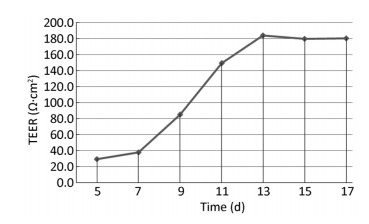
Two days after seeding, cells began to migrate from the edges of the pulmonary tissue (Figure 4A). The first cell appeared spindle-shaped. Cells proliferated vigorously in the following days and grew to form a monolayer to the 5th day (Figure 4C). Immunocytochemical detection of factor Ⅷ-related antigen in cells presented a positive result. Passaged PCECs grew rapidly and appeared in compact spindle and polygonal shapes with ovate nuclei (Figure 4D). Cell viability by resazurin method showed the subcultured PCECs exhibited logarithmic proliferation on the 2nd day and a peak viability value could be observed up to the 5th day. A549 cells grew in polygonal forms with a flower cluster arrangement. In model preparation activity, PCECs came to confluence at 6 days after seeding, and they were block-like and arranged compactly (Figure 4E). A549 growing in the internal surface of insert presented polygonal and closely aligned (Figure 4F). Some models, which exhibited incomplete confluence due to luminal growing, and which exhibited mechanical injury, were eliminated. The selected model had a considerable TEER value of 183.6 ± 7.4 Ω·cm2 up to the 13th day, which lasted for over 3 days (Figure 5). The LY leakage test revealed that the model had a satisfactory P value as 0.85 ± 0.19 × 10⁻³ cm/min.
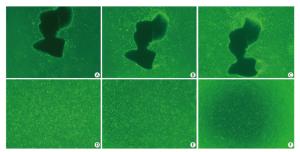
Figure 4. PCECs primary culture and cells growth in model. Spindle-shaped cells began to migrate from lung tissue edge 64 h after initial seeding (A, 40×). Two days later, cells proliferated and appeared slimly spindle-shaped (B, 40×). Cells became confluent and formed a monolayer at day 5 (C, 40×). Subcultured cells grew compactly and appeared polyangular with clear boundaries (D, 40×). PCECs (E, 100×) and A549 (F, 60×) growing on the outside and internal surface of the cell insert membrane separately.
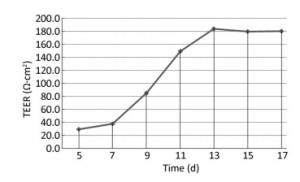
Figure 5. Trend chart of ABB model TEER. Obvious increase of TEER appeared 6 days after PCECs monolayer formed, and reached the peak at day 13.
-
The 1-hour IC-50 values of the MNPs against the A549 cells and the PCECs were obtained and compared (Table 1). The lower IC-50s of each of the test objects were selected and their sqrt were used as the exposure doses in the subsequent permeability impact experiment.
Test Samples IC-50 (95% CI) Dose Sqrt (IC-50)a A549 PCECs CuSO4 61.8 (45.1-85.2) 57.2 (37.1-87.1) 7.6 Al2(SO4)3 63.3 (35.4-116.4) 55.5 (44.9-68.4) 7.4 Zn(CH3COO)2 95.7 (69.4-145.8) 79.3 (56.3-120.0) 8.9 Pb(NO3)2 73.2 (60.5-90.0) 62.5 (50.6-77.5) 7.9 CuO-40 79.1 (48.9-179.6) 63.4 (51.3-81.2) 8.0 CuO-80 105.5 (86.0-137.3) 77.1 (62.2-100.3) 8.8 CuO-100 144.3 (108.5-220.0) 143.4 (94.7-298.4) 12.0 nano-Al2O3 (sheet) 43.7 (38.6-49.6) 34.5 (14.5-70.9) 5.9 nano-Al2O3 (short rod-shaped) 56.2 (34.2-109.3) 51.7 (43.1-62.8) 7.2 nano-ZnO 88.4 (65.0-137.3) 63.7 (53.7-77.3) 8.0 nano-PbS 51.1 (24.7-137.9) 60.1 (47.5-79.2) 7.1 HPMC > 2, 500b > 2, 500b 50.0 Note. aThe smaller one of the two IC-50 values of A549 and PCECs was adopted. bUnder 2, 500 mg/L, no obvious cell viability change was observed. Table 1. Determination of the Test Dosage (mg/L)
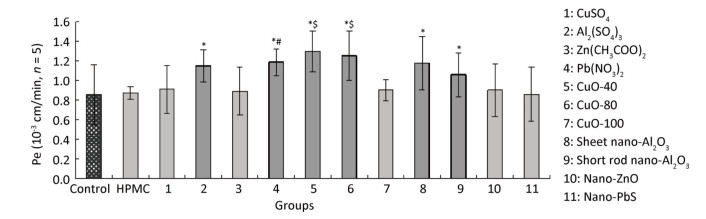
When treated with CuO-40, CuO-80, sheet and short-rod-shaped nano-Al2O3, Al2(SO4)3, and Pb(NO3)2, the P values increased to (1.30 ± 0.21) × 10-3, (1.25 ± 0.25) × 10-3, (1.18 ± 0.28) × 10-3, (1.06 ± 0.23) × 10-3, (1.15 ± 0.16) × 10-3, and (1.19 ± 0.14) × 10-3 cm/min respectively, compared with non- treatment group [(0.86 ± 0.31) × 10-3 cm/min, P < 0.05, n = 5]. The results indicated the six materials above could penetrate the ABB. The effects observed among Cu-related materials, including CuO-40, CuO-80, CuO-100, and CuSO4 were somewhat different. CuO-40 and CuO-80 exhibited similar ABB permeability effects, and both effects were stronger than the effects observed in CuO-100 and CuSO4. No difference was observed between Al2(SO4)3 and sheet and short-rod-shaped nano-Al2O3, which all increased ABB permeability. In addition, Pb(NO3)2 increased ABB permeability more than nano-PbS. Both nano-ZnO and Zn(CH3COO)2 had no influence on ABB permeability. HPMC, which was the quality control, exhibited no significant difference from the control, which indicated that the introduction of 0.5% HPMC had no adverse effect on the model. Based on all the results above, some but not all nanomaterials tested had a stronger effect on ABB permeability than their bulk chemical counterparts. We also observed that the effects of CuO-NPs were associated with the sizes. Small CuO-40 and CuO-80 displayed greater impact on ABB permeability than CuO-100. In nano-ZnO, sheet and short-rod-shaped nano-Al2O3, no differences were observed between them and their chemical counterparts in their effects on ABB permeability. In the present study, Pb(NO3)2 particularly exhibited a greater effect compared to nano-PbS (Figure 6).
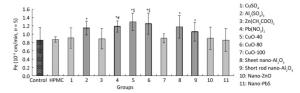
Figure 6. P values of test materials obtained during permeability experiment. Results are expressed as mean ± SD derived from 5 parallel model tests (*P < 0.05 compared to the control group (non-treatment); #P < 0.05 compared to nano-PbS group; $P < 0.05 compared to CuSO4 group).
Nanomaterials
ABB Model
Permeability Experiment
-
There is growing evidence that the MNPs may evoke undesirable side-effects, such as excessive formation of reactive oxygen species, inflammatory changes, mitochondrial toxicity, apoptosis and necrosis[25, 26]. With the extensive application of nanotechnologies in daily goods and industrial products as well as in biotechnology, it is necessary to stress the importance of reducing the potential health hazard of MNPs. Effective measures should be put in place to control the risks associated with MNPs. Toxicological datasets of MNPs provide us with first-hand information for safety assessment. Such datasets could be important to ensure that MNPs are safely exploited. However, so far there are very few comprehensive databases that support effective assessment of the risks associated with MNPs and facilitate the management of MNPs for their sustainable exploitation. Therefore, more studies are required to obtain more useful data.
The risk of pulmonary damage is increasing recently. MNPs produced as powders have been used in the various regularly used consumer goods and industrial products, including sunscreen, glass, batteries, fire retardants, rubber, light-emitting diodes produces, and solar receivers. In addition, they are also used as would care supplies and skin care products. Inhalation is considered a major route for nano-sized contaminants to enter the body from ambient environment[27]. The worn-off particles from MNPs-containing goods in daily use, the residual of MNPs in production workshop, as well as the accidental spillage could all increase the chance of MNPs entering the environment. Through breathing, ambient MNPs can be easily inhaled into the gas-exchange units (alveoli) of the lung, implying that the ABB could be the final barrier that will allow or prohibit MNPs to permeate the pulmonary tissue. The metabolism and distribution data of MNPs, which explains how MNPs influence ABB permeability and gains access to the bloodstream and tissues, is one of the major nanosafety issues.
In the present study, we compared the impacts of four MNPs, including spherical CuO-NPs (CuO-40, CuO-80, and CuO-100), sheet and short-rod-shaped nano-Al2O3, irregularly shaped nano-ZnO and nano-PbS, and their metallic compound equivalents, including CuSO4, Al2(SO4)3, Zn(CH3COO)2, and Pb(NO3)2, on ABB permeability. The aim of the study was to investigate the potential pulmonary toxicity agents among the selected agents and in turn supplement the information in existing toxicological databases. The choices of the test substances based on a need to investigate the different effects as potentially influenced by sizes (CuO-40, CuO-80, and CuO-100 involved), shape (sheet and short-rod-shaped nano-Al2O3) as well as the different forms, i.e., four MNPs and their corresponding metallic compounds. In addition to being the O2-CO2 interface of the body for transforming venous blood into oxygen-rich arterial blood, the ABB can also prevent respiratory pollutants in the alveoli from entering the bloodstream. Alveolar damage is common in pulmonary toxicity caused by pollutants[28]. ABB is a critical and early warning guard for lungs and ultimately for overall health, as it is the first to suffer from contaminants, even before the pulmonary parenchyma. Low permeability of the ABB guarantees protection. However, the ABB is hardly isolated from ubiquitous atmospheric pollution. Nanomaterials are considered to be more active than general chemicals due to their unique physicochemical properties such as small size and big specific surface area. We use MNPs-containing products in every aspect of our life, on which the chances of respiratory contact are greatly increased. MNPs entering the respiratory tract would likely interact with the ABB. When the ABB becomes permeable, the systemic circulation would be accessible to contaminants and endogenous inflammatory factors released from nearby tissues, which would be the beginning of pulmonary damage or even severe secondary target organ toxicity.
In study, we developed an in vitro ABB model to investigate the effects of the candidate samples on ABB permeability. The model was developed through the co-culture of alveolar epithelium and pulmonary microvascular capillary endothelium. A549 cells, which are generally used in pulmonary drug metabolism[29] and assessing the toxicity of xenobiotics to lungs in vitro[30, 31], were used to imitate alveolar epithelium in the present study. Primary PCECs, considering their capacity to maintain in situ characteristics such as adequate cell activity and abundant tight junction-related proteins were prepared for the model barrier development. A549 cells and PCECs in the model were seeded on the inner and outer surfaces of transparent hanging cell insert membranes separately to represent a complete alveoli-capillary unit. Compared with other models that consist solely of pulmonary epithelial cells, our model replicated the epithelium-endothelium barrier, mimicking the complete architecture of ABB. The developed model had a substantial TEER value and low LY leakage. To minimize the influence of test substances on cell activity during testing, exposure doses were the square roots of the lower IC-50 of A549 cells and PCECs. To preventing aggregation, nanomaterials were first dispersed in 0.5% HPMC solution to create a stock suspension. The suspension was diluted with DMEM/F12 medium when testing, and it displayed a positive anti-aggregation effect in subsequent tests. HPMC is a non-ionic cellulose ether that exhibits substantial thickening capacity. 0.5% HPMC was an excellent dispersant solution based on preliminary experiments and literature[18]. Permeability impact tests were carried referring to an in vitro blood-brain barrier permeability test. The P values of test samples were calculated to represent the degree of change in ABB permeability. P is content- independent and as a single comprehensive value for a series of test material transmissivity to time variable, it can more objectively reflect effects of test material on ABB. The results of the present study suggested that P is a key indicator for change in permeability. The results of the permeability experiment revealed significant increases in P values of CuO-40, CuO-80, sheet and short-rod nano-Al2O3, Al2(SO4)3 and Pb(NO3)2. The results indicated that the six materials had the potential to permeate pulmonary tissue and enter systemic circulation by adversely affecting the ABB. Reports by Rani et al. (2013)[7], Lai et al. (2018)[8], and Gosens et al. (2016)[32] indicating that CuO-NPs cause damage to animal pulmonary parenchyma and even induce fibrosis. Aluminum oxide nanorods[33], and aluminum oxyhydroxides (25 and 40 nm in size)[34] reportedly induced obvious pulmonary inflammation. Taken together with the results of the present study, studies have collectively revealed that CuO-NPs and nano-Al2O3 can affect ABB permeability and damaged pulmonary tissue. Thus, they can be categorized as substances of high concern with pulmonary toxicity potential. The pulmonary toxicity of nano-ZnO is reportedly diverse. Warheit et al. (2009) reported that nano-ZnO particles (90 nm in size) produced no significant adverse effect on pulmonary tissue after instillation or inhalation[35]. However, nano-ZnO (35 nm in size, polyhedral roughly round) showed a weak inflammatory response in another report[12], indicating its low pulmonary toxicity. In addition, there is report that ZnO-NPs (< 10 nm in size) could cause mild neutrophilic and severe eosinophilic inflammation in alveoli as well as in the peribronchial and perivascular regions[36]. In the present study, nano-ZnO did not display an obvious toxic effect on ABB permeability. The reason underlying this difference in results may be the different size, shape, type of exposure, and action time of nano-ZnO in the studies. This phenomenon also reflects the complexity of nanotoxicity identification. There is limited information regarding the pulmonary toxicity of nano-PbS; however, the respiratory tract is one of the primary routes through which nano-PbS can enter human body[37]. Thus, it is necessary to elucidate the manner by which nano-PbS permeates and affects pulmonary tissue to ensure safety. Our present study showed that nano-PbS did not affect ABB permeability. Li et al. (2013) reported that nano-PbS decreased the vitality of superoxide dismutase and total antioxidant capacity and increased malondialdehyde and lipid peroxidation products in rat pulmonary tissue [11]. Thus, the above results suggest that MNPs may cause toxicity in different ways depending on various factors, including their unique physicochemical properties and test conditions. For effective toxicity assessment, more studies are necessary to collect adequate data and to arrive at a comprehensive conclusion.
The six materials observed to influence the ABB in the present study could be considered substances of great concern. Therefore, it is necessary to adopt preventive measures to prevent them from entering the respiratory tract. Such preventive measures include wearing personal protective equipments at the workplace and keeping MNPs-containing products away from the nose and mouth during daily use. We also observed that some MNPs, including CuO-40 and CuO-80 exhibited stronger effects on ABB permeability than their metallic compound equivalents, which provided evidence for the general acknowledge that nanomaterials present more active in toxicity. However, this is not a general phenomenon. Nano-Al2O3, nano-ZnO, and nano-PbS in present study appeared no less than or even less toxicity than their chemical counterparts. The results suggest that MNP toxicity manifests in diverse and complex ways, and the evaluations of their toxicity should be on a case-by-case basis based on their physicochemical properties and defined experimental conditions. In addition, the results showed that nanoscale properties such as size also influence toxicity. The smaller-size CuO-NPs (CuO-40 and CuO-80) increased ABB permeability more significantly than the larger CuO-100. This is because CuO-40 and CuO-80 have larger surface areas than CuO-100, ultimately resulting in a larger proportion of atoms being exposed. Notably, the ionization of MNP occurs under submerged culture[38, 39]. In our previous study, CuO-NPs ionized under an in vitro culture system, which influenced cell (A549) viability to a certain extent. Therefore, metal ions that could have dissociated from the metallic nanomaterials could have influenced the permeability of the ABB in the present study. In the present study, however, we did not monitor the effects of ionization or dissociation considering time and cost constraints. Nevertheless, ionization or dissociation of metallic nanomaterials should be taken into account to clarify mechanisms of nanotoxicity. The results obtained in the present study could serve as toxicological data that could facilitate the understanding of MNP risk. In the present study, the developed ABB model performed adequately. The model could rapidly screen out the materials that influenced ABB permeability. In addition, some of the merits of the model included relative ease of preparation, material savings, and easy operation. The model could be an alternative platform for rapid screening of toxicity and hazard assessment for pollutants that are potentially toxic to the pulmonary system.
-
The author declare that there is no conflict of interest.

 Quick Links
 DownLoad: