


-
Physical activity is important for physical, psychological and cognitive health of children[1]. Systematic reviews reinforce global public health concerns that physical inactivity and sedentary behavior are associated with adiposity, cardiovascular disease, cognitive decline and social behavioral problems[2, 3]. Recent findings suggested that there might be synergistic health benefits by obtaining optimal combinations of movement behaviors (e.g. more physical activity, less sedentary behavior and high quality sleep)[4, 5]. With more than 316 million children and adolescents classified as overweight or obese globally[6], the development of strategies for increasing daily physical activity and minimizing sedentary time, and promote healthy lifestyle that will continue to adulthood is a public health priority.
Physical activity pattern is a multi-dimensional construct and represents the combined effects of the frequency, intensity, time, type and context of physical activity and sedentary behavior. Recent literature suggests that the description of physical activity should be reframed as a pattern comprising multiple domains, dimensions, or correlates[7]. For children, the nature of physical behaviors (such as short and intermittent bouts of activities), the characteristics of patterns (such as various types of activities) and their cognitive capacity (such as difficulty in performing detail) make it challenge to measure physical activity pattern[8].
Accurate physical activity measures are essential for public health research, policy making and practice[9]. A variety of devices which can record human physical activity level effectively, such as pedometers, multi-sensors, and smart watches, have been developed[10]. However, these devices provide less information on the type of activity behaviors or where and in what context the physical activity was performed, which is critical for understanding the underlying modifiable factors promoting physical activity. In addition, self-report methods might be more feasible to estimate physical activity level in large surveys due to their cost effectiveness and easy availability. Questionnaires are important in assessing the mode and domain of physical activity that are not available to be measured objectively, making physical activity pattern assessment possible[11, 12]. To maximize utility questionnaires is need to fit the needs of the country in which they are based.
Numerous physical activity questionnaires have been developed, especially for Caucasian youth, with variation in measurement protocol, physical activity dimensions assessed, recall period and other aspects[13]. A paucity of studies have applied the commonly used physical activity questionnaires into the Chinese counterparts and found that the translation of available questionnaires performed less well in Chinese youth[14, 15]. It is noticeable, reliable and validated physical activity questionnaire for use in Chinese young population is limited[16]. This is a major omission from the literature as China is currently undergoing an extensive economic development and rapid urbanization. As such, there is a growing need to develop a new questionnaire for Chinese children in assessing physical activity patterns across a whole day, providing the basis for children’s 24-hour movement measurement and its related health effect research. Understanding how it changes as a result of economic development is a research gap that urgently needs to be addressed.
The Chinese Children Physical Activity Questionnaire (CCPAQ) was designed to address the full complements of physical activity pattern across 24-hour period and provide the estimation of physical activity energy expenditure in Chinese children. The aims of the current study were to report on the development of the CCPAQ and to evaluate its validity as well as the test-re-test reliability in children aged 10-17 years.
-
The CCPAQ was developed in five stages: 1) review of the literature to identify key elements of self-report measures; 2) assessment of reliability and validity study of the existing questionnaires; 3) designing the questionnaire format, content and flow; 4) consulting the experts of epidemiology, physical activity and other related fields and then revising the questionnaire; and 5) pilot testing.
The CCPAQ is a 7-day recall physical activity questionnaire for children to collect the information on physical activity pattern comprising of 23 questions (Additional file ‘CCPAQ Guide’ are available from the author on request). It uses a time-based structure which has been used in other surveys, such as Physical Activity Questionnaire for Older Children (PAQ-C)[17] and a checklist of responses that is comparable to Self-Administered Physical Activity Checklist (SAPAC)[18]. In CCPAQ, the activities across whole days, including weekday and weekend day, in the past week are asked to recall sequentially. The codes table of children’s physical activity types, which was a list of 32 activity codes in 3 categories, was developed based on Chinese children’s activity. Physical activity pattern was evaluated by asking the students to select the kind of activities from the codes table, report the intensity of the physical activity according to the revised Rate of Perceived Exertion Scale for Exercise[19], and to best approximate the frequency and the amount of time spent in that activity last week. The energy expenditure of each activity was then estimated based on the latest Youth Compendium of Physical Activity (Activity Codes and Metabolic Intensity, 2017)[20]. Finally, the number of days per week that the students engaged in moderate-to-vigorous physical activity (MVPA) accumulated for at least 60 min a day was asked. The CCPAQ takes on average 12-15 min to complete.
-
Physical activity was assessed using ActiGraph wGT3X-BT accelerometer (ActiGraph, LLC, Pensacola, Florida, USA) as criterion method on the basis of its established reliability and accuracy[21]. For this study, the accelerometer was set to record data at a sampling rate of 30 Hertz. ActiGraph files were downloaded and then transformed into 10 s epoch files in the commercial software (Acti life 13.3), using standard procedures for identifying non-wear time and interpolating gaps with missing data. The sleeping time of each individual was marked as non-wear time. The minimum wear-time for inclusion in the analysis was at least 8 h per day for at least 5 days (including at least 3 weekdays and 1 weekend days). The reason was that the monitoring for 8 h in 4-5 days and 8 h daily of monitoring have shown reliable activity data in a week[22].
The intensity of physical activity was defined using the cut points derived by Vanhelst et al. (2011)[23], with sedentary behavior below 400 counts/min, light physical activity (LPA) between 401 and 1,900 counts/min, moderate physical activity (MPA) between 1,901 and 3,918 counts/min, vigorous physical activity (VPA) greater than 3,919 counts/min. The threshold of Vanhelst et al. was chosen for this study as it has shown good classification accuracy in Chinese children[24]. In addition, accelerometer-measured energy expenditure was calculated using the equation of Freedson VM3 Combination (2011)[25].
-
In the spring and summer of 2018, a total of 120 children in grade 4, 7, 10 in two schools (one elementary school and one middle school) in two districts (Yanqing of Beijing in northern China and Wanzhou of Chongqing in southern China) were recruited by Center for Disease Control and Prevention. The children who were taking medications or had medical illness affecting growth, injured or had other conditions limiting participation in physical activity, or had problems reducing adherence to the study protocol were excluded from the study.
Participants were recruited after a brief presentation and instruction in a parents meeting, in which written and oral information were provided for the parents of all interested individuals. Written informed parental consent was obtained for all participants. The design of the study was according to the Helsinki Declaration and approved by National Institute of Nutrition and Health, Chinese Center for Disease Control and Prevention (Ethic committee approval code: 2013-018).
-
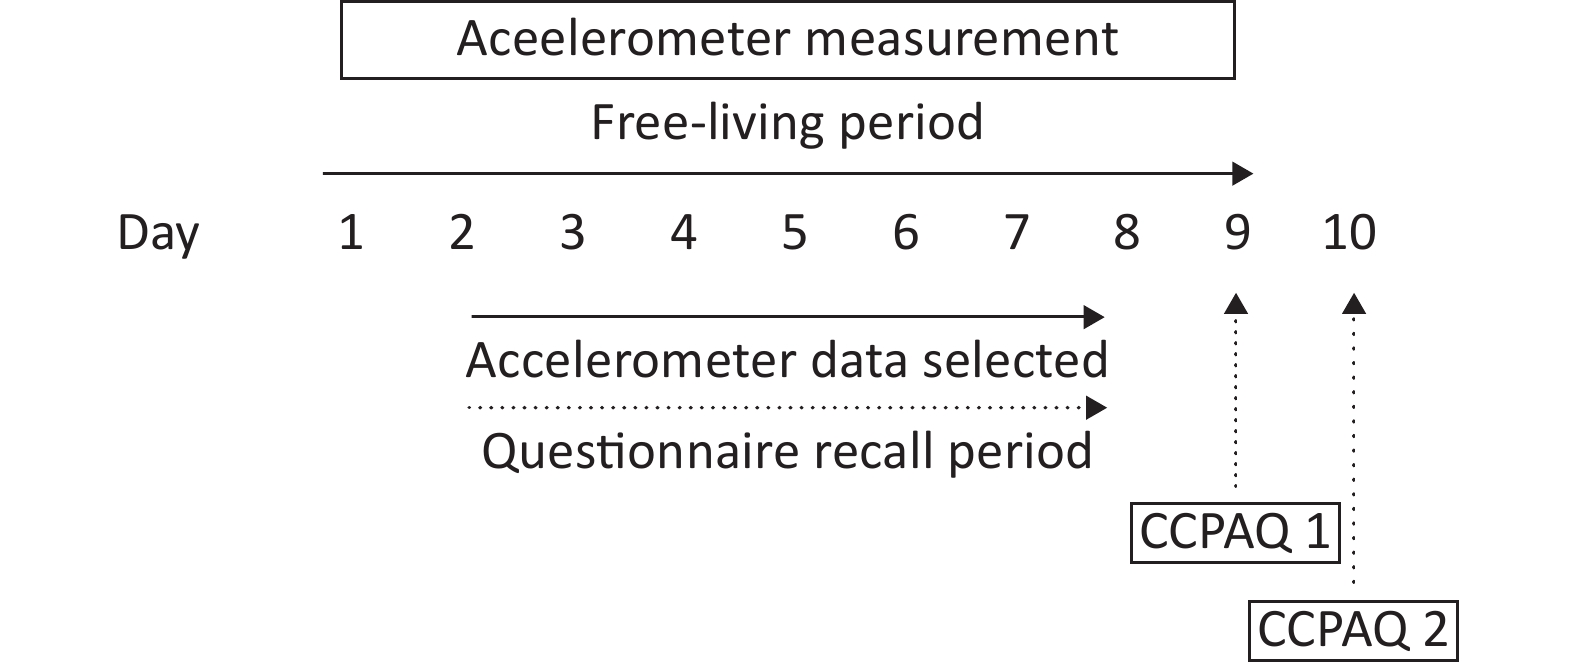
Participants’ involvement was over 10 days as shown in Figure 1. Participants were asked to wear an ActiGraph accelerometer for 7 consecutive days in May in 2018. The participants received the accelerometer at the first visit and were required to engage in their normal activities. Participants were instructed to wear the accelerometer on the right side of the body at hip level. The wear time of the accelerometer was 24 h for 7 days. In the monitoring, investigators contacted the participants’ parents by phone to remind of wearing and checking on compliance with the accelerometer, and answer any questions about the study. Participants were advised to only remove the monitor for swimming or bathing and record non-wear time and reasons for removal. At the end of the 7-day monitoring, the participants returned the accelerometer to school. Meantime, the CCPAQ for the first time (CCPAQ 1) was administrated in the face-to-face interviews by trained observers during a class. One day later, the participants were asked to complete the CCPAQ for the second time (CCPAQ 2) at schools with data collected by the same interviewers. Anthropometric measures, including body height and weight measured by using an electronic stadiometer (Hochoice, EF07), were collected from all the participants. The COnsensus-based Standards for the selection of health Measurement Instruments (COSMIN) Checklist was used as a guidance for the design of CCPAQ and the implementation of this study[26].

Figure 1. Timeline of the study protocol. CCPAQ 1 = the first-time administration of Chinese Children Physical Activity Questionnaire; CCPAQ 2 = the second-time administration of Chinese Children Physical Activity Questionnaire.
-
Descriptive analyses included calculating the median and standard deviation, quartiles or percentages for all variables. Univariate ANOVA procedures or χ2 test were used to examine differences in the characteristics of the sample. The physical activity variables for the evaluation of reliability and validity of the CCPAQ were total time spent on physical activity, sedentary behavior, and on two intensities levels namely MVPA and LPA, as well as energy expenditure. Statistical analyses were performed with SAS 9.4 (SAS Institute Inc., Cary, NC, USA).
Reliability Analyses To examine the reliability, the single measure, parametric interclass correlation coefficients (ICC) with 95% confidence intervals (CI) were calculated to evaluate the extent of CCPAQ in the test-retest analysis. ICC ≥ 0.70 was indicative of acceptable reliability[27].
Validity Analyses The validity analysis involves two types of measurement properties in this study: content validity and construct validity. The content validity of the CCPAQ was assessed by consulting experts in the fields of sport, nutrition and related areas. For construct validity, non-parametric Spearman’s rank correlation coefficient (rho) was used to examine the correlations between minutes per day in each intensity level and physical activity energy expenditure as kilocalorie per day from the CCPAQ data and similar data from the accelerometer. The answers from CCPAQ 1 were used in the validity analyses. Based on the COSMIN Checklist, rho ≥ 0.50 indicates that the validity is acceptable. The Bland and Altman method was used to provide an indication of the heteroscedasticity and the systematic random error of the data with 95% limits of agreement (mean difference ± 1.96 standard deviation) between the CCPAQ and the accelerometer. The variables used for the Bland and Altman analysis were physical activity energy expenditure, time spent on total physical activity, MVPA and sedentary behavior.
Sensitivity Analyses We recognize that there is debate in the field of accelerometer-measured physical activity on which intensity threshold should be used[28]. To test the robustness of different cut-points of physical activity intensity for validity study, we made a number of sensitivity analyses repeating the main analyses based on other 3 different intensity thresholds (cut-off of Evenson et al.[29], cut-off of Puyan et al.[30], cut-off of Freedson et al.[31]). Cut-off of Evenson et al. (2008) has been widely used in Western country. Cut-off of Puyan et al. (2002) is one of the highest intensity thresholds of physical activity, while Freedson et al. (1998) has a low intensity threshold for MVPA. As these three thresholds were conducted with Western samples it is unclear whether they would be applicable for Chinese children.
-
A total of 120 participants were enrolled in the study. Finally 119 participants (99%) were included in the reliability analysis and 106 participants (88%) were included in the analysis of criterion validity (see ‘Flow diagram’ in Supplementary Figure S1, available in www.besjournal.com). Characteristics of the participants in reliability study and validity study stratified by sex are shown in Table 1. Boys spent more time in MVPA per day and had more physical activity energy expenditure than girls. Physical activity energy expenditure and daily time spent on total physical activity, MVPA and sedentary behaviors were longer on weekday than on weekend day (see Supplementary Table S1, available in www.besjournal.com).
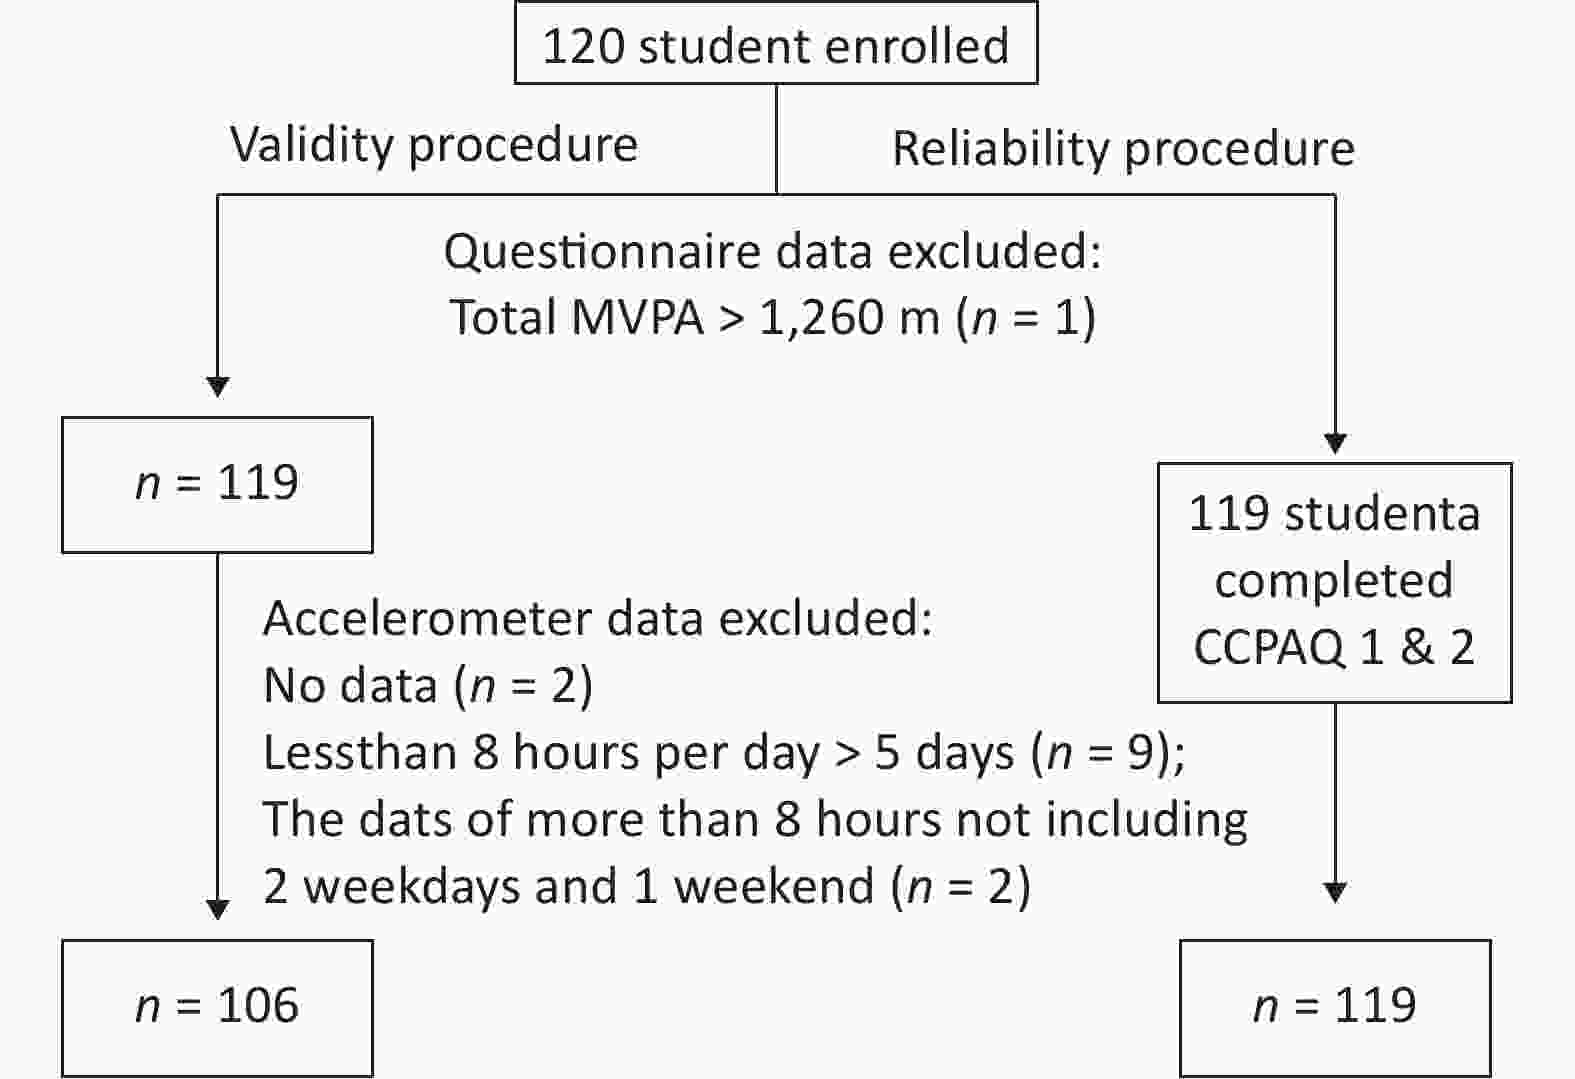
Figure S1. Flow diagram outlining the number of included and excluded. CCPAQ 1&2, the first-time and the second-time administration of Chinese Children Physical Activity Questionnaire.
Characteristics Reliability study Validity study Total Boys Girls P Total Boys Girls P Sample number 119/120 enrolled 56 (47%) 63 (53%) 106/120 enrolled 53 (50%) 53 (50%) Age (years)a 13.1 ± 2.4 13.3 ± 2.5 13.0 ± 2.4 0.590 13.1 ± 2.5 13.3 ± 2.5 12.8 ± 2.4 0.279 Height (m)a 1.6 ± 0.1 1.6 ± 0.2 1.5 ± 0.1 < 0.001 1.6 ± 0.1 1.6 ± 0.2 1.5 ± 0.1 < 0.001 Weight (kg)a 50.2 ± 16.4 55.7 ± 19.0 45.4 ± 11.9 0.001 50.1 ± 16.9 56.0 ± 19.2 44.2 ± 11.5 < 0.001 BMI (kg/m2)a 20.1 ± 4.2 21.0 ± 5.1 19.3 ± 3.1 0.036 20.1 ± 4.4 21.1 ± 5.2 19.2 ± 3.2 0.023 Ethnicity, n(%)b Majority 109 (91.6%) 52 (92.9%) 57 (90.5%) 0.448 98 (92.5%) 50 (94.3%) 48 (90.6%) 0.358 Minority 10 (8.4%) 4 (7.1%) 6 (9.5%) 8 (7.5%) 3 (5.7%) 5 (9.4%) Note. BMI, body mass index. aDescripted as Mean ± SD because of the normal distribution. bDescripted as absolute number (percentage) because of categorical data. Table 1. Participant characteristics by sex
Total (n = 106) Pa Boys (n =52) Girls (n = 54) Pb PAEE (kcal/day) Week 354.9 (251.5, 448.9) < 0.001 411.9 (339.7, 576.6) 294.9 (219.1, 364.2) 0.001 Weekday 367.2 (267.5, 490.0) 446.0 (347.6, 558.4) 294.0 (216.3, 384.2) < 0.001 Weekend day 286.1 (194.6, 406.0) 345.1 (257.1, 475.2) 250.3 (168.4, 349.3) < 0.001 Total PA (min/day) Week 143.6 (110.5, 177.5) < 0.001 143.3 (114.5, 196.2) 143.9 (108.2, 175.8) 0.271 Weekday 143.5 (117.6, 187.1) 152.5 (116.0, 204.6) 138.4 (118.9, 182.3) 0.085 Weekend day 130.1 (82.8, 184.0) 125.6 (75.3, 189.4) 133.5 (86.9, 170.8) 0.538 MVPA (min/day) Week 57.6 (43.7, 67.0) < 0.001 59.0 (46.8, 67.9) 56.1 (41.9, 65.0) 0.103 Weekday 58.9 (48.7, 71.8) 60.0 (53.1, 72.2) 56.3 (44.4, 69.7) 0.008 Weekend day 45.9 (26.9, 62.0) 46.8 (23.2, 66.1) 45.3 (28.1, 57.8) 0.253 LPA (min/day) Week 89.8 (61.6, 118.6) 0.214 89.1 (63.9, 124.7) 91.2 (59.9, 116.0) 0.464 Weekday 90.0 (63.7, 120.8) 91.6 (66.0, 124.2) 90.0 (60.3, 119.5) 0.308 Weekend day 85.2 (51.2, 117.8) 82.0 (51.5, 124.2) 91.6 (51.2, 117.8) 0.795 Sedentary behavior (min/day) Week 594.4 (463.0, 672.9) < 0.001 607.9 (401.9, 680.1) 562.8 (472.9, 674.0) 0.943 Weekday 634.2 (512.5, 740.0) 648.5 (485.1, 764.8) 617.7 (527.8, 735.2) 0.506 Weekend day 541.8 (371.3, 643.0) 562.7 (302.9, 659.3) 509.0 (382.6, 619.7) 0.709 Numbers of achieving PA guidelines 16 (15%) − 4 (8%) 12 (24%) 0.056 Number of days spent time in MVPA ≥ 60 min (day) 4.0 ± 2.1 − 3.6 ± 1.9 4.4 ± 2.1 0.038 Note. PA, Physical Activity; PAEE, Physical Activity Energy Expenditure; MVPA, oderate-to-Vigorous Physical Activity; LPA, Light Physical Activity. Data were described as Median (25th percentile, 75th percentile). aThis is the P value for difference between weekday and weekend day. bThis is the P value for sex differences. Table S1. Accelerometer-measured physical activity and energy expenditure
-
Reliability coefficient for time spent on total physical activity, MVPA, sedentary behavior and sleeping ranged from 0.7 to 0.9, while the reliability coefficient for LPA and screen time was slightly lower (0.4 to 0.7) (Table 2). Overall, the reliability coefficient was higher for physical behavior variables on weekday than on weekend day. Similarly, the reproducibility seemed to be higher for variables on boys than girls. The reliability coefficient for types of physical activity ranged from 0.57 to 0.88 (Table 3).
Physical Activity Variables Median (25th Percentile,
75th Percentile)Total (n = 119) Boys (n = 56) Girls (n = 63) CCPAQ 1 CCPAQ 2 ICC (95% CI) P ICC (95% CI) P ICC (95% CI) P PAEE (kcal/day) Week 598.5
(427.6, 799.7)534.6
(377.7, 814.7)0.93
(0.89, 0.95)< 0.001 0.93
(0.88, 0.96)< 0.001 0.90
(0.85, 0.94)< 0.001 Weekday 681.2
(463.2, 887.7)590.0
(447.0, 912.5)0.91
(0.87, 0.93)< 0.001 0.90
(0.83, 0.94)< 0.001 0.91
(0.85, 0.94)< 0.001 Weekend day 396.3
(220.2, 627.2)332.7
(192.2, 558.1)0.82
(0.74, 0.88)< 0.001 0.89
(0.81, 0.93)< 0.001 0.70
(0.53, 0.81)< 0.001 Total PA (min/day) Week 63.0
(42.5, 90.7)66.4
(43.4, 94.4)0.82
(0.74, 0.87)< 0.001 0.85
(0.76, 0.91)< 0.001 0.76
(0.64, 0.85)< 0.001 Weekday 69.4
(47.7, 98.0)72.1
(46.5, 100.8)0.80
(0.73, 0.86)< 0.001 0.85
(0.76, 0.91)< 0.001 0.72
(0.57, 0.82)< 0.001 Weekend day 40.3
(17.3, 90.0)42.5
(18.8, 80.0)0.70
(0.60, 0.78)< 0.001 0.64
(0.46, 0.77)< 0.001 0.77
(0.64, 0.85)< 0.001 MVPA (min/day) Week 27.5
(11.6, 54.4)28.2
(10.7, 50.0)0.79
(0.71, 0.85)< 0.001 0.85
(0.76, 0.91)< 0.001 0.70
(0.55, 0.81)< 0.001 Weekday 30.8
(14.3, 56.9)29.0
(12.0, 53.8)0.73
(0.63, 0.80)< 0.001 0.83
(0.72, 0.90)< 0.001 0.58
(0.38, 0.72)< 0.001 Weekend day 6.75
(0, 46.3)5.5
(0, 59.0)0.79
(0.71, 0.85)< 0.001 0.75
(0.61, 0.85)< 0.001 0.85
(0.76, 0.91)< 0.001 LPA (min/day) Week 29.6
(18.1, 49.1)31.4
(17.6, 51.8)0.63
(0.51, 0.73)< 0.001 0.57
(0.37, 073)< 0.001 0.69
(0.54, 0.80)< 0.001 Weekday 33.7
(18.8, 55.2)37.5
(17.1, 60.0)0.64
(0.52, 0.73)< 0.001 0.62
(0.43, 0.76)< 0.001 0.65
(0.48, 0.77)< 0.001 Weekend day 15.3
(5.0, 35.0)18.0
(5.0, 37.0)0.43
(0.27, 0.56)< 0.001 0.55
(0.35, 0.70)0.041 0.55
(0.35, 0.70)< 0.001 Sedentary behavior (min/day) Week 414.3
(312.1, 519.6)390.0
(289.6, 472.9)0.83
(0.77, 0.88)< 0.001 0.91
(0.85, 0.95)< 0.001 0.78
(0.66, 0.86)< 0.001 Weekday 467.0
(355.0, 552.0)443.0
(345.0, 526.0)0.85
(0.79, 0.89)< 0.001 0.88
(0.80, 0.93)< 0.001 0.83
(0.74, 0.90)< 0.001 Weekend day 270.0
(150.0, 405.0)251.3
(133.8, 337.5)0.52
(0.37, 0.64)< 0.001 0.80
(0.69, 0.88)< 0.001 0.40
(0.18, 0.59)< 0.001 Screen time (min/day) Week 32.1
(13.5, 68.6)25.7
(10.0, 57.1)0.65
(0.53, 0.74)< 0.001 0.78
(0.66, 0.87)< 0.001 0.56
(0.37, 0.71)< 0.001 Weekday 10.0
(0, 36.0)8.5
(0, 30.0)0.69
(0.58, 0.77)< 0.001 0.69
(0.53, 0.84)< 0.001 0.68
(0.52, 0.80)< 0.001 Weekend day 75.0
(30.0, 120.0)60.0
(22.5, 120)0.47
(0.32, 0.60)< 0.001 0.74
(0.60, 0.84)< 0.001 0.27
(0.30, 0.48)0.016 Sleeping time (min/day) Week 520.0
(460.0, 570.0)513.8
(467.5, 570.0)0.86
(0.81, 0.90)< 0.001 0.94
(0.91, 0.97)< 0.001 0.80
(0.68, 0.87)< 0.001 Weekday 480.0
(410.0, 540.0)480.0
(405.0, 540.0)0.89
(0.85, 0.92)< 0.001 0.91
(0.86, 0.95)< 0.001 0.87
(0.79, 0.92)< 0.001 Weekend day 560.0
(480.0, 600.0)570.0
(480.0, 630.0)0.70
(0.59, 0.77)< 0.001 0.88
(0.81, 0.93)< 0.001 0.57
(0.37, 0.71)< 0.001 Number of days spent time in MVPA ≥ 60 min 1.8 ± 1.8 1.6 ± 1.7 0.86
(0.80, 0.90)< 0.001 0.84
(0.73, 0.90)0.89
(0.83, 0.94)< 0.001 Note. CCPAQ, Chinese children’s physical activity questionnaire; CCPAQ 1, the first-time CCPAQ questionnaire investigation; CCPAQ 2, the second-time CCPAQ questionnaire investigation; ICC, intraclass correlation coefficients; PA, physical activity; PAEE, physical activity energy expenditure; MVPA, moderate-to-vigorous physical activity; LPA, light physical activity. Table 2. Test-retest reliability of CCPAQ stratified by sex with the use of intraclass correlation coefficient
Physical activity variables Total (n = 119) Boys (n = 56) Girls (n = 63) Median (25th percentile,
75th percentile)ICC (95% CI) P Median (25th percentile,
75th percentile)ICC (95% CI) P Median (25th percentile,
75th percentile)ICC (95% CI) P CCPAQ 1 CCPAQ 2 CCPAQ 1 CCPAQ 2 CCPAQ 1 CCPAQ 2 Transportation PAEE 38.3
(4.3, 86.7)40.5
(6.6, 96.3)0.73
(0.63, 0.80)< 0.001 41.2
(3.9, 97.5)40.9
(0.0, 142.4)0.70
(0.54, 0.81)< 0.001 33.7
(4.3, 79.1)33.8
(8.6, 81.1)0.79
(0.68, 0.87)< 0.001 TPA 20.0
(9.2, 33.8)23.6
(11.4, 35.7)0.65
(0.54, 0.75)< 0.001 21.1
(10.0, 35.4)26.8
(14.3, 35.7)0.57
(0.36, 0.72)< 0.001 20.0
(8.6, 31.5)21.4
(10.7, 34.6)0.70
(0.55, 0.81)< 0.001 Activity in School PAEE 90.5
(51.2, 162.9)79.3
(44.8, 167.1)0.84
(0.78, 0.89)< 0.001 106.8
(62.2, 183.8)87.8
(50.2, 193.6)0.82
(0.71, 0.89)< 0.001 83.7
(40.0, 155.6)77.9
(37.6, 122.1)0.86
(0.77, 0.91)< 0.001 TPA 23.9
(13.6, 36.6)24.6
(11.9, 35.9)0.86
(0.80, 0.90)< 0.001 24.9
(13.4, 36.5)24.8
(11.4, 38.5)0.88
(0.81, 0.93)< 0.001 23.0
(13.6, 37.1)23.7
(12.4, 35.2)0.80
(0.69, 0.87)< 0.001 Sports/exercise outside school PAEE 28.9
(0.0, 93.5)13.2
(0.0, 71.5)0.75
(0.66, 0.82)< 0.001 49.0
(0.0, 142.4)32.1
(0.0, 99.9)0.80
(0.68, 0.88)< 0.001 15.2
(0.0, 51.9)7.4
(0.0, 37.6)0.61
(0.43, 0.74)< 0.001 TPA 9.6
(0.0, 28.6)7.1
(0.0, 23.0)0.73
(0.63, 0.80)< 0.001 16.1
(0.2, 35.7)10.0
(0.0, 28.3)0.76
(0.63, 0.85)< 0.001 6.0
(0.0, 22.5)4.3
(0.0, 17.7)0.70
(0.55, 0.81)< 0.001 Household PAEE 3.0
(0.0, 11.0)3.0
(0.0, 10.9)0.70
(0.60, 0.78)< 0.001 5.3
(0.0, 16.2)5.4
(0.0, 19.4)0.70
(0.53, 0.81)< 0.001 1.7
(0.0, 9.1)2.0
(0.0, 7.0)0.68
(0.52, 0.79)< 0.001 TPA 2.9
(0.0, 7.1)2.9
(0.0, 8.6)0.84
(0.77, 0.88)< 0.001 3.2
(0.4, 7.1)3.2
(0.89, 8.6)0.86
(0.78, 0.92)< 0.001 2.9
(0.0, 7.5)2.9
(0.0, 8.6)0.80
(0.69, 0.88)< 0.001 Note. CCPAQ, Chinese Children’s Physical Activity Questionnaire; CCPAQ 1, the first-time CCPAQ questionnaire investigation; CCPAQ 2, the second-time CCPAQ questionnaire investigation; ICC, Intraclass Correlation Coefficients; CI, Confidence Interval; TPA, Total physical activity (Unit: minutes/day); PAEE, physical activity energy expenditure (Unit: kcal/day). Table 3. Test-retest reliability of different types of physical activity by CCPAQ with the use of intraclass correlation coefficients
-
Content Validity The CCPAQ exhibits content validity as it provides information on the natural and intuitive of physical activity pattern, especially different intensity and types of physical activities as well as sedentary behaviors and sleep time across a whole day in the past week. Furthermore, the CCPAQ is capable of investigating other subset of activity, such as screen-based activities, activities in school, out of school, in household and in transportation.
Criterion Validity Physical activity energy expenditure displayed moderate validity on a week (rho = 0.58, P < 0.001) or on weekday (rho = 0.57, P < 0.001). Correlations between the CCPAQ and the accelerometer tended to be higher for total time spent on physical activity and sedentary behaviors compared with correlations for MVPA and LPA. Correlations were stronger for boys than for girls, except daily time spent on MVPA and sedentary behavior during weekend. Mean differences for time spent on all activity variables were negative which means CCPAQ values on average were lower than accelerometer-measured values. There was no correlation between the two methods for the average days in which at least 60 minutes of MVPA were accumulated in each day last week (Table 4).
Physical activity variables Spearman’s Correlation Coefficient (P value) Comparison between two measures Total (n = 106) Boys (n = 53) Girls (n = 53) Mean ± SD No. over No. under No. same PA energy expenditure (kcal/day) Week 0.58 (< 0.001) 0.57 (< 0.001) 0.55 (< 0.001) 226.8 ± 254.8 82 23 1 Weekday 0.57 (< 0.001) 0.58 (< 0.001) 0.45 (< 0.001) 315.3 ± 303.2 96 10 0 Weekend day 0.12 (0.217) 0.08 (0.601) 0.10 (0.504) 139.3 ± 396.1 65 41 0 Total PA (min/day) Week 0.32 (< 0.001) 0.39 (0.004) 0.27 (0.047) −78.0 ± 58.1 10 96 0 Weekday 0.34 (< 0.001) 0.38 (0.005) 0.29 (0.031) −71.7 ± 56.9 13 93 0 Weekend day 0.22 (0.021) 0.22 (0.116) 0.22 (0.107) −79.2 ± 81.5 15 91 0 MVPA (min/day) Week 0.20 (0.040) 0.24 (0.085) 0.14 (0.330) −19.4 ± 36.4 26 80 0 Weekday 0.26 (0.007) 0.28 (0.046) 0.24 (0.079) −18.2 ± 36.3 25 78 3 Weekend day 0.23 (0.017) 0.09 (0.521) 0.34 (0.011) −17.6 ± 45.7 26 79 1 LPA (min/day) Week 0.19 (0.054) 0.28 (0.045) 0.10 (0.469) −58.6 ± 43.9 8 98 0 Weekday 0.22 (0.021) 0.28 (0.047) 0.18 (0.200) −53.5 ± 43.9 10 94 2 Weekend day −0.08 (0.423) 0.09 (0.503) −0.23 (0.100) −61.7 ± 63.6 12 93 1 Sedentary behavior (min/day) Week 0.32 (< 0.001) 0.26 (0.060) 0.39 (0.003) −127.7 ± 213.3 24 82 0 Weekday 0.32 (0.001) 0.35 (0.011) 0.30 (0.030) −120.6 ± 248.5 23 83 0 Weekend day 0.33 (< 0.001) 0.30 (0.030) 0.35 (0.009) −154.9 ± 331.2 25 81 0 Number of days spent time in MVPA ≥ 60 min −0.15 (0.130) −0.29 (0.041) −0.04 (0.789) −2.8 ± 2.9 18 78 10 Note. CCPAQ, Chinese children’s physical activity questionnaire; PA, physical activity; MVPA, moderate-to-vigorous physical activity; LPA = light physical activity. Mean ± SD: Mean difference between the CCPAQ and the accelerometer ± Standard deviation of mean difference. No. over: number of participants that over-estimated; No. under: number of participants that under-estimated; No. same: number of participants that reported the same as the accelerometer-measured values. Table 4. Validity coefficients for movement behaviors and energy expenditure comparing CCPAQ and accelerometer measurement
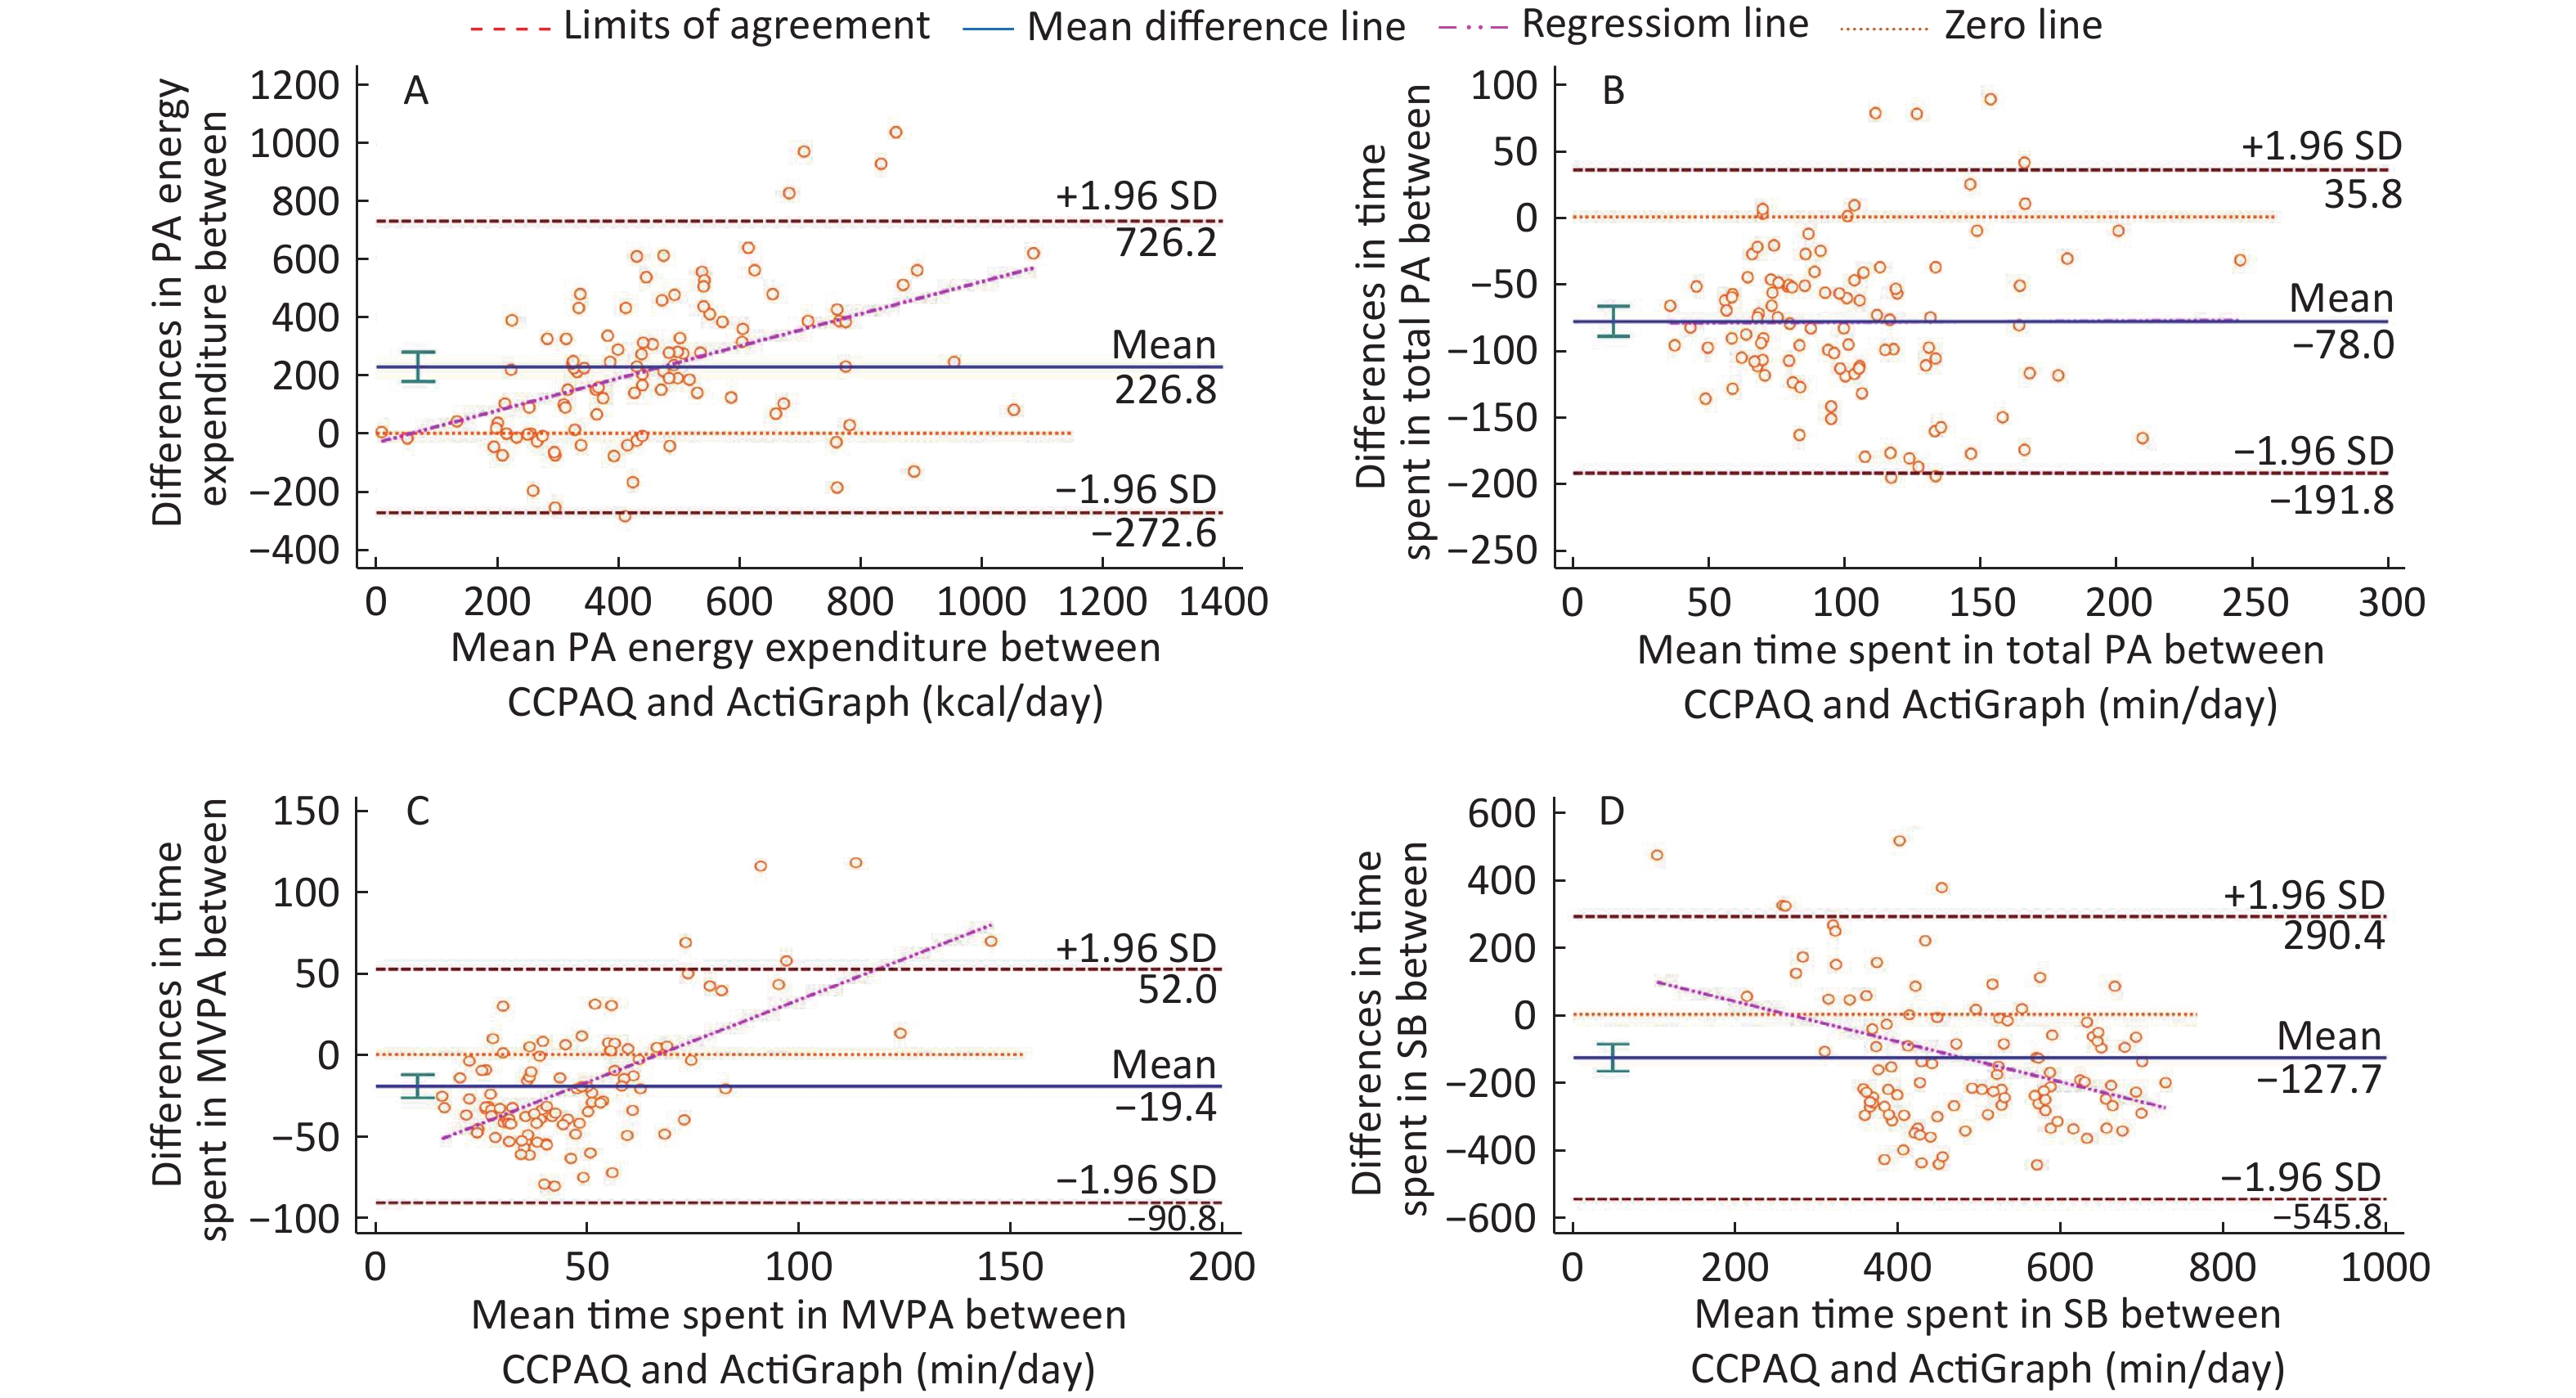
Bland-Altman plots showed the degree of error in CCPAQ depended on the level of physical activity energy expenditure, MVPA or sedentary behaviors (Figure 2). Higher level of energy expenditure and MVPA were more likely to be overestimated and the difference between both methods was more obvious, whereas more time spent on sedentary behaviors was more likely to be underestimated and the difference between both methods was less obvious.
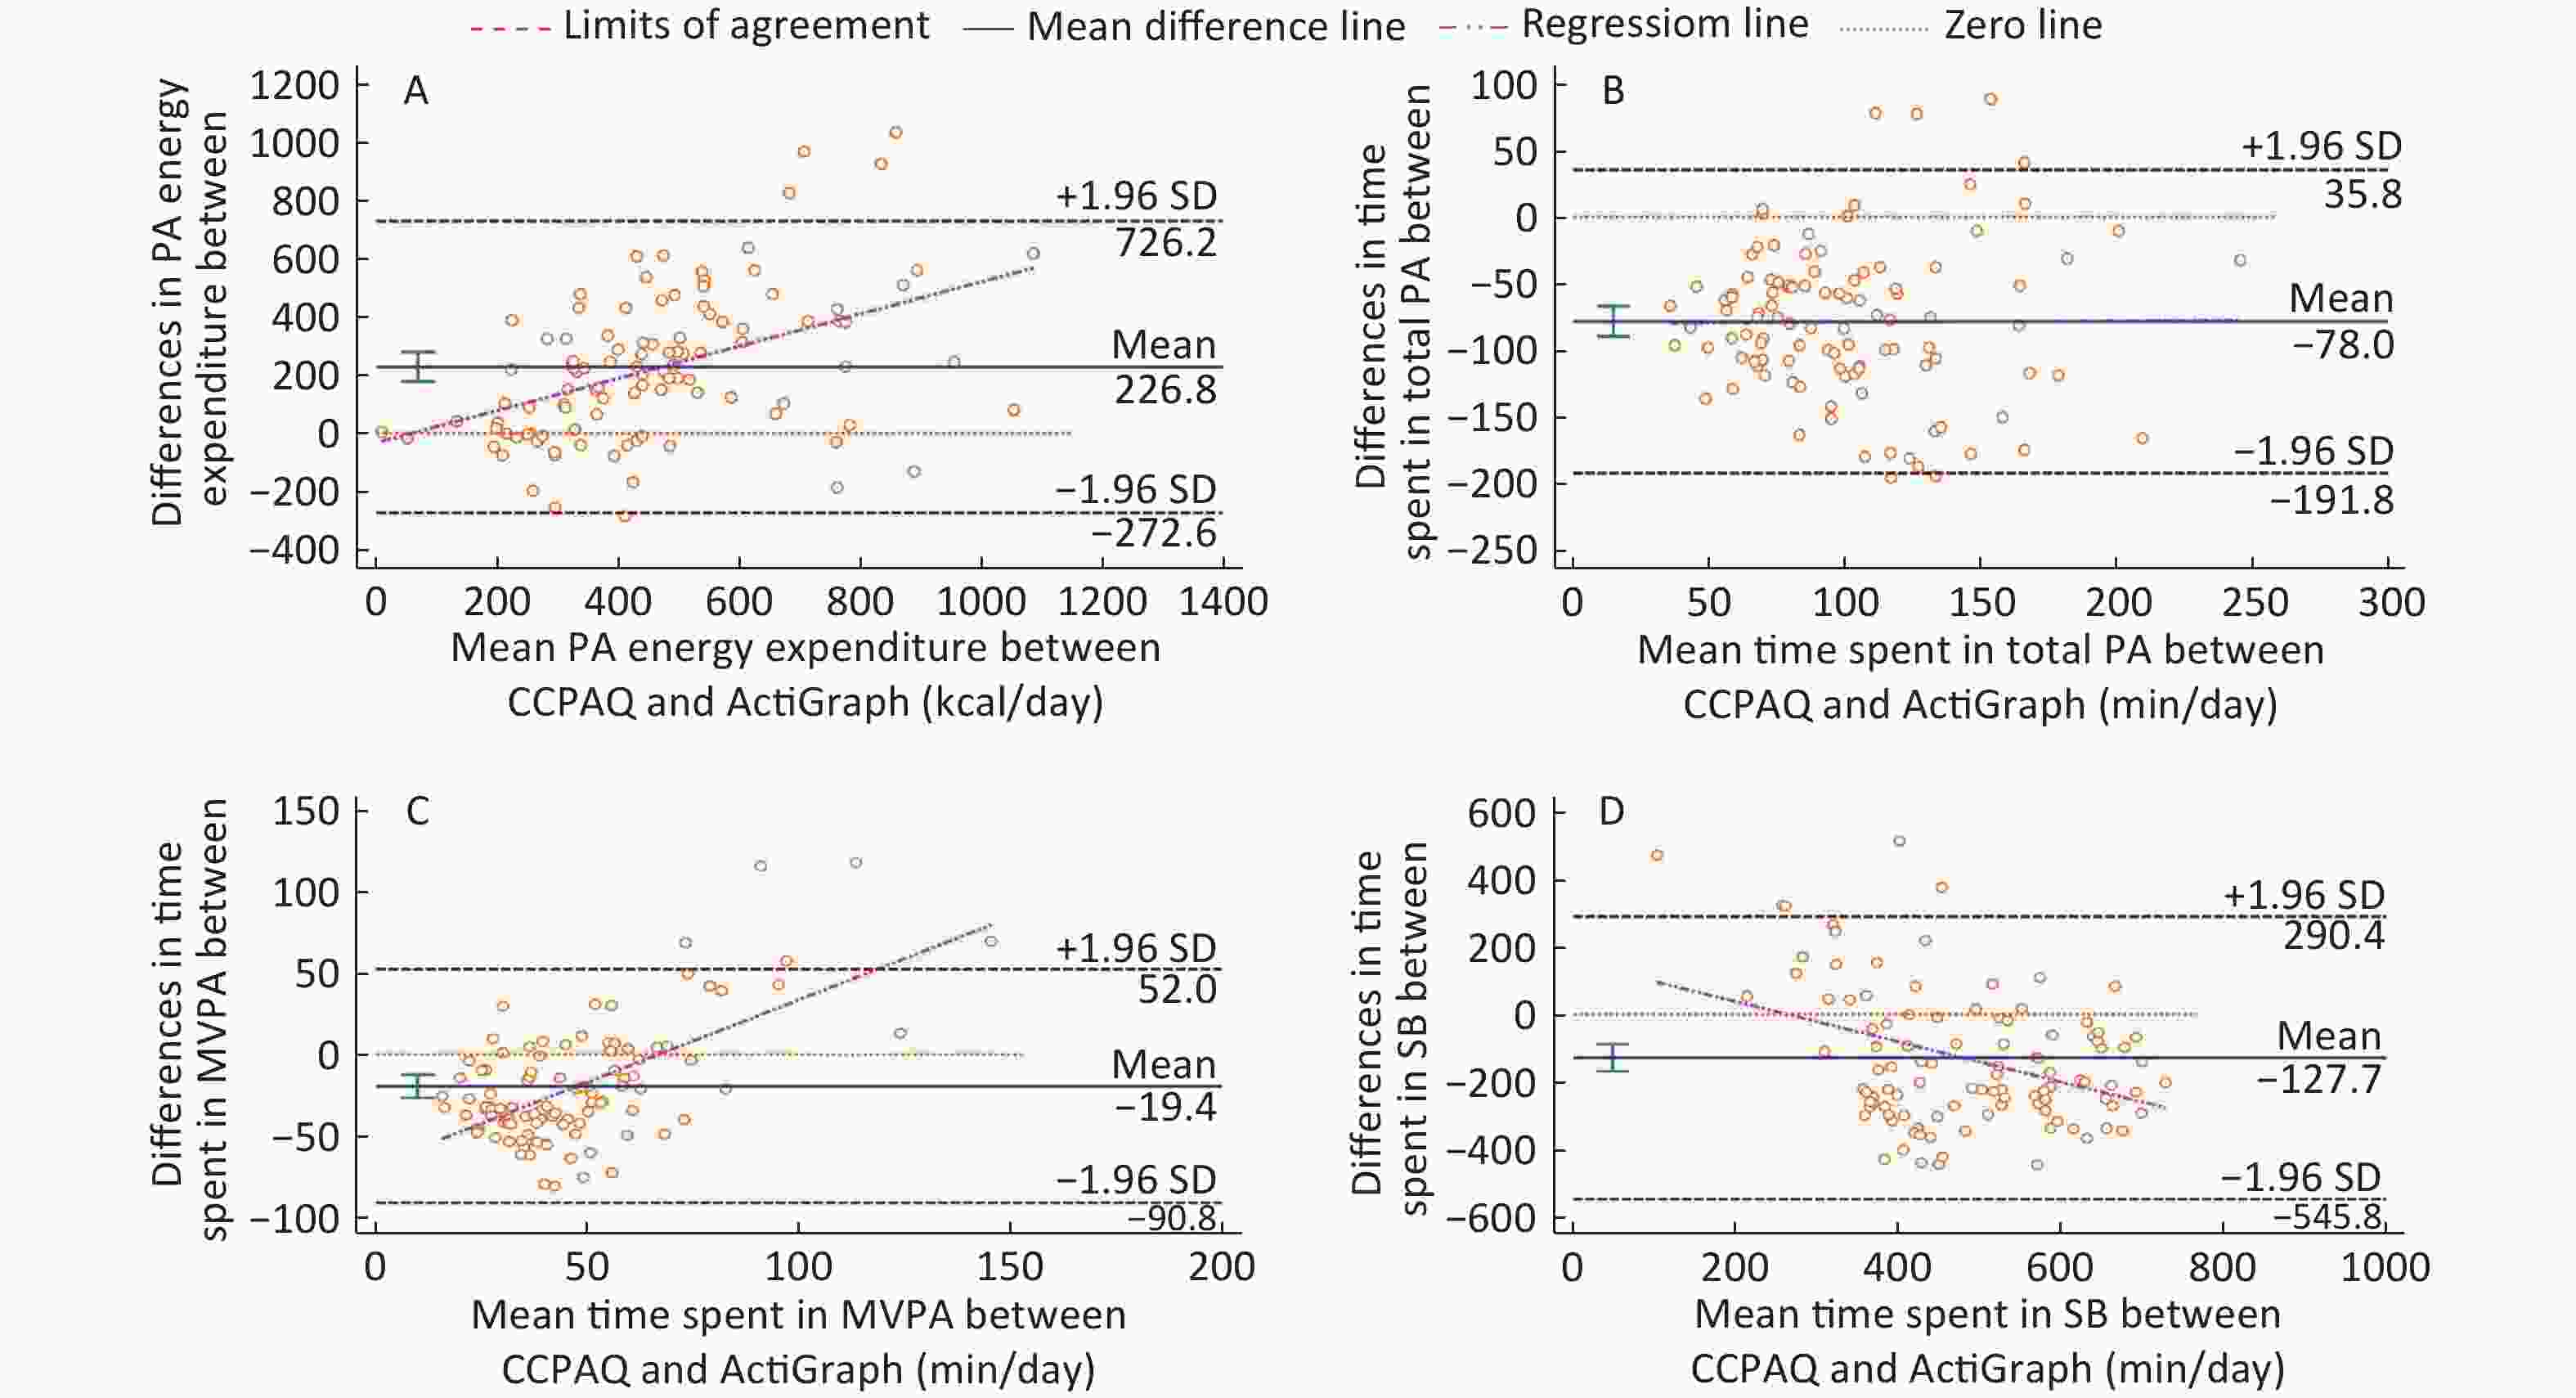
Figure 2. Bland and Altman plots in physical activity energy expenditure (A), total PA (B), MVPA (C), and SB (D). CCPAQ, Chinese children’s physical activity questionnaire; PA, Physical Activity; MVPA, moderate-to-vigorous physical activity; SB, sedentary behaviors.
-
Using the cut-off of Evenson et al., similar validity correlations of physical activity variables between the CCPAQ and the accelerometer were found. Accelerometer data were re-categorized using 0-799 counts as the threshold for sedentary behavior in the cut-off of Puyan et al., and then the correlation was only 0.14 and insignificant (P = 0.163). Using the cut-off of Freedson et al., lower than that of Vanhelst et al., there are no significant correlations in any physical activity variables (Table 5).
Intensities of PA Vanhelst et al.[23], 2011 Evenson et al.[29], 2008 Puyan et al.[30], 2002 Freedson et al.[31], 1998 Cut-points rho P Cut-points rho P Cut-points rho P Cut-points rho P Total activity ≥ 401 0.32 0.001 ≥ 101 0.33 0.001 ≥ 800 0.39 < 0.001 ≥ 150 0.13 0.172 MVPA ≥ 1,901 0.20 0.040 ≥ 2,096 0.24 0.016 ≥ 3,200 0.17 0.082 ≥ 500 0.11 0.267 LPA 401-1,900 0.19 0.054 101-2,295 0.14 0.145 800-3,199 0.20 0.043 150-499 0.15 0.043 Sedentary behavior ≤ 400 0.32 0.001 ≤ 100 0.31 0.002 ≤ 799 0.14 0.163 ≤ 149 0.01 0.992 Note. CCPAQ, Children and adolescents movement behaviors questionnaire; PA, physical activity; MVPA, moderate-to-vigorous physical activity; VPA, vigorous physical activity; MPA, moderate physical activity; LPA, light physical activity; rho, Spearman’s correlation coefficient. Table 5. Spearman’s validity coefficients for physical activity variables comparing CCPAQ and accelerometer measurement using different cut points for physical activity intensity
-
This study demonstrates that estimations of daily physical activity energy expenditure, time spent on physical activity and sedentary behaviors in children aged 10-17-years by using CCPAQ were highly reliable and have moderate validity. Boys spent more time on high-intensity activities and had higher energy expenditure compared with girls in this study, consistent with numerous investigations[32, 33]. Physical activity level tended to be higher on weekday than on weekend day, similar to other study[34], indicating that it would be more feasible for self-report tool to divide a week into weekday and weekend day to collect physical activity data.
The overall reliability of CCPAQ was strong and the reliability coefficient was ranging from 0.70 to 0.92. A systematic review illustrated that the median reliability correlation for newly developed questionnaires in youth was 0.68 (ICC) and for existing questionnaires was 0.64 (ICC)[35]. We found better agreement in CCPAQ than the average of other questionnaires. It might be due to the 1-day interval between the two administrations of CCPAQ, as previous studies examining the reliability of questionnaire for measuring physical activity during the past week usually used a time interval of 1 day to 3 months. The CCPAQ can also provide the information on the types of physical activity and showed good reliability. Reproducibility was higher for in-school activity than sports/exercise outside school and household activity. Few studies have examined the reliability for the types of children’s physical activity[36].
For physical activity energy expenditure and time spent on total physical activity, we found that the CCPAQ tended to be more reliable for boys and on weekday. A reliability study by Rangul et al.[37] found that the WHO HBSC questionnaire was more reliable for girls, and another study by Treuth et al. showed no sex differences[38]. The sex differences in our study might be due to the higher intensity of activity and more time spent on competitive sports in boys than in girls. High-intensity exercises tended to be more structured and memorable. The organized activity in physical education on weekday has also been found to be easier to recall and has higher repeatability than free-living activity on weekend day.
The validity correlations between the CCPAQ and the accelerometer for the time spent on total physical activity, sedentary behaviors and physical activity energy expenditure were generally moderate (rho = 0.32, rho = 0.32, and rho = 0.58). Systematic review evidence has shown that the median validity correlations of physical activity for youth was 0.22 (rho) and none of physical activity questionnaires for children showed high validity[35]. The CCPAQ has been shown to be higher validity compared with other 7 day self-report questionnaires, and the difference might be explained by recalling physical activity in a day sequence and classifying physical activity types into categories. However, using one question to assess the achievement of physical activity guidelines (60-minute MVPA per day) in this study might be inaccurate. Conversely, Single-item Physical Activity Measure to this guidelines was found to have moderate validity (rho = 0.44)[39]. Moreover, the CCPAQ seemed to be more valid for boys than girls, which is the same in terms of sex difference with SAPAC measure[18].
Previous validation study of PAQ-C in Chinese suggested limited validity for MVPA compared with accelerometer data (rho = 0.24, P < 0.01)[14]. This is similar to our results for time spent on MVPA (rho = 0.20, P = 0.040). Times spent on MVPA and LPA were less consistent with accelerometer compared with time spent on total physical activity. This might be due to the lack of consensus on homogenizing cut-off points when translating accelerometer intensity into physiologic intensity. The accelerometer cut points for the intensity of physical activity and sedentary behavior among children in the previous studies varied, leading to different estimates of activity intensity[28]. In this study we used an accelerometer threshold that was most appropriate for Chinese youth, but it is broadly in agreement with other thresholds that have been used[24]. As the threshold for when accelerometer data are used to indicate MVPA increases (i.e. a higher cut-point) the number of participants that underreported time spent in physical activity by CCPAQ declined but the validity correlation seemed to be lower. Using of the lowest cut points (Freedson et al).[31] would have resulted in overestimates of accumulated MVPA, which showed no criterion validity in the CCPAQ compared with the accelerometer. As such, it seemed that the threshold used in this study provided a good approximation of physical activity in Chinese children and adolescents. Bland-Altman analyses revealed relatively wide variation in limits of agreement, suggesting that the CCPAQ is more reliable for group physical activity estimates than individual investigations and therefore might be particularly useful as surveillance measure. Compared with the accelerometer data, we also found that the CCPAQ underestimated all the physical activity variables besides physical activity energy expenditure. The mean differences between the two measures were -78.0 min/day for total physical activity, -127.7 min/day for sedentary behavior, and 226.8 kcal/day for physical activity energy expenditure. These differences might be caused by recall bias, especially the recall of a whole day, which might influence the retrospective response. Unlike the other studies which over-reported physical activity levels, our study seemed to be less likely to record the time spent on LPA. The amount of LPA that children participate in represents a very large and trivial fraction of their overall activity, which may be difficult to recall completely and limits the validity of subjective instrument.
Responses to the CCPAQ were compared between boys and girls to determine whether the measure reflected sex specific differences in physical activity and whether the reliability and validity differed by sex. Although sample size deceased due to the stratification analyses, recent study showed that 50 to 99 participants could provide stable agreement estimates between subjective and objective measurement of physical activity[40]. Besides, the response rate in this study was high (88% for validity study) and the general wearing time of accelerometer was long due to the effective study management and implementation using the COSMIN checklist as a standardized tool for research. Thus, this study could provide support for investigating the reliability and validity coefficients of the CCPAQ in both boys and girls.
A feature of the CCPAQ is the integration of a compendium of energy costs designed for the specific types and intensity of physical activities in children. Since youth’s basal metabolic rates decline gradually as they grow and become mature, the CCPAQ converts reported physical activity data to energy expenditure using determinate Metabolic Equivalent (METs) in different age groups. Previous studies examining the validity of energy expenditure in young people indicated limited validity compared with accelerometer data[41, 42]. The higher correlation coefficients found in this study might be due to the use of youth-derived standard METs of specific activities. To our knowledge, this is the first study based on standardized METs reference in children to assess the validity of estimated physical activity energy expenditure from questionnaire compared with the accelerometer. Assessment of physical activity and estimation of its energy expenditure in large scale has many implications for public health, applied research and clinical practice in young population.
The two administrations of the CCPAQ were completed in reference to the same 7-day recall so that the differences between the two administrations only consisted of reporting error with no variation due to the real activity differences over time. However, the short time interval between two administrations in the reliability analyses was a potential limitation as it was possible for participants to recall answers in the first administration. For measuring physical activity during the past week, a time interval of 1 day to two weeks might be appropriate and if there are more questions (e.g. more than 25 questions) and the questionnaires is complicated, the time interval could be shorten[43]. It is also important to recognize that data were collected in two areas in China and the results may not be generalized to other areas of China and other settings.
-
The CCPAQ is a unique questionnaire developed to focus on physical activity pattern and energy expenditure measurements across the whole day during last week for Chinese children. The CCPAQ has been found to be a reliable tool that exhibits acceptable content and construct validity of physical activity pattern. It might be an easy and feasible tool used in children with the highlight of the importance of 24-hour movement behaviors and thus could be particularly useful for large scale surveys and surveillance measures. This study provided insight into a surveillance method for physical activity pattern to fill the gaps in developing countries. Future research is needed to focus on activity components and context to promote physical activity.
-
All authors contributed to the conception of the review and the revision of the manuscript. Prof. ZHAO Wen Hua directed all aspects of the study, including the design of the study protocol, performance of the research and interpretation of the results. Ms. YANG Xi contributed to the conception, design, acquisition, analysis and interpretation of data. Prof. JAGO Russell contributed intellectual input into the main ideas of this paper and assisted the writing of the manuscript. Dr. ZHAI Yi and Dr. YANG Zhen Yu contributed to study design and assisted with writing of the manuscript. Dr. WANG Yu Ying and Ms. SI Xiang contributed to study design. WANG Jun, GAO Jian Fen, CHEN Jing Ron, and YU Ying Jie coordinated the data-collection. All the authors read and approved the final manuscript.
-
All authors would like to thank all the students, parents, teachers and schools who supported this study. The authors gratefully acknowledge the contribution of all project staff from National Institute for Nutrition and Health, Chinese Center for Disease Control and Prevention, Centers for Disease Control and Prevention of Beijing, Chongqing, Yan Qing District and Wanzhou District, especially Dr. ZHANG Qian, Dr. ZHANG Jian, Ms. LIU Dang, Ms. JU La Hong, Mr. YU Wen Tao for the collection of data, and Dr. QIU Jun Qiang from Department of Sports Biochemistry, Beijing Sport University for the loan and help with the accelerometers for data collection.
-
The authors declare that they have no competing interests.
Funds:
This work was funded by National Scientific and Technological Basic Resources Investigation Program ‘Research and application of nutrition and health system for children aged 0-18 years in China’ [2017FY101100]

 Quick Links
 DownLoad: