


-
The high prevalence of diabetes has become a major public health issue worldwide[1], particularly in middle- and low-income countries[2]. The prevalence of diabetes in China, the largest developing country, has more than quadrupled in recent decades, and many cases of diabetes are undiagnosed[3]. The problem with missed diabetes diagnoses is a challenge faced both by China and the rest of the world[4].
Both Chengdu and Chongqing have become new first-tier cities in southwest China, and high-quality management of chronic disease and improving the health of residents in such cities have been important tasks for both the central and local governments. Although community management of type-II diabetes mellitus (DM) has been one of the basic public health services in China since 2009, research conducted by the Health Development Research Center of Ministry of Health in 8 cities, including Chengdu, revealed that the missed diagnosis rate of urban diabetes mellitus was estimated at 53.7%, with the highest rate of missed diagnosis at 95.2% in the 18-44 age group[5]. Previous studies on community management of type-II diabetes mellitus in Chengdu, Chongqing, and even other cities in China, barely reported the potential factors associated with unrecognized DM patients. From the perspective of community management, this study aimed to investigate missed DM diagnoses in the two largest cities in southwest China, and to further examine factors potentially impacting missed DM diagnoses. As the first study of its kind in southwest of China, we believe that evidence from the study should be reported to health management institutions so they can devise relevant strategies to improve DM management in the community.
From September 2013 to March 2014, a cross-sectional survey of adults age 35-74 years was conducted in five urban communities in Chengdu and Chongqing. A multistage and stratified sampling method was used to identify the sample. In the first stage, three districts in the city of Chengdu and two districts in the city of Chongqing were randomly selected. In the second stage, a sub-district was randomly selected from each of the five districts selected in stage one. In the third stage, one urban community was randomly selected from each sub-district. Inclusion criteria for participating in the survey were: residents living for more than 6 months in the selected communities and 35-74 years old. Exclusion criteria were respondents with mental illness, malignant tumors, renal insufficiency requiring dialysis, and refusal to participate in this inquiry. Based on the inclusion and exclusion criteria, 10,707 respondents were eligible, of which 10,120 were enrolled in the study from September 2013 to March 2014. Due to missing demographic information or blood glucose data, 275 records were excluded. Thus, 9,845 respondents were included in the final data analysis. Double data entry was used with Epi Data 3.1 software to minimize human error. Data processing and analyses were carried out using IBM SPSS 25 software. This study protocol was approved by the Institutional Review Board of the Second Chengdu People's Hospital (No. 2013015).
More than 30 investigators were trained to collect data on-site. According to the WHO’s cardiovascular survey methods[6], all subjects completed the same questionnaire, which consisted of five parts: 1) general information, including gender, date of birth, educational background, marital status, medical insurance, and monthly household income per capita during the last year; 2) lifestyle information, including smoking, drinking, frequency of exercise, and eating habits; 3) medical history, including hypertension, DM, coronary heart and kidney disease, stroke, dyslipidemia, and family history of above diseases; 4) physical information, including height, weight, waist circumference (WC) and hip circumference, twice sitting systolic pressure and diastolic pressure, and heart rate; and 5) auxiliary inspection information, including fasting plasma glucose (FPG), two-hour postprandial blood glucose (2-hPG), lipids, uric acid (UA), total cholesterol (TC), triglycerides (TG), high-density lipoprotein cholesterol (HDL-C), and low-density lipoprotein cholesterol (LDL-C). Venous blood was drawn from each respondent after 12 h of fasting. Blood glucose, lipids, and UA levels were measured in all blood samples. Each respondent was asked to drink 300 mL of warm water, in which 75 g of glucose was dissolved, within five minutes. Another venous blood sample was drawn two hours after drinking the sugary water. TC, TG, and blood glucose levels were detected by enzymatic methods. HDL-C and LDL-C levels were measured by homogeneous method. Serum UA was measured by phosphotungstic acid method. All blood samples were sent to the Clinical Laboratory Center of the Second People’s Hospital of Chengdu and the Clinical Laboratory Center of the Second Affiliated Hospital of Chongqing Medical University, and both laboratories are current with the national standards. All blood samples were required to be returned to the Clinical Laboratory Center within 4 h. Blood samples for blood glucose testing were collected using a gray-cap tube containing sodium fluoride, which inhibits glucose digestion.
DM was defined by an FPG level ≥ 7.0 mmol/L, and/or 2-hPG ≥ 11.1 mmol/L, or a previous clinical diagnosis. Overweight was defined as BMI between 24.0 and 27.9, and obesity was defined as BMI of 28.0 or more. Central obesity was defined as WC of 90 cm or more in men and 85 cm or more in women. Based on the criteria of the National Cholesterol Education Program Adult Treatment Panel III Report, hypertriglyceridemia was defined as a TG level ≥ 1.7 mmol/L and hypercholesterolemia was defined as a TC level ≥ 5.7 mmol/L. Smoking/drinking history was defined as smoking/drinking at least once per day over a year, or currently having smoked/drunk or quit smoking/drinking for less than three years. Family history of DM was defined as first-degree family members (parents or sibling) having DM. Physical exercise was defined as performing exercise for more than 30 minutes once a week. Hyperuricemia was defined as a serum uric acid level above 420 μmol/L in men and above 360 μmol/L in women. The fast heart rate (HR) group was defined as having a heart rate of 80 beats/min or more.
Three outcome indexes were considered in the analysis: the overall prevalence of DM, rates of newly diagnosed DM and missed diagnoses of DM. Standardized prevalence of DM was calculated based on age distribution of the urban population taken from the 2010 national census of the two sampled cities, for purposes of comparison. Three multiple logistic regression models were used to identify potential risk factors associated with the above three rate outcomes. Potential risk factors associated with these measurements included gender, age group, education, income, smoking and drinking history, exercise, family history of DM, overweight or obesity, waist circumference, heart rate, TC and TG, and were therefore treated as independent variables.
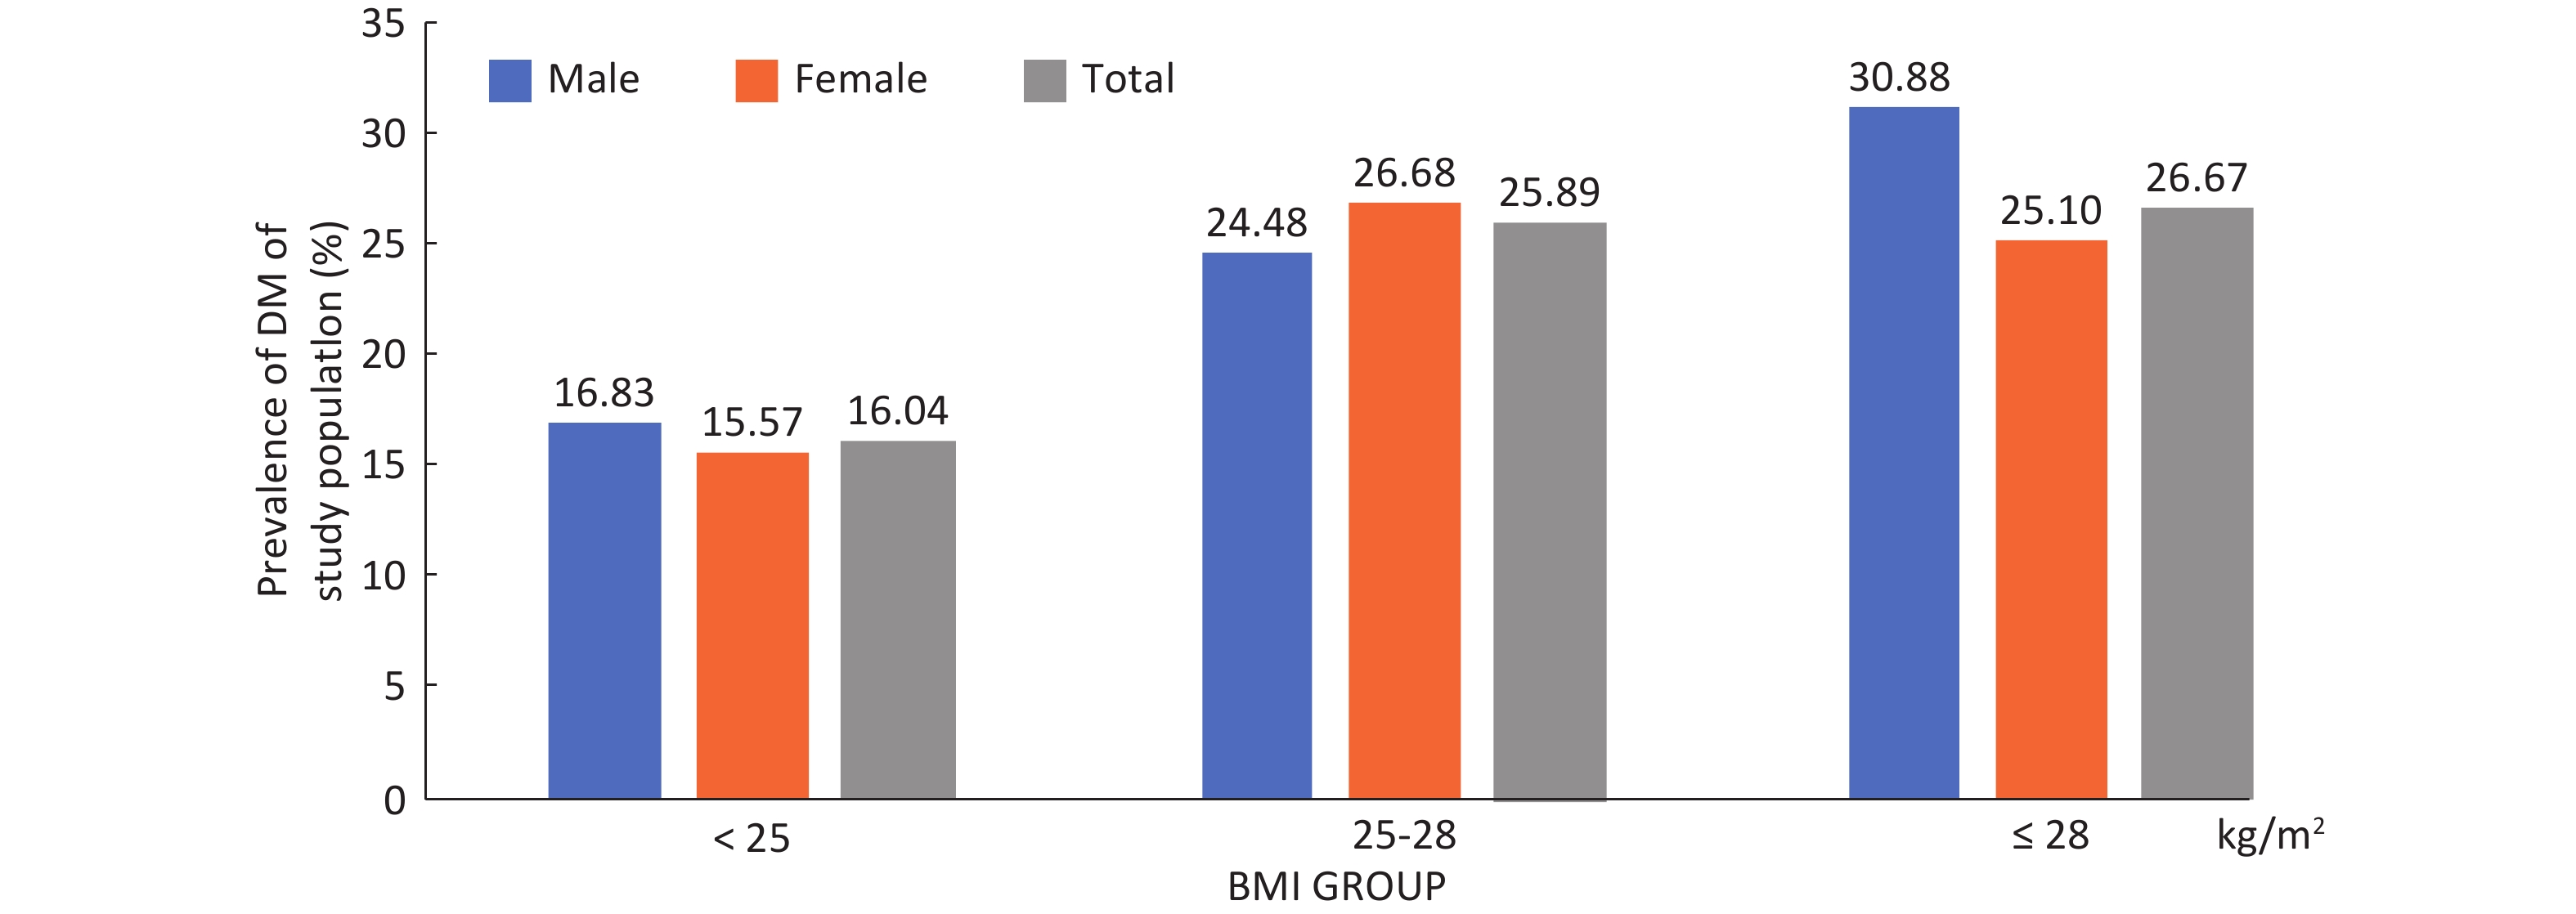
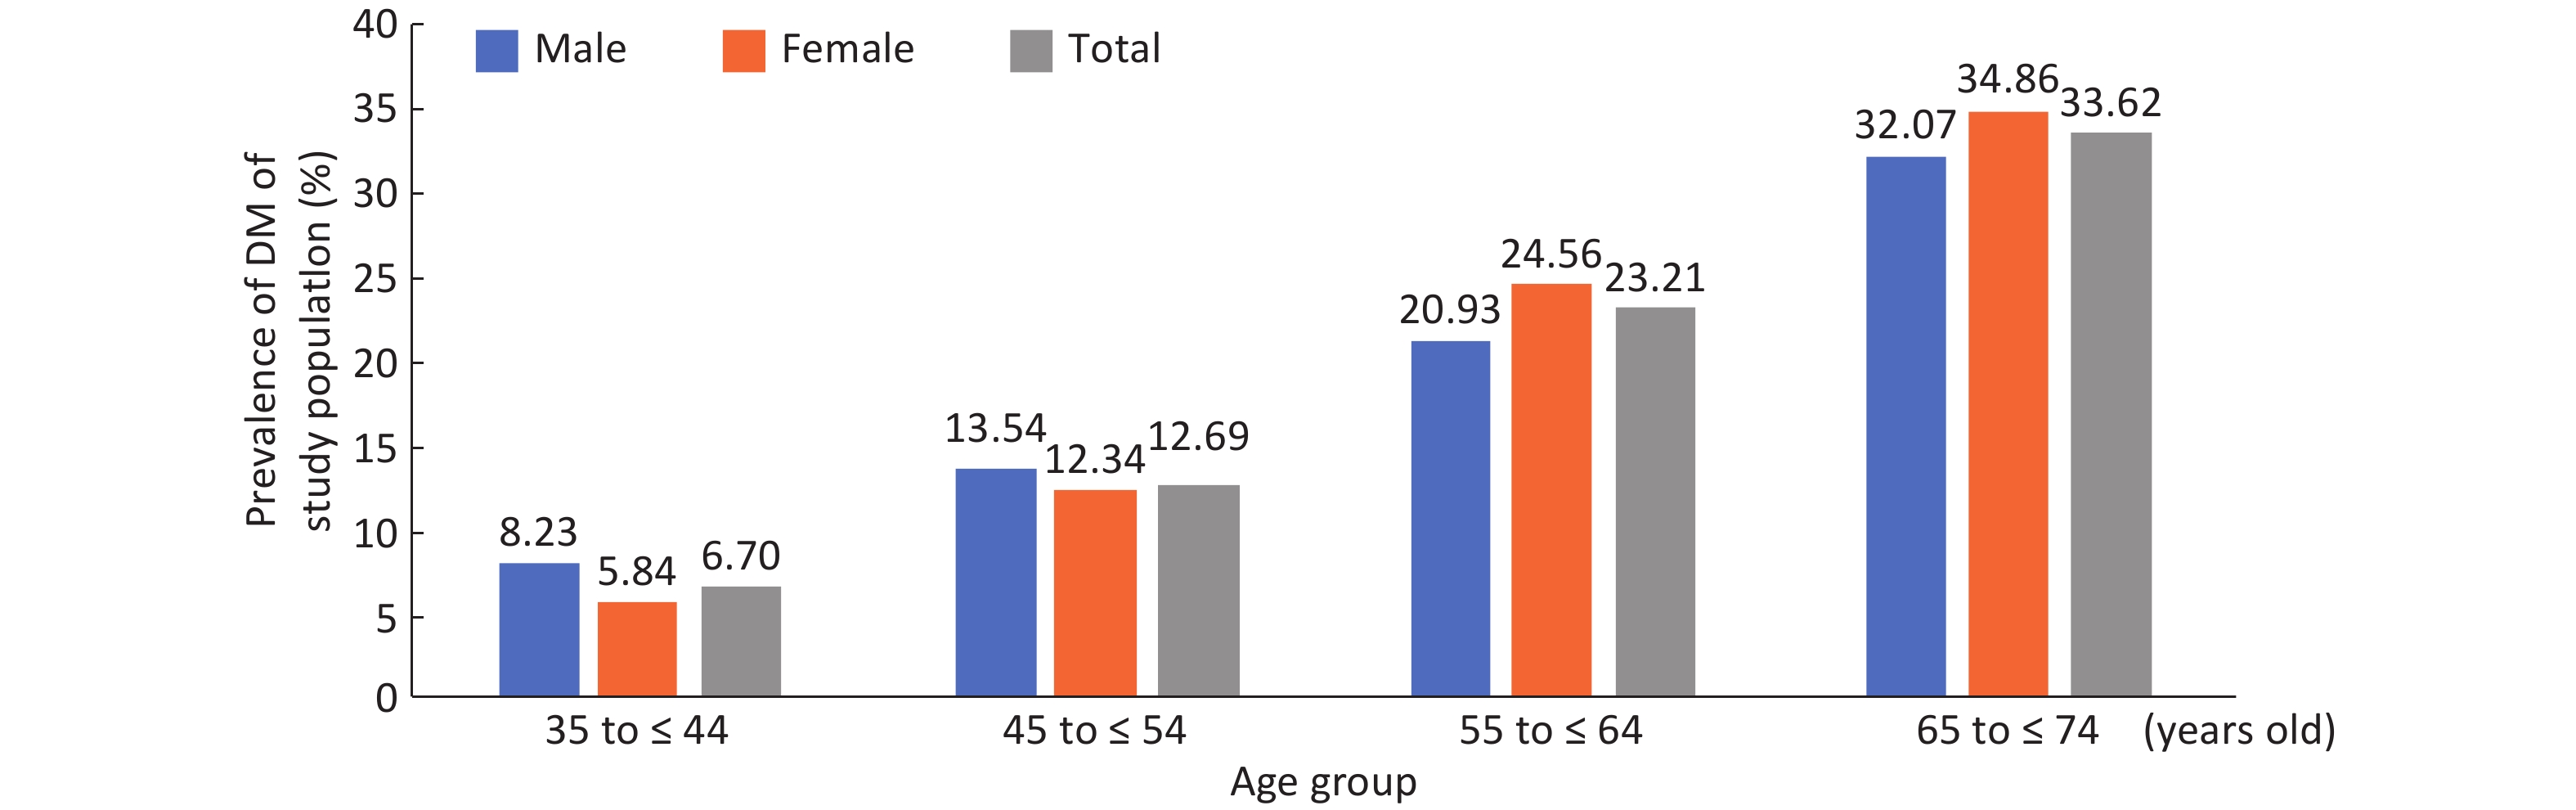
Among the 9,845 respondents in the study, 1,920 (19.50%) 19.78% male and 19.35% female patients were identified with DM, of which 680 (6.91%) had been previously diagnosed and 1,240 (13.53%) were newly diagnosed, with 13.49% men and 13.55% women. No gender difference was found in the prevalence of DM, new DM diagnosis rate and rate of missed DM diagnoses (Table 1). In both genders, DM prevalence generally increased gradually with age and BMI (P < 0.01) (Supplementary Figures S1-S2, available in www.besjournal.com). In total, the rate of missed diagnoses of DM was 64.58% (1,240/1,920), with the highest rate in the 35-44 years old and 25.0-28.0 BMI groups, whose missed DM diagnosis rates were 83.02% and 74.33, respectively. The missed DM diagnosis rate decreased with age and increased with BMI (P < 0.01) (Table 1). Overall standardized prevalence of the previously diagnosed group, newly diagnosed group and combined group was 4.65%, 12.60% and 14.71%, respectively (Supplementary Table S1, available in www.besjournal.com), with no marked gender difference for any one prevalence. The overall standardized prevalence was smaller than the raw prevalence because the standard population from the 2010 national census was somewhat younger than the study sample drawn 4 years later.
Parameter Previously diagnoseda (raw prevalence)
(%)Missed/newly diagnosedb (raw new diagnosis rate)
(%)Raw rate of missed diagnosisc
(%)N (%) 680 (6.91) 1,240 (13.53) 64.58 Gender Male 257 (7.27) 442 (13.49) 63.23 Female 423 (6.70) 798 (13.55) 65.36 Age group (y) 35-44 18 (1.14) 88 (5.63) 83.02** 45-54 81 (2.88) 276 (10.10) 77.31** 55-64 328 (9.10) 509 (15.53) 60.81** 65-74 253 (13.72) 367 (23.07) 59.19** BMI group (kg/m2) < 25.0 446 (6.89) 593 (9.83) 57.07** 25.0-28.0 153 (6.65) 443 (20.61) 74.33** ≥ 28.0 80 (7.62) 200 (20.62) 71.43** Missing 1 (6.25) 4 (26.67) 80.00 Note. DM: diabetes mellitus. aPreviously diagnosed = respondents with personal DM history / each category population × 100%. bMissed/newly diagnosed = respondents without personal DM history but detected out with DM / each category population × 100%. cRate of missed diagnosis = Newly diagnosed / (Previous diagnosed + Newly diagnosed) × 100%, **Rate of missed diagnosis for age & BMI groups, linear trend P < 0.01. Table 1. Prevalence of DM, rate of newly diagnosed DM and rate of missed diagnosed ofDM by gender, Age and BMI group
As shown in Table 2, men in southwest China had higher systolic blood pressure (SBP), diastolic blood pressure (DBP), FPG and UA compared to women, while women had higher BMI, HR, TC, HDL-C and 2 hPG compared to men. Meanwhile, in individuals with missed diagnosis, men had higher UA than women, and women had higher BMI, HR, TC, HDL-C, and 2 hPG than men. Modeling analysis revealed that age, family history, overweight, central obesity, high TC level, high TG level, and high HR were associated with increased possibility of diagnosis of DM (Model 1 in Table 3). Similarly, estimated by Model 2, the above factors except for family history were also significantly associated with the rate of newly diagnosed DM. In addition, there seemed to be a negative correlation between the higher education background and missed DM diagnosis, i.e., people with higher education were less likely to have a missed diagnosis of DM. The missed diagnosis rate of DM in Model 3 showed that among DM patients, those who were older, doing exercise and having a family history of DM were less likely to have a missed diagnosis, while those who ingested fatty foods were overweight and had high HR were more likely to have a missed diagnosis of DM. The findings suggested that in order to reduce the rate of unrecognized DM, more attention should be paid to the population which is younger, less active in terms of exercise, with a high-fat diet, no family history of DM, overweight and with fast HR.
Variables All respondents Respondents missed diagnosis Total
(n = 9,845)Male
(n = 3,534)Female
(n = 6,311)Total
(n = 1,240)Male
(n = 442)Female
(n = 798)aAge (y), mean ± SD 55.54 ± 9.23 56.44 ± 9.61 55.04 ± 8.98 59.09 ± 8.43 59.88 ± 8.54 58.65 ± 8.35 Never smoking (%) 7,512 (77.02) 1,520 (43.33) 5,992 (95.95)** 970 (78.23) 202 (45.70) 768 (96.24)** Never drinking (%) 7,994 (82.17) 1,996 (57.13) 5,998 (96.20)** 1,000 (80.65) 245 (55.43) 755 (94.61)** Education lower than high school (%) 7,373 (75.25) 2,351 (66.70) 5,022 (80.06)** 1,012 (81.61) 303 (68.55) 709 (88.85)** Income less than 2,000 yuan
(about 290 US$) (%)7,771 (80.00) 2,623 (75.44) 5,148 (82.54)** 1,005 (81.05) 323 (73.08) 682 (85.46)** Widowhood (%) 487 (4.98) 63 (1.80) 424 (6.75)** 93 (7.50) 5 (1.13) 88 (11.03)** Physical exercise
(at least once per week %)5,632 (57.72) 1,937 (55.25) 3,695 (59.11)** 732 (59.03) 269 (60.86) 463 (58.02) Family history of diabetes (%) 974 (9.89) 332 (9.39) 642 (10.17) 112 (9.03) 36 (8.14) 76 (9.52) BMI, kg/m2, mean ± SD 23.87 ± 3.49 23.63 ± 3.37 24.00 ± 3.56** 25.05 ± 3.46 24.57 ± 3.64 25.31 ± 3.33** Waist circumference, cm, mean ± SD 81.57 ± 25.84 83.26 ± 27.83 80.62 ± 24.61 85.16 ± 9.95 85.77 ± 9.72 84.83 ± 10.07 SBPb, mmHg, mean ± SD 130.24 ± 21.08 132.17 ± 20.32 129.15 ± 21.42** 141.90 ± 22.59 140.95 ± 21.00 142.44 ± 23.43 DBPb, mmHg, mean ± SD 79.47 ± 19.19 80.88 ± 14.97 78.67 ± 21.17* 84.10 ± 21.15 84.05 ± 11.65 84.12 ± 24.97 Heart rate/min, mean ± SD 80.10 ± 26.60 78.91 ± 28.18 80.76 ± 25.66** 84.73 ± 31.42 83.05 ± 14.88 85.65 ± 37.55 TC, mmol/L, mean ± SD 4.62 ± 0.92 4.49 ± 0.88 4.70 ± 0.94** 4.84 ± 0.98 4.53 ± 0.95 5.01 ± 0.96** TG, mmol/L, mean ± SD 1.62 ± 1.25 1.61 ± 1.24 1.63 ± 1.26 2.03 ± 1.45 1.80 ± 1.40 2.16 ± 1.47** HDL-C, mmol/L, mean ± SD 1.42 ± 0.36 1.36 ± 0.40 1.45 ± 0.34** 1.39 ± 0.36 1.34 ± 0.35 1.42 ± 0.36** LDL-C, mmol/L, mean ± SD 2.52 ± 0.76 2.46 ± 0.78 2.55 ± 0.75 2.62 ± 0.85 2.49 ± 0.86 2.70 ± 0.84** FPG, mmol/L, mean ± SD 5.68 ± 1.99 5.70 ± 1.89 5.67 ± 2.05* 7.20 ± 2.86 7.19 ± 2.91 7.20 ± 2.83 2hPG, mmol/L, mean ± SD 7.85 ± 3.81 7.72 ± 3.84 7.93 ± 3.80* 14.25 ± 5.37 13.87 ± 5.17 14.46 ± 5.47 Uric acid, mmol/L, mean ± SD 290.35 ± 81.42 340.70 ± 83.05 262.33 ± 65.47** 303.93 ± 85.65 338.70 ± 91.66 284.76 ± 75.65** Note. aCompared within genders (male and female). bSBP = (Fist sitting SBP + Second sitting SBP) / 2; DBP = (Fist sitting DBP + Second sitting DBP) / 2. *P < 0.05; **P < 0.01. Table 2. General characteristics of the study population
Variables Model 1a (n = 9,845) Model 2b (n = 9,165) Model 3c (n = 1,920) OR (95% CI) P OR (95% CI) P OR (95% CI) P Age group (y) 35-44 Ref Ref Ref 45-54 1.81 (1.43-2.30) < 0.001 1.74 (1.34-2.26) < 0.001 0.84 (0.46-1.54) 0.569 55-64 3.78 (3.02-4.72) < 0.001 2.65 (2.07-3.40) < 0.001 0.32 (0.18-0.56) < 0.001 65-74 6.44 (5.10-8.13) < 0.001 4.31 (3.32-5.60) < 0.001 0.30 (0.17-0.53) < 0.001 Education group Lower than high school Ref Ref High school and above 0.82 (0.71- 0.94) 0.005 0.80 (0.68-0.94) 0.008 / / Exercise No Ref Yes / / / / 0.73 (0.58-0.91) 0.005 Taking fat-food No Ref Yes / / / / 1.37 (1.02-1.84) 0.040 DM family history No Ref Ref Yes 2.13 (1.81-2.52) < 0.001 / / 0.25 (0.19-0.34) < 0.001 BMI group, kg/m2 < 25 Ref Ref Ref 25 to 28 1.27 (1.11-1.46) 0.001 1.77 (1.50-2.08) < 0.001 2.37 (1.86-3.02) < 0.001 ≥ 28 1.28 (1.05-1.56) 0.013 1.69 (1.35-2.12) < 0.001 1.85 (1.35-2.53) < 0.001 High waist circumferenced No Ref Ref Yes 1.44 (1.26-1.66) < 0.001 1.33 (1.13-1.57) 0.001 / / High TCe No Ref Ref Yes 1.54 (1.32-1.80) 0.001 1.52 (1.27-1.82) < 0.001 / / High TGf No Ref Ref Yes 1.76 (1.57-1.98) < 0.001 1.76 (1.54-2.02) < 0.001 / / High heart rateg No Ref Ref Ref Yes 1.75 (1.57-1.96) < 0.001 2.07 (1.82-2.36) < 0.001 1.71 (1.39-2.12) < 0.001 Note. aOmnibus Tests of model coefficients: χ2 = 1017.538, P < 0.001; Hosmer and Lemeshow Test: χ2 = 16.742, P < 0.05; Predicted percentage correct = 80.9%; Method: Forward stepwise LR; n = 9,845, all the respondents were included. bOmnibus Tests of model coefficients: χ2 = 684.613, P < 0.001; Hosmer and Lemeshow Test: χ2 = 14.210, P > 0.05; Predicted percentage correct = 86.4%; Method: Forward stepwise LR; n = 9,165, excluded the previous diagnosed DM patients. cOmnibus Tests of model coefficients: χ2 = 246.626, P < 0.001; Hosmer and Lemeshow Test: χ2 = 8.863, P > 0.05; Predicted percentage correct = 69.7%; Method: Forward stepwise LR; n = 1,920, included all the diagnosed and newly / missed diagnosed DM patients. dMale: Yes ≥ 90 cm, No < 90 cm; Female: Yes ≥ 85 cm, No < 85 cm. eYes ≥ 5.7 mmol/L, No < 5.7 mmol/L. fYes ≥ 1.7 mmol/L, No < 1.7 mmol/L. gYes ≥ 80 times/minute, No < 80 times/minute. /: variables automatically excluded in the model progress for method of forward stepwise LR. Table 3. Multivariable-adjusted ORs and 95% CI for diabetes among the urban adults 35-74 years of age in southwest china
Based on a relatively large sample of nearly 10,000 urban community residents aged 35 and over in two major cities in southwest China, combined with vigorous statistical modelling analysis, this study revealed a high overall prevalence of DM, with a high missed diagnose rate, and found consistent and preventable risk factors in association with missed diagnosis of DM. Among the risk factors, missed diagnosis in the middle-aged workforce should be the focus of DM screening tests implemented at community healthcare institutes.
This study revealed a 19.50% prevalence of DM, which is higher than that in similar urban populations in developed countries, such as Japan (4.2%, 2018)[7] and USA (10.8%, 2018)[7], or other developing countries, such as India (15.5%, 2006)[8]. It is also higher than other areas in China, such as Qingdao (a city in eastern China, with an 18.8% urban population in 2009)[9] and the average level in China (9.7%, 2017)[10]. Although the respondents’ age ranges in these studies differ, these investigations actually found that, in fact, the increasing trend in DM prevalence is becoming an urgent public health issue for the urban residents located in southwest of China.
The findings that the new diagnosis rate of DM was 13.53% and the rate of missed diagnosis of DM was 64.58% among the total of DM patients indicated that approximately two thirds of the total of DM patients were undiagnosed, which suggests that most diabetes cases had not been captured by current screening and diagnostic practices. Community health centers in urban areas in China have been required to screen and manage DM patients in the community environment since 2009. The high rate of newly diagnosed patients in the study challenged the current screening methods of community health care institutes in identifying new patients, which was also a challenge for health institutions in USA[11]. Further research is required on the current DM screening methods in community healthcare institutes. Moreover, our results indicate that unrecognized diabetes patients are more likely to come from young and middle-aged groups, i.e. the 35-44 and 45-54 age groups, who are the main workforce generating social and family wealth, but are in a state of sub-health or unfit. This group had a lower rate of routine physical examination and could be too busy with work and supporting their families to undergo routine DM screening. According to the current guidelines for managing type-II diabetes patients in China, routine screening for DM should begin at age 35, and for adults who are overweight or obese, screening can start at any age.
The study found similar high-risk factors of newly diagnosed DM as in other studies[1, 4, 10], such as increased age, low education, having a family history of DM, overweight and higher HR. This indicated that the increased number of DM patients in the study population could not be due to new risk factors, but due to either the increasing trend in DM prevalence or a lower diagnostic threshold in the study. The absence of family history is another risk factor that increases the risk of missed DM diagnosis. This has been supported by published investigations[4, 10] suggesting that education on diabetes provided by community healthcare professionals to residents on issues such as family history was effective in motiving them to participate in diabetes screening tests. Therefore, educational outreach programs dealing with diabetes for the non-diabetic family history population may improve their perceptions and acceptance of taking diabetes screening tests routinely.
Our study also found a number of lifestyle factors associated with missed DM diagnosis, such as a high-fat diet, lack of exercise, overweight and increased HR. As these findings were based on patient populations, the results indicated that newly diagnosed patients in the study were more likely to have unhealthy lifestyles and hence be more overweight with increased HR than previously diagnosed patients who were already on medication. Helping patients build a healthy diet, take routine physical exercise, and lose weight were part of the treatment goal in DM management guideline[12]. Previously diagnosed patients have received treatment and management and their lifestyle improved. Our findings showed several effects of treatment and management of DM in the community and suggested that the treatment goal should be implemented in newly diagnosed patients.
This study has several limitations. First, previously diagnosed DM was based on self-reporting, which may lead to mistakes or misclassification. Second, our findings may be influenced by unmeasured confounding such as comorbidities, disease severity, and provider and patient perceptions of DM screening. Third, our results may not be generalizable to populations in other regions, such as the northern part of China, where people may have a different lifestyle and diet due to the different geographic environment and climate. Finally, the lower standardized prevalence of DM indicated that our sample population was somewhat older than the population in the 2010 national census in the two cities. However, considering the rapid aging population in recent years, the sample would be more representative of the current population than the population in 2010.
In conclusion, the high prevalence of DM mostly due to an increased number of new patients and high rate of missed DM diagnosis in southwest China, are both worthy of the attention of primary healthcare professionals and policymakers. Young urban residents with little education, no family history of DM and unhealthy lifestyles were high-risk groups for early missed diagnosis. Therefore, the implementation of health screening strategies for young and middle-aged people could effectively prevent and control the exacerbation of diabetes in these populations.
Items Male Female All Raw Prevalence, % (95% CI) Standardized Prevalence (%) Raw Prevalence, % (95% CI) Standardized Prevalence (%) Raw Prevalence, % (95% CI) Standardized prevalence (%) Previously diagnosed 7.27 (6.42, 8.13) 5.10 6.70 (6.09, 7.32) 4.52 6.91 (6.41, 7.41) 4.65 Newly diagnosed 15.59 (14.26, 16.93) 12.04 15.68 (14.68, 16.68) 13.04 15.65 (14.85, 16.45) 12.60 All DM 19.78 (18.47, 21.09) 14.83 19.35 (18.37, 20.32) 14.80 19.50 (18.72, 20.28) 14.71 Note. The standardized population were the citizens in urban areas aged from 35-74, the data from the last (6th) national population census dataset. Table S1. The Raw and Standardized Prevalence
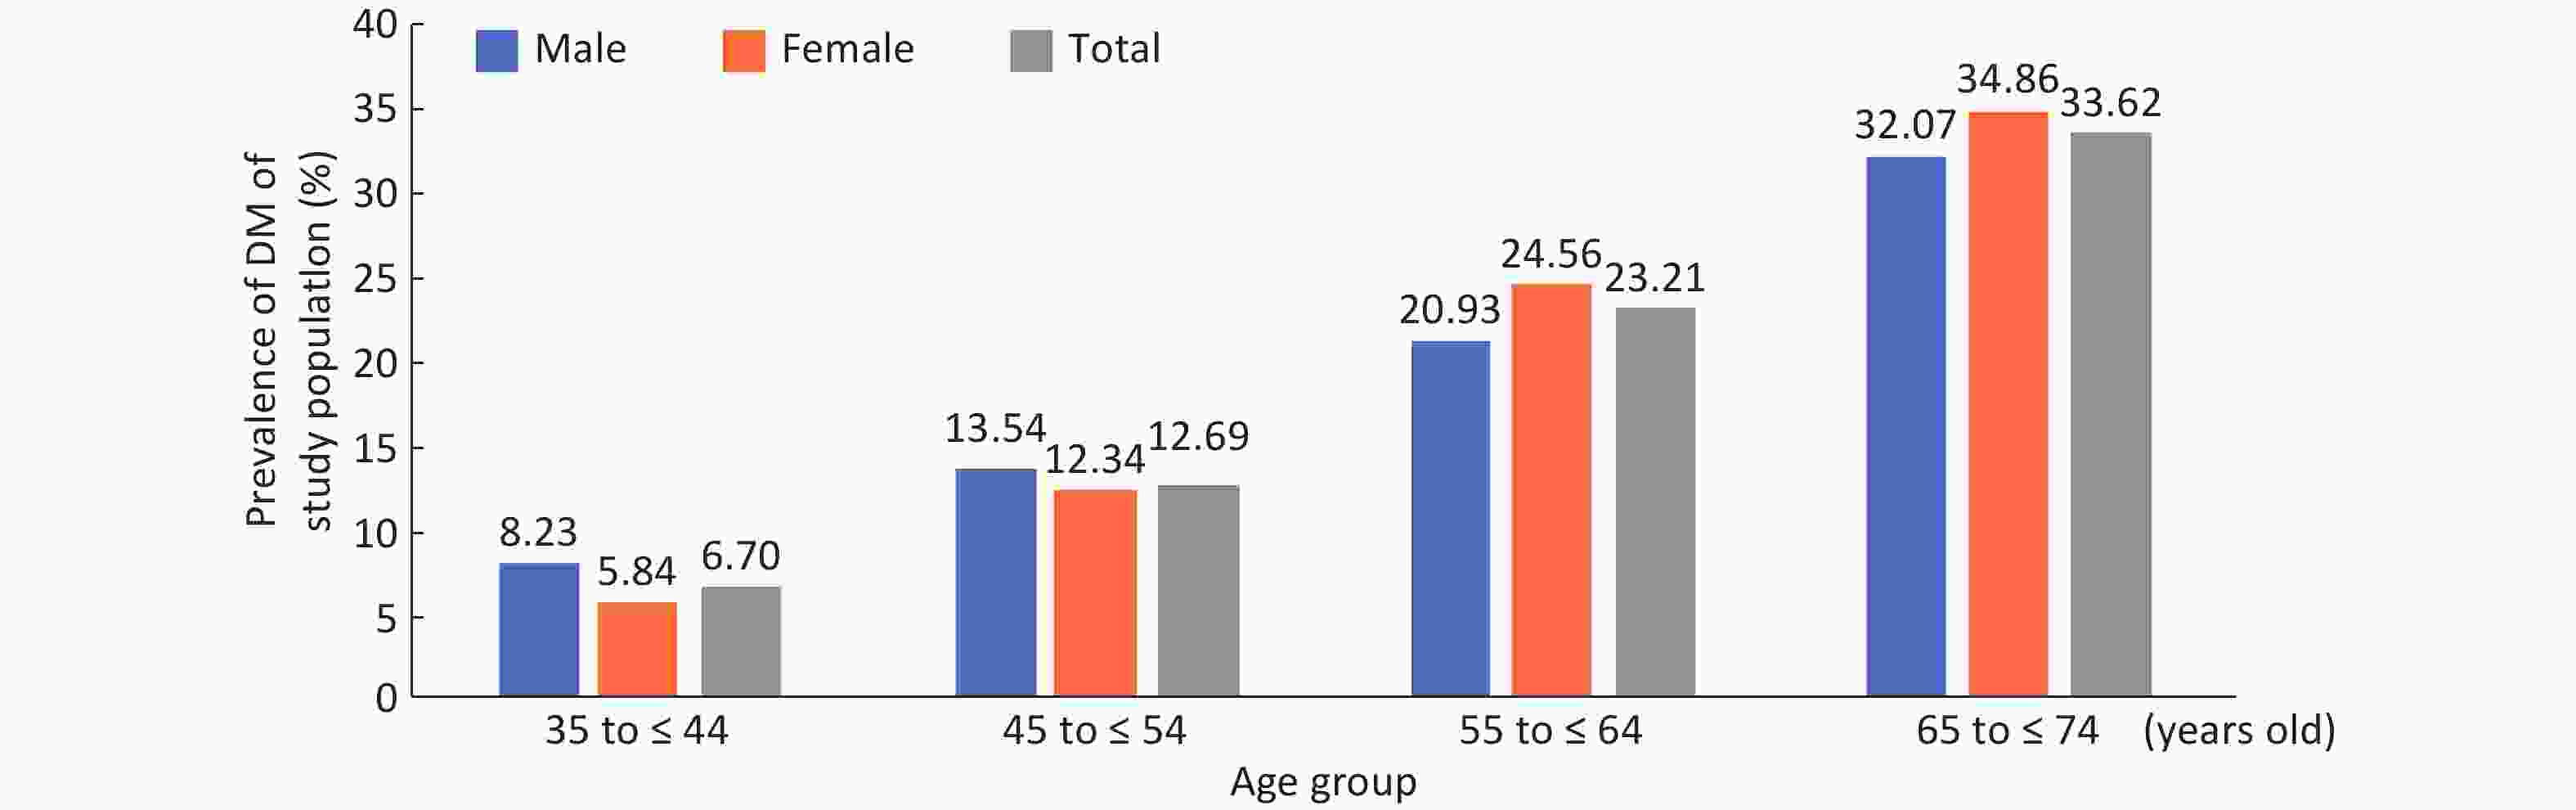
Figure S1. DM prevalence of residents in southwest of China aged more than 35 years old by age group.
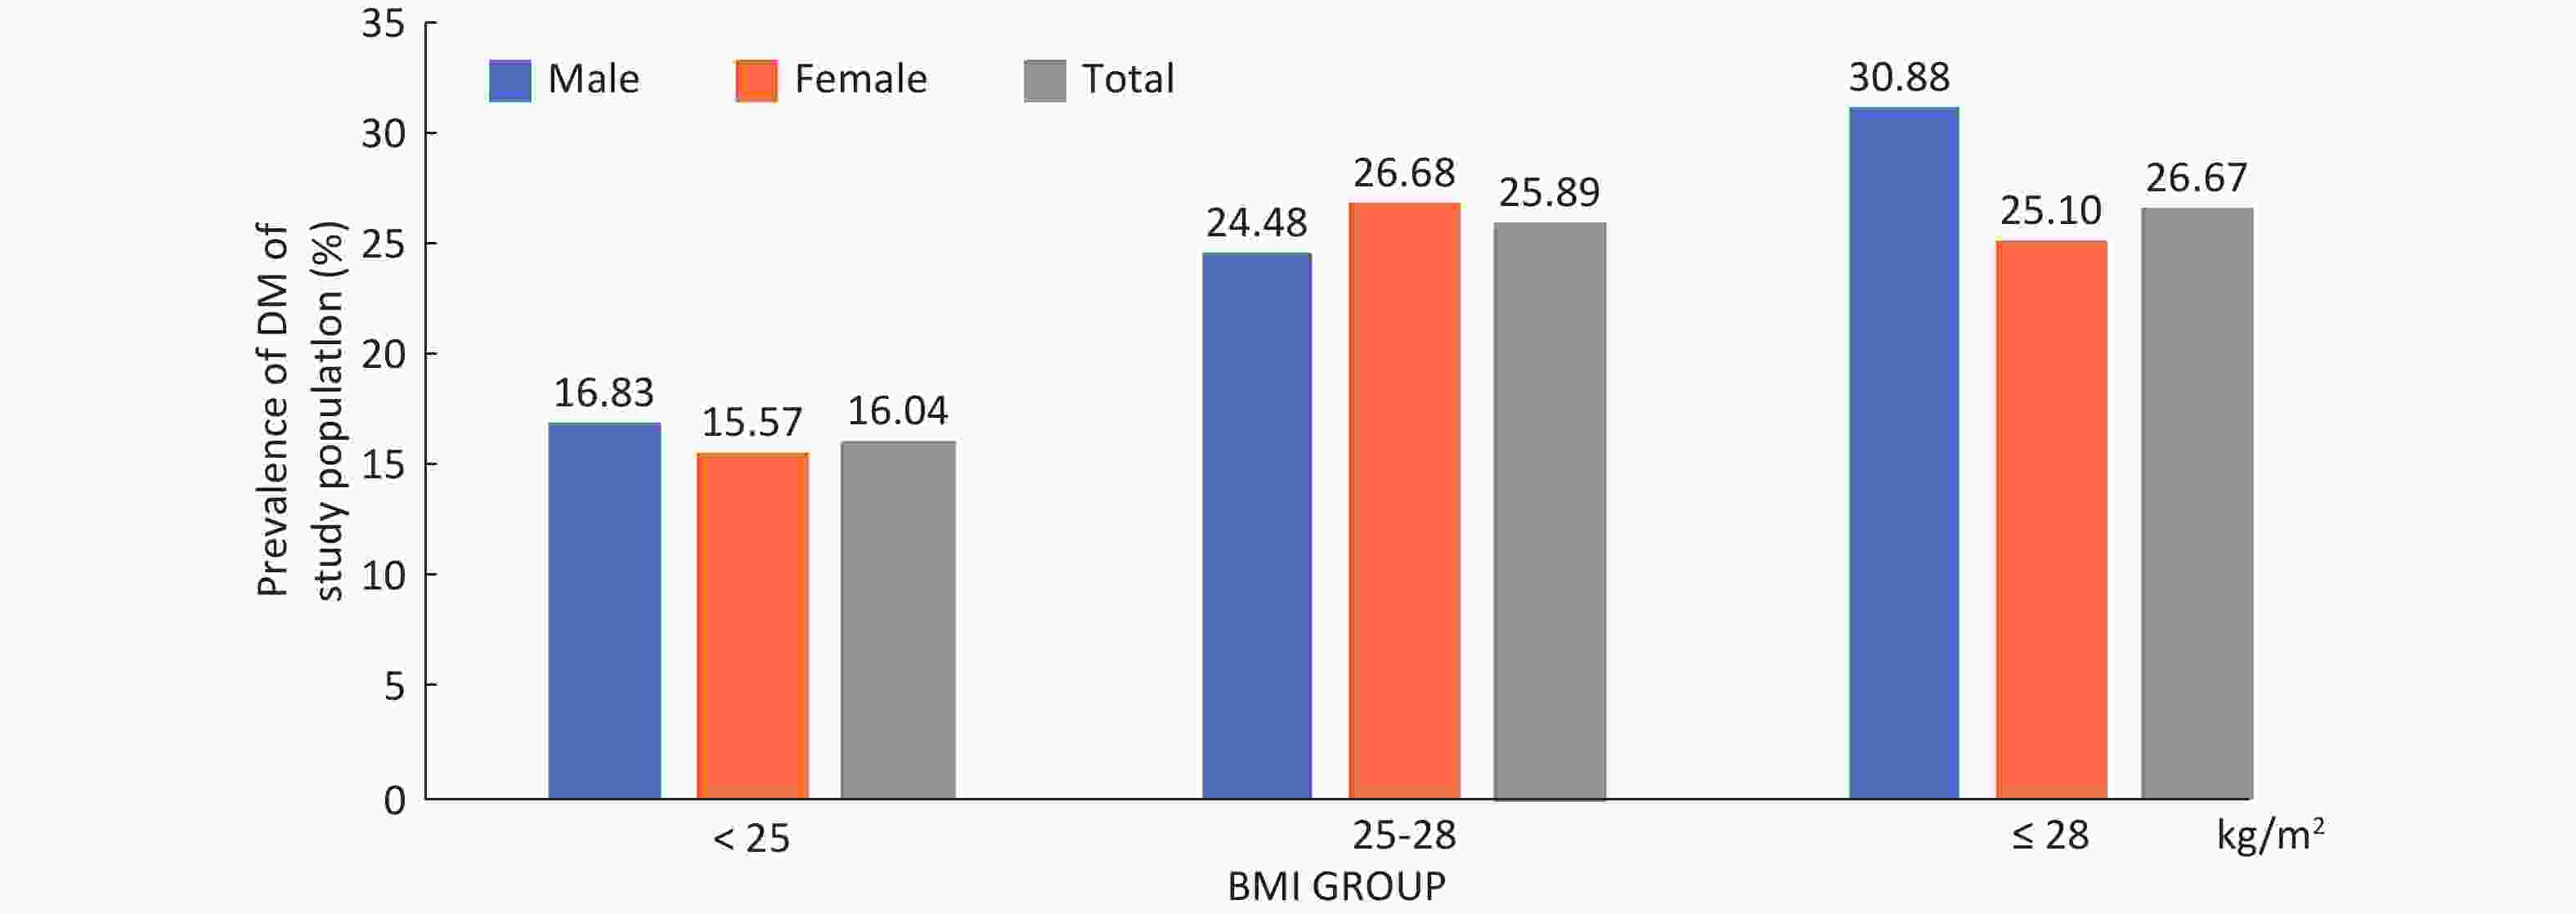
Figure S2. DM prevalence of residents in southwest of China aged more than 35 years old by BMI group.
Funds:
This study was supported by the Szechwan Province Science and Technology Agency Fund Project [2009FZ 0027]; Chengdu, China and the Population and Health Project of the Chengdu Municipal Science and Technology Bureau [10YTYB272SF-182]
Reference 
 Quick Links
 DownLoad: